适用于MetaTrader 4的新技术指标 - 6

Looking for a trading tool based on the CCI indicator that can display crossovers arrows on all time frames? Introducing trading indicator : All Time Frame Double CCI Model S ready to help you achieve daily profits. This tool is created using the intersection of two CCI (Double CCI) indicator lines: the main CCI and the signal CCI. Using this tool makes it easier to observe the real-time dashboard and intersections of multiple timeframes simultaneously. Viewing both higher and lower timeframes
RET System Fast Bias The RET Fast Bias indicator is number 4 of 10 tools in the RET System , revealing when short-term momentum begins to shift against or with the dominant trend.
It helps traders identify the first signs of bias change — when short-term energy confirms, opposes, or precedes the larger market move. Built around Reversal Anticipation , Fast Bias is designed to show when price action is about to change direction before it does. What It Does Displays short-term market bias di

Looking for a trading tool based on the MACD indicator that can display crossovers arrows on all time frames? Introducing trading indicator : All Time Frame MACD Model T ready to help you achieve daily profits. This tool is created using the intersection of two indicator lines of MACD : the main MACD and the signal MACD. Using this tool makes it easier to observe the real-time dashboard and intersections of multiple timeframes simultaneously. Viewing both higher and lower timeframes simultaneou

Looking for a trading tool based on the MACD indicator that can display crossovers arrows on all time frames? Introducing trading indicator : All Time Frame MACD Model S ready to help you achieve daily profits. This tool is created using the intersection of two indicator lines of MACD : the main MACD and the signal MACD. Using this tool makes it easier to observe the real-time dashboard and intersections of multiple timeframes simultaneously. Viewing both higher and lower timeframes simultaneou

Looking for a trading tool based on the Stochastic indicator that can display crossovers arrows on all time frames? Introducing trading indicator : All Time Frame Stochastic Model T ready to help you achieve daily profits. This tool is created using the intersection of two indicator lines of Stochastic : the main Stochastic and the signal Stochastic . Using this tool makes it easier to observe the real-time dashboard and intersections of multiple timeframes simultaneously. Viewing both higher

Looking for a trading tool based on the Stochastic indicator that can display crossovers arrows on all time frames? Introducing trading indicator : All Time Frame Stochastic Model S ready to help you achieve daily profits. This tool is created using the intersection of two indicator lines of Stochastic : the main Stochastic and the signal Stochastic . Using this tool makes it easier to observe the real-time dashboard and intersections of multiple timeframes simultaneously. Viewing both higher
Looking for a trading tool based on the RSI indicator that can display crossovers arrows on all time frames? Introducing trading indicator : All Time Frame Double RSI Model T ready to help you achieve daily profits. This tool is created using the intersection of two RSI (Double RSI) indicator lines: the main RSI and the signal RSI. Using this tool makes it easier to observe the real-time dashboard and intersections of multiple timeframes simultaneously. Viewing both higher and lower timeframes
Looking for a trading tool based on the RSI indicator that can display crossovers arrows on all time frames? Introducing trading indicator : All Time Frame Double RSI Model S ready to help you achieve daily profits. This tool is created using the intersection of two RSI (Double RSI) indicator lines: the main RSI and the signal RSI. Using this tool makes it easier to observe the real-time dashboard and intersections of multiple timeframes simultaneously. Viewing both higher and lower timeframes

Quick Draw Panels lets you instantly draw custom present trading objects (zones and trendlines) instantly with one click from the panel fixed neatly in any chart corner. This is the mt4 version of the product. No more searching through toolbars or menus one click, one object, done. Fully customizable colors, line size, and style.
Ideal For: Institutional / Smart Money Concept (SMC) / Supply and Demand traders. Supply and Demand zone marking. Technical Analysis marking. Liquidity and ICT Order
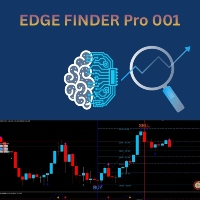
Edge Finder Pro 001 i s your all-in-one visual trading assistant, designed to cut through the market noise and highlight high-probability trading opportunities at a glance. It is an enhanced version with profit-taking levels, improved chart visibility, and greater ease in entering and exiting the market . How It Works (The Core Idea): Instead of overloading your chart with complex numbers, Edge Finder Pro 0 0 1 uses a unique, color-coded system to paint the market picture clearly. Trend & M

Toukou Indicator – Your Winning Edge for Gold and Forex Trading The Toukou Indicator is a powerful trading tool designed to maximize profits in Gold (XAUUSD) and the Forex market .
Built on advanced algorithmic logic, it accurately identifies ideal entry and exit zones , adapting dynamically to changing market conditions. ️ Key Features: Smart Trend Detection: Instantly identifies bullish and bearish market phases. Accurate Buy & Sell Signals: Generated only under the most favorable tr
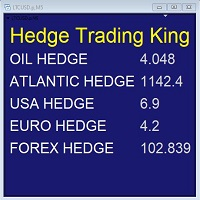
Hedge Trading Monitor e' il mio indicatore che monitora a colpo d'occhio la differenza o il ratio tra due asset utili per fare Hedge trading.
Come si utilizza + scaricare l'indicatore + applicare l'indicatore su un grafico aperto + si possono cambiare gli asset agendo nelle impostazioni.
Distribuzione + e' distribuito solo su MQL5.vom + licenza gratuita (FREE)
FREE
Buy 1 Get 1 Free Key Features and Advantages of VWAP 1. It Shows the "True Price" or "Consensus Price" This is its most important feature. While a Simple Moving Average (MA) gives equal weight to every price, VWAP tells us what the average price really is, based on where the majority of money (volume) agreed to trade. Example: If the price of 100 had 1,000,000 shares traded, but the price of 101 only had 100 shares traded... VWAP will give significantly more weight to the 100 price. 2. It

1. Indicator Purpose and Inputs Overview The Linear Regression Forecaster is an advanced analytical indicator designed to perform comprehensive trend evaluation and short-term price forecasting using the Linear Regression (LR) statistical method.
It is optimized for the Weekly (W1) timeframe and combines both long-term trend analysis and short-term rolling trend dynamics to generate reliable weekly forecasts. The indicator operates using two distinct timeframes : Long-Term Period (e.g., 52 weeks
FREE
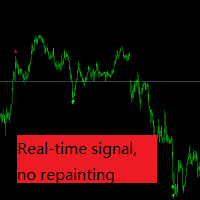
Based on over 10 years of trading experience, we have compiled technical indicators and real-time signals that are suitable for gold trading in various cycles without redrawing. However, we need to set parameters. The default parameter now is one minute cycle gold trading, and the signal is very reliable, with 3 to 5 signals per day. Of course, you can also adjust the parameters to find the one that suits you. After thorough research, we can achieve 100% stable profit. Wishing everyone a prospe

Trend Flow Entry Pro is a simple yet powerful trend-following indicator designed to help you enter the market at optimal pullback points.
The system displays an Entry Signal at the top-right corner of the chart.
When both indicators are blue, a Buy signal is triggered — ideal for long entries.
When both are red, it signals a Sell opportunity — perfect for short trades.
These signals appear only when the market is trending clearly, helping you ride the wave with confidence and avoid sideways

GainLossView – Smart Profit Tracker for Every Trader GainLossView is a powerful yet lightweight indicator designed to give you real-time visual control of your trading performance — directly on the chart.
Whether you trade manually or with Expert Advisors , GainLossView keeps you fully aware of your daily gains, current losses, and total balance with clean, instant updates. Why Traders Love GainLossView GainLossView turns your chart into a live performance dashboard.
It helps you stay conn

This system is very useful for trading because it solves several classic problems: 1. Objectivity & Precision Benefit: It eliminates the trader's personal bias. Every trader might draw a trendline slightly differently, but this indicator uses a precise mathematical logic (Fractals) to find the pivot points. The resulting lines are objective and consistent every time. 2. ️ Dynamic Updates Benefit: Your chart is always current. As soon as a new pivot is confirmed, the new trendline is drawn

Track your daily profit and loss in real time. Displays current account performance, peak gain, and drawdown directly on the chart. Simple, lightweight, and compatible with all symbols. Daily Trade Monitor — Real-Time Daily P&L Tracker for MetaTrader 4 Monitor your trading performance with precision. Daily Trade Monitor is a lightweight, visual indicator that displays your current account profit or loss and captures the maximum profit and loss of the day, indicating the exact time and minute eac

Goldman Balanced PRO, is an Indicator that has merges EMA trend structure, Stochastic Oscillation, RSI Momentum and ATR volatility zones into a single visual indicator. This produces clean zones and show possible areas of bulls and bears supported by confidence meter and retracement filters. this will give an overview of how the market is currently structured.

PairMaster Buy Sell Arrow Indicator for MT4 Trade Reversals Like a Pro — Catch Every Swing Point with Precision The PairMaster Buy Sell Arrow Indicator is a powerful MetaTrader 4 tool built to identify high-probability swing trading opportunities . Designed for traders who value accuracy, clarity, and simplicity, PairMaster detects key market turning points and plots intuitive buy and sell arrows directly on your chart. Key Features Accurate Swing Point Detection – Automatically identifies ma

Game Changer 是一款革命性的趋势指标,适用于任何金融工具,可将您的 MetaTrader 平台升级为强大的趋势分析工具。该指标不会重绘,也不会出现滞后。它适用于任何时间范围,有助于识别趋势,发出潜在反转信号,可用作追踪止损机制,并提供实时警报,以便您快速做出市场反应。无论您是经验丰富的交易员、专业人士,还是寻求优势的初学者,这款工具都能帮助您自信、自律地进行交易,并清晰地了解潜在的趋势动态。
购买后立即联系我,即可获得个人奖励!您可以免费获得我们的强力支撑和趋势扫描指标,请私信我!
请注意,我不在 Telegram 上出售我的 EA 或特殊套件,它们仅适用于 MQL5,我的套件文件也仅在我的博客上提供。 请小心诈骗者 ,不要从其他人那里购买任何套件! 设置
启用趋势变化警报 - 真/假 - 趋势变化时在图表上显示警报 发送推送通知 - 真/假 - 启用手机推送警报通知 发送邮件通知 - 真/假 - 发送趋势变化的邮件通知到电子邮件

Gold Trend M1 - Optimized Scalping Tool for Gold (XAUUSD) Gold Trend M1 is a high-frequency trading indicator for the MetaTrader 4 platform, specifically optimized for the M1 timeframe on the Gold market. It combines a powerful SuperTrend trend filter with buy/sell signals derived from Heiken Ashi calculation logic, helping traders identify precise and disciplined entry points for optimal trading performance.
Key Features Optimized for M1 Scalping: Specifically developed for high-speed scalping

趋势交易是一种策略,交易者力求在价格主要运动方向上建立头寸,并一直持有,直到趋势发生改变。Anti EMA MT4 是 MetaTrader 4 终端的专业指标,在此类交易中可作为实用工具,因为它专注于长期价格数据,有助于识别持续性走势,并避免短期波动造成的虚假信号。 MetaTrader 5 终端的 Anti EMA 版本: https://www.mql5.com/zh/market/product/152766 Anti EMA 与常规移动平均线(如简单移动平均线 SMA 或指数移动平均线 EMA)的关键区别之一在于权重分配方式。标准移动平均线的权重均匀分配,或随时间向过去递减,使其对近期价格更为敏感。而 Anti EMA 则相反,它赋予旧价格更高的权重,新价格更低的权重。这生成了一条更能反映历史背景、对市场噪音反应更弱的曲线。例如,当趋势刚开始形成时,普通 EMA 可能会迅速对价格激增做出反应,而该指标则会更多地参考历史数据,以确认该走势是否真正具有持续性。 在实践中,这意味着该指标有助于过滤噪音并凸显真实趋势。当价格朝某一方向持续运行时,该指标的曲线将平滑地跟随价格,充当动态

银行交易时段线指标
银行交易时段线指标会自动突出显示价格波动的时段。 它能帮助精明的交易者清晰地标记和追踪银行进行交易的关键机构交易时段——亚洲、伦敦和纽约,并提供完全自定义的交易时段线,方便您在图表上进行标记。
专为需要清晰、精准地追踪波动周期的交易者而设计。
为什么选择银行交易时段线?
因为每一次重大价格波动都始于并结束于机构银行的交易时段。 该工具能让您直观地了解银行的交易时段,从而让您只在市场更有可能波动时进行交易,避免在市场不太可能波动时进行交易。 它能帮助交易者仅在流动性发生变化时才与银行进行交易,而这些变化恰好发生在银行构建、锁定和释放价格的时段内。 非常适合识别基于交易时段的虚假突破、流动性扫荡和机构足迹。
功能
在图表上自动绘制交易时段垂直线。 自定义每个交易时段:开始和结束时间。 自定义每条交易时段线:颜色、大小/粗细和线条样式。 为线条添加标签(例如:纽约开盘/收盘等)。 适用于任何时间周期和交易品种。 动态时间转换——自动调整至您的经纪商时区。 简洁的视觉界面——专为专注于价格行为的专业交易者打造。
使用方法
将指标添加到您的图表。 设置您经纪
Advanced UT BOT ALERTS for MT4 專業多重濾波趨勢識別系統|強化版 UT BOT 引擎 我們只提供高品質的指標。 Advanced UT BOT 為專業交易者設計,採用穩定的信號邏輯與安全運算結構,確保無延遲與錯誤更新。
它 不會重繪、不會重畫、不會刪除或修改 任何過去的信號。
所有 BUY 和 SELL 信號均在 K 線收盤後生成並固定 ,確保穩定性與準確性。
在即時行情中 不會重繪 ,信號會在收盤後即時出現。
限時優惠中 —— 下一次價格將調整為 49 美元。
請把握現在的優惠價格,售完即漲。 產品概述 Advanced UT BOT ALERTS 是新一代的趨勢信號系統,基於 UT BOT 的核心邏輯重新打造,
全面升級為 MT5 版本,融合多重濾波、動態視覺化與高精度警報系統。
UT Bot 指標最初由 Yo_adriiiiaan 開發,本版本由 PioneerAlgoFX 團隊深度強化,
在穩定性、精準度與自訂性方面均達到專業級水準,為實戰交易者而設計。 此系統能夠高精準地識別趨勢反轉與動能變化,
透過多層動態濾波與

头皮交易者的 VWAP
会话感知的 VWAP 线,用于快速、精确的头皮交易。 ️ 输入参数(MT4/MT5) Enable_Hourly_VWAP: 启用小时 VWAP。 Enable_Asia_VWAP: 启用亚洲会话 VWAP。 Enable_Europe_VWAP: 启用欧洲会话 VWAP。 Enable_NA_VWAP: 启用北美会话 VWAP。 Enable_Extended_VWAP: 启用扩展会话 VWAP。 Enable_Daily_VWAP: 启用每日 VWAP。 亚洲会话(GMT) Session_Asia_Start_Hour: 亚洲会话开始时间。 Session_Asia_End_Hour: 亚洲会话结束时间。 欧洲会话(GMT) Session_Europe_Start_Hour: 欧洲会话开始时间。 Session_Europe_End_Hour: 欧洲会话结束时间。 北美会话(GMT) Session_NA_Start_Hour: 北美会话开始时间。 Session_NA_End_Hour: 北美会话结束时间。 它的功能 绘制小时、会话(亚洲/欧
FREE

机构流动性压缩指标 该指标通过布林带宽度、成交量和平均点差的标准化测量,实时检测流动性收紧情况,以识别价格突破前的压缩阶段。 显示方式:
专业独立窗口,包含“Compression Score”柱状图与“Threshold”阈值线。 主要特点 早期检测: 在价格波动前识别压缩区域。 多因素测量: 结合布林带宽度、成交量与平均点差的标准化数据。 实时更新: 每个行情跳动(tick)即时刷新。 清晰显示: “Compression”柱状图与虚线“Threshold”参考线。 兼容性: 适用于 MT4 与 MT5 平台。 使用方法 将指标添加至目标品种图表。 根据波动性与交易时段调整阈值与权重。 解读: 当分数较高时,表示出现流动性压缩,需关注潜在突破。 参数说明 BB_Period / BB_Dev: 计算布林带宽度。 Norm_Period: 近期波动性标准化周期。 Vol_Period: 成交量标准化周期(按 tick 计)。 Spr_Period: 平均点差标准化周期(MT5 使用历史数据,MT4 使用即时代理)。 Weight_Width / Weight_Volume / We
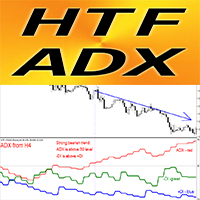
适用于 MT4 的 Crypto_Forex 指标 HTF ADX。
- 使用专业的 MT4 HTF ADX 指标升级您的交易方法。HTF 表示“更高时间框架”。 - ADX(红线)用于衡量趋势强度 - 如果 ADX 值高于 20 且呈上行趋势,则趋势强劲。 - 如果 +DMI(蓝线)高于 -DMI(绿线):价格正在上涨,ADX 衡量上涨趋势的强度。 - 如果 -DMI(绿线)高于 +DMI(蓝线):价格正在下跌,ADX 衡量下跌趋势的强度。 - 如果 ADX(红线)低于 20,则市场处于平盘状态。 - 此指标非常适合多时间框架趋势交易 - 您可以将更高时间框架的 ADX 附加到您当前的图表中。
// 优秀的交易机器人和指标可在此处获取: https://www.mql5.com/en/users/def1380/seller 这是仅在 MQL5 网站上提供的原创产品。

适用于 MT4 的“ DeMarker for 8 Symbols ”外汇指标,无需重绘。
- DeMarker 振荡指标曲线指示指标计算期间当前价格相对于先前高点和低点的位置。 - DeMarker 提供最高效的常规背离信号。 - 它非常适合在超买区域(高于 0.7)进行常规背离卖出入场,以及在超卖区域(低于 0.3)进行常规背离买入入场。 - “DeMarker for 8 Symbols” 允许在一张图表上控制多达 8 个不同符号的 DeMarker 值。 - 该指标也非常适合与超卖/超买区域的价格行为入场相结合。
// 优秀的交易机器人和指标可在此处获取: https://www.mql5.com/en/users/def1380/seller 这是一款仅在 MQL5 网站上提供的原创产品。

适用于MT4平台的加密货币外汇指标“吞没形态和盘整形态”,无重绘,无延迟。
- “吞没形态和盘整形态”在价格行为交易中非常有效。 - 该指标可检测图表上的吞没形态和盘整形态: - 看涨吞没形态 - 图表上的绿色箭头信号。 - 看跌吞没形态 - 图表上的橙色箭头信号。 - 看涨盘整形态 - 图表上的蓝色箭头信号。 - 看跌盘整形态 - 图表上的红色箭头信号。 - 盘整形态本身具有较高的盈亏比(R/R)。 - 支持电脑、手机和邮件提醒。 - “吞没形态和盘整形态”非常适合与支撑/阻力位结合使用。
// 这里提供优秀的交易机器人和指标: https://www.mql5.com/en/users/def1380/seller 这是仅在 MQL5 网站上提供的原创产品。
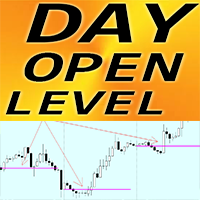
适用于MT4平台的加密货币外汇指标:日内开盘价位
- “日内开盘价位”指标是一个非常实用的辅助指标。 - 日内开盘价位非常重要,因为价格经常会在一天中回到该区域。 - 该指标显示每日的开盘价位。 - 它对日内交易者设置目标价位或用作支撑/阻力位非常有用。 - “日内开盘价位”指标可用于日内反转交易。 .............................................................................................................. // 更多优秀的交易机器人和指标请访问: https://www.mql5.com/en/users/def1380/seller 本产品为MQL5原创产品,仅在MQL5网站提供。

Trend Oscillator Pro 是一款高级自定义加密货币外汇指标,高效的交易工具!
- 采用先进的全新计算方法 - “计算价格”参数提供 20 个选项。 - 迄今为止最平滑的震荡指标。 - 绿色代表上升趋势,红色代表下降趋势。 - 超卖值:低于 5,超买值:高于 95。 - 即使是标准策略,也能通过此指标进行大幅升级。 - 内置 PC 和移动设备提醒功能。 - 指标带有点差信息显示 - 显示所关联外汇货币对的当前点差和隔夜利息。 - 还显示账户余额、净值和保证金。 - 可以将点差信息显示放置在图表的任意位置: 0 - 左上角,1 - 右上角,2 - 左下角,3 - 右下角。
// 这里提供优秀的交易机器人和指标: https://www.mql5.com/en/users/def1380/seller 这是仅在 MQL5 网站上提供的原创产品。
Mean Reversion Probability – 统计性均值回归指标 简短说明
机构级指标,根据历史超延伸分析,计算价格回归到200周期均线(MA200)的统计概率。以量化精度识别市场疲劳区域。 主要功能
高级统计分析 – 基于500+历史延伸数据计算真实概率
概率评分 (0–99%) – 精确量化回归均线的可能性
疲劳检测 – 测量超延伸的持续时间与强度
多资产标准化 – 自动适配外汇、指数、黄金、加密货币、差价合约
智能警报 – 罕见但高度可靠的信号(概率 >80%,持续时间 >15 根K线)
专业级界面 – 清晰、结构化的机构风格设计 方法学
指标实时分析: 价格与MA200的标准化距离(以ATR计) 自上次回归以来的延伸时长 达到最大延伸的时间 与历史平均值比较 概率计算: 距离评分(最高60%):当前值与历史比值 持续评分(最高40%):延伸时间与平均时间比 疲劳加成(+15%):当持续时间 >1.5×最大延伸时间 极端加成(+10%):当距离 >2.5 ATR 推荐用法
机构级策略: 等待概率 >70% 且 距离 >1.5 ATR 通过较长延伸时间确认(绿色
WBP 图表信号 – 多时间框架买卖压力指标 描述:
WBP 图表信号是一款高级指标,通过分析成交量、点差和价格行为来衡量市场压力。适用于寻求精确信号和多时间框架确认的交易者,具有机构级分析风格。 主要功能: 加权买入压力 (WBP): 专有算法结合 VWAP、MA200、成交量强度、流动性因素和动量 多时间框架分析: 自动高时间框架确认,提高信号可靠性 实时多品种扫描: 同时监控6大货币对 精准信号过滤: 7种确认过滤器,包括背离、成交量、趋势及高时间框架确认 专业仪表盘: 实时显示 WBP 值、信号及高时间框架分析 机构级计算: 成交量对数刻度、VWAP 权重及信念因子 信号系统: 买入: 强买 > 75,适中买 > 65 卖出: 强卖 < 25,适中卖 < 35 指标窗口显示箭头;可自定义声音提醒 技术规格: 单独指标窗口,5个缓冲区 可调阈值与确认参数 适用于所有时间框架和品种 无重绘 – 信号在K线收盘确认 优化性能 参数: VWAP 周期 20,MA 趋势 200,EMA 平滑 5,确认柱 2,多重过滤器 适用场景: 日内交易、波段交易、机构成交量分析、多品种市场压力监控

ARB 是一种指标,用于通过自适应 ATR 通道系统和精确的多因素评分模型(0–100)识别高概率的突破机会。
它结合了波动率、成交量、动能以及多周期趋势分析,提供经过筛选、直观且可实时操作的交易信号。 运行原理 该指标基于 Adaptive Range Breakout(自适应区间突破) 的概念,这是一种现代化的突破交易方法,可根据市场波动率(ATR)和价格的动态结构自动调整阈值。
每个信号都会通过加权评分来评估其质量和可靠性,然后再确认。 评分系统组成(0–100) 每个因素都会对总体评分作出贡献,以评估信号强度: 因素 权重 描述 通道中的位置 40% 测量价格在当前 ATR 区域中的位置 接近突破程度 25% 评估价格距离关键阈值的远近 成交量确认 15% 将当前成交量与移动平均值进行比较 高级别趋势(HTF) 15% 检查是否与更高级别周期的趋势一致 近期动能 5% 融入短期价格运动的动量变化

适用于MT4平台的加密货币外汇指标:HTF OsMA震荡指标。
- HTF OsMA是市场上最佳趋势指标之一。HTF代表更高时间框架(Higher Time Frame)。 - 该指标非常适合采用价格行为入场的多时间框架交易系统,或与其他指标结合使用。 - HTF OsMA指标允许您将更高时间框架的OsMA信号附加到当前图表上——这是一种专业的交易方法。 .............................................................................................................. // 更多优秀的交易机器人和指标请访问: https://www.mql5.com/en/users/def1380/seller 本产品为MQL5独家原创产品。

适用于MT4平台的“回测柱状图”加密货币外汇指标,无重绘。
- “回测柱状图”指标可用于在强支撑/阻力位回测后寻找进入主要趋势方向的入场信号。 - “回测柱状图”有两种颜色:红色代表下跌趋势,绿色代表上涨趋势。 - 当您看到连续稳定的同色柱状图时,意味着新的趋势正在形成。 - 回测信号表现为柱状图中第一列颜色与当前趋势相反,第二列颜色与当前趋势一致(参见图片)。 - 该指标内置移动端和PC端提醒功能。
指标使用方法: - 买入信号:持续稳定的绿色柱状图(上涨趋势)+ 一列红色柱状图(回测)+ 一列绿色柱状图(在此处开立多头头寸)。 - 卖出信号:持续稳定的红色柱状图(下跌趋势),柱状图上出现一根绿色柱(回测),再出现一根红色柱(在此处开立空头头寸)。
// 优秀的交易机器人和指标可在此处获取: https://www.mql5.com/en/users/def1380/seller 这是仅在 MQL5 网站上提供的原创产品。
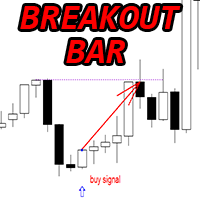
适用于MT4平台的加密货币外汇指标“突破柱形态”,无重绘,无延迟。
- “突破柱形态”指标是一款功能强大的价格行为交易指标。 - 该指标可检测图表上的突破柱形态: - 看涨突破柱形态 - 图表上的蓝色箭头信号(见图)。 - 看跌突破柱形态 - 图表上的红色箭头信号(见图)。 - 支持电脑、手机和邮件提醒。 - “突破柱形态”指标非常适合与支撑/阻力位结合使用。 .............................................................................................................. // 更多优秀的交易机器人和指标请访问: https://www.mql5.com/en/users/def1380/seller 本产品为MQL5独家原创产品。

适用于MT4平台的“随机指标(带警报)”加密货币外汇指标,无重绘。
- 随机震荡指标是市场上最好的指标之一,是众多交易者的理想工具。 - 内置PC和移动端警报功能,可触发超卖/超买区域的入场和出场警报。 - 内置PC和移动端警报功能,可触发随机指标和信号线交叉警报。 - 警报触发阈值可调。 - 超买区域:高于80;超卖区域:低于20。 - 该指标适用于任何时间周期。 - 该指标也非常适合与价格行为技术结合使用。 .............................................................................................................. // 更多优秀的交易机器人和指标请访问: https://www.mql5.com/en/users/def1380/seller 本产品为MQL5独家原创产品。
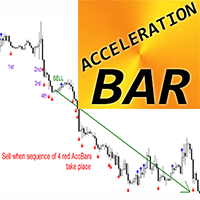
适用于MT4平台的加密货币外汇指标加速柱 - 能够捕捉巨大趋势。
- “加速柱”指标是趋势交易的强大工具,可最大限度地减少市场横盘整理的影响。 - 看涨加速柱(蓝色)是指图表上最高价高于前5根K线最高价且最低价低于后5根K线最低价的K线。 - 看跌加速柱(红色)是指图表上最低价低于前5根K线最低价且最高价高于后5根K线最高价的K线。 - 支持电脑、手机和邮件提醒。
趋势交易: - 买入信号 - 当图表上出现连续4根看涨加速柱时。 - 卖出信号 - 当图表上出现连续4根看跌加速柱时。
// 更多优秀的交易机器人和指标请访问: https://www.mql5.com/en/users/def1380/seller
本产品为MQL5独家原创产品。
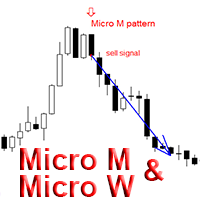
适用于MT4平台的加密货币外汇指标“微型M和微型W形态”,无重绘,无延迟。
- “微型M和微型W形态”指标是一款功能强大的价格行为交易指标。 - 该指标可检测图表上的微型M形态和微型W形态: - 看涨微型W形态 - 图表上的蓝色箭头信号(见图)。 - 看跌微型M形态 - 图表上的红色箭头信号(见图)。 - 内置PC和移动设备警报。 - “微型M和微型W形态”指标非常适合与支撑/阻力位结合使用。 - 可用于任何时间周期。 - 该指标是检测趋势变化或回调结束的绝佳工具。
// 更多优秀的交易机器人和指标请访问: https://www.mql5.com/en/users/def1380/seller 本产品为MQL5官方网站独家销售的原创产品。

Zen Arrows
專為專業用途而設計,它擁有強大的訊號邏輯和安全的運算,可消除延遲或錯誤更新。
它不會重繪、刪除或修改過去的訊號。
所有買入和賣出訊號均在K線圖上產生並保持不變。
在實際交易中,訊號不會重繪-它會立即顯示在K線圖上。
它提供專業級的穩定性、準確性和靈活性。
該系統能夠準確識別趨勢反轉和動量變化,
提供高勝率的訊號,同時最大限度地減少雜訊和錯誤訊號。
主要功能
多級過濾系統(模組化,完全可自訂)
逼真的即時視覺化效果
圖表上直接顯示清晰的買入/賣出訊號
多級警報系統
彈出窗口,聲音提示
每個訊號僅觸發一次-不會重複。
針對MT4平台進行了全面最佳化。
適用於所有貨幣對、指數、股票、外匯和加密貨幣。
趨勢交易、波段交易、反轉確認。
尋求可靠、清晰的專業交易訊號的交易者。
交易者選擇此指標的原因:
高精度和高勝率,經多層過濾驗證。
無噪音、無重繪、無延遲。
清晰的視覺化效果,即時呈現趨勢資訊。
簡單易用、穩定可靠,適用於實盤交易。
FREE

Zentrade助您邁向專業交易。它是一款指標,能夠提供穩定、清晰、精準的訊號,讓您自信交易,無需擔心訊號消失或交易邏輯失效。
永不重繪。買入和賣出訊號在目前K線圖上即時生成,且永久有效。所見即所得。
邏輯不變。歷史訊號不會被刪除或更改。您可以完全自信地分析歷史數據,確保您的測試結果與真實交易相符。
零延遲。訊號在K線形態開始時即刻出現,為您搶佔最佳入場價位提供寶貴優勢。
真實趨勢反轉:精準辨識主要參與者動能轉變的時刻,讓您在行情伊始便可入場交易。
動量讀取:系統精準追蹤價格走勢的速度和強度變化。
多層次模組化過濾:我們的智慧系統過濾掉市場噪音和虛假訊號。您只會收到高獲利率且可立即執行的訊號。您可以根據自己的獨特風格進行自訂設定。
它採用高度複雜但又異常穩定的演算法,能夠洞察大多數人看不到的趨勢:
真正的趨勢反轉:精準辨識主要參與者動能轉變的時刻,讓您在行情伊始便能入場交易。
動量解讀:系統能夠精準追蹤價格走勢的速度和強度變化。
此工具適合以下使用者:
趨勢交易:最大化長期趨勢的有效性。
波段交易:在關鍵反轉點精准入場。
入場確認:可靠地
FREE

"CPD-Pro"-"烛台图案检测器Pro"
(专业蜡烛图案探测器,多级过滤)
主要特点:
1. 蜡烛图案的综合识别(39种):
*强逆转:锤,绞死,吸收,晨/晚星,流星,乌云
*弱逆转:镊子,皮带抓地力,三只乌鸦
*延续模式:垫举行,三种方法,Tasuki窗口
*未分类:闪避模式,反击
2. 多级过滤系统:
*区域水平(多帧H1/H4/D1/W1/MN1)-动态支撑/阻力区域
*圆形水平-可调节间距的心理价格水平
*银行水平-基于格林尼治标准时间的交易时段收盘价
*Fvg(公允价值缺口)-自动填充跟踪的市场效率低下
3. 先进的技术过滤器:
*RSI过滤器-超买/超卖区域过滤
*EMA滤波器-基于快速/慢速EMA交集的趋势滤波器
*CCI分歧-用视觉接触点识别分歧
*RSI差异-识别价格和指标差异
4. 智能验证系统:
*异常蜡烛过滤器(排除极端尺寸)
*检查水平的触摸,考虑到模式的方向
5. 灵活的通知系统:
*声音警报与时间限制
*推送通知到移动设备
*电子邮件分发
指标的优点:
综合方法-在一个系统中结合价格行动、水

PinBar Dashboard Pro - Multifunctional Pattern Scanner Overview PinBar Dashboard Pro is a professional tool for traders that provides real-time scanning of 4 key price patterns on 6 timeframes for a variety of trading instruments. It is an ideal solution for quick market analysis and finding trading opportunities.
Key Features Multifunctional Scanning 4 Patterns: PinBar, Engulfing, Doji, InsideBar
6 timeframes: M30, H1, H4, D1, W1, MN1
Unlimited number of symbols (up to 64 instrument

MA Ribbon PRO – Dynamic Trend Map with Real-Time Direction & Strength (MT4) See the trend instantly!
MA Ribbon PRO shows live direction (Long / Short) and strength (Weak / Medium / Strong) with color-coded precision.
A compact info panel updates on every tick – fast, clear, and intuitive. Why traders love it Real-Time Direction: Instantly displays Long / Short based on current price vs. the main MA. Readable Momentum: “Strength” measures ribbon expansion or contraction over time. Clean Visua

Fibo AUTO Pro:重新定义斐波那契分析——更智能、更直观、更高效 产品概述 Fibo AUTO Pro 是一款专为现代交易者设计的专业级技术分析指标。它基于经典的斐波那契回调理论,进行了全面的智能化增强,旨在解决传统绘图工具在效率、可视化和精准度上的痛点。Fibo AUTO Pro 不仅仅是一个画线工具,更是您洞察市场关键价位、制定精密交易策略的智能伙伴。 核心功能详解 极致灵活的个性化配置 自定义关键水位 :不再受限于默认的斐波那契比率。您可以根据自己的交易策略,轻松添加(如0.886, 0.906)、删除或修改任何回调线与扩展线,打造完全属于您个人的分析模板。 视觉风格自定义 :支持对每一条水平线的颜色、线型和粗细进行独立调整,让最重要的支撑阻力位(如核心的0.618)在图表上脱颖而出。 智能多色视觉系统 自动分区着色 :Fibo AUTO Pro 会自动为不同的斐波那契水平(如0.382, 0.5, 0.618, 0.786)分配鲜明且协调的颜色。这种视觉编码让您在任何时间周期下,都能瞬间识别不同级别的价位,极大提升了图表的多维度信息可读性。 直接价格显示 告别悬停与计

MT4 ATR Stops指标介绍: 这是一个基于平均真实波幅(ATR)的动态支撑阻力指标,通过计算价格的波动性,在K线图上绘制出通道,并以直观的颜色和点状信号提示交易时机。 开仓与平仓位置 1. 开多仓(做多) 信号特征:K线颜色变为绿色,且图表上出现一个绿色的圆点。 逻辑:价格突破了由ATR计算出的动态上轨阻力,表明短期上升动能强劲。 2. 开空仓(做空) 信号特征:K线颜色变为红色,且图表上出现一个红色的圆点。 逻辑:价格跌破了由ATR计算出的动态下轨支撑,表明短期下跌动能强劲。 3. 平仓(多单或空单) 信号特征:当出现与您当前持仓方向相反的信号时,即为平仓时机。 平多仓:当出现红色K线和红点(即开空仓信号)时,应平掉多单。 平空仓:当出现绿色K线和绿点(即开多仓信号)时,应平掉空单。 指标特性总结 核心设置:使用ATR周期10和移动平均周期2来构建一个反应灵敏的动态通道。 视觉直观:通过Display

GalaxyReversalPro — Trend Signal Indicator
GalaxyReversalPro is a signal-based trend indicator designed for traders who value simplicity, accuracy, and reliability.
It’s extremely easy to use and requires no additional setup.
The tool helps you enter new trends early and exit before corrections begin — maximum precision with minimal risk.The algorithm is based on structural-impulse analysis: it tracks local highs and lows, detects breakouts of key levels, and confirms trend reversals only af

Galaxy Force Analyzer - is an intelligent indicator for analyzing market volume and strength. It combines data from indicators like Force, OBV, MFI, AD, and others with advanced algorithms for acceleration and filtering to show the energy of price movement — the moment when a trend gains strength or begins to weaken. The indicator doesn’t just display volume — it measures impulse power, acceleration, and the speed of pressure changes between buyers and sellers.
Signals: Everything on the chart

NGC Quark
I tested this indicator on a 1-year timeframe (January 2024 – January 2025), on M15, with Take Profit of 5 pips, without Stop Loss, on the EURUSD pair.
Out of 351 trades, only 12 were lost.
Signals are shown by blue circles (Buy) and red circles (Sell).
The indicator works on all currency pairs and all timeframes.
I recommend M15 – D1 intervals.
Exits, from a few pips (as in the example above) or TMA NRP lines, Support, Resistance lines, etc.
- For this indicator to work, you n
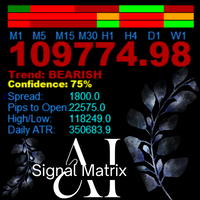
AanIsnaini Signal Matrix Multi-Timeframe Confidence Signal Dashboard AanIsnaini Signal Matrix is a powerful all-in-one indicator that analyzes market direction and confidence levels across multiple timeframes — allowing traders to see the overall bias of the market at a single glance. It combines signals from Price Action , Support–Resistance , and several proven technical tools (MACD, ADX, RSI, MA slope, ATR, and Volume Ratio), then calculates a confidence score showing how strongly th
FREE

Presenting "Market Analyzer" — a convenient and reliable indicator‑informer for MetaTrader 4 that quickly shows the prevailing market force across multiple timeframes. The indicator combines trend and momentum indicators (EMA, ADX, MACD, RSI) with a volatility filter (ATR), aggregates signals with configurable weights, and outputs an overall score and a simple trading suggestion: "Trade Up", "Trade Down", or "No Signal".
Why choose this indicator:
Compact and informative — all key market para

The proposed indicator is based on the method of William D. Gann (1878-1955), which uses the relationship between price and time. In this method, the relationship is expressed as follows: Price = Time squared or P = t ² This relationship between price and time can be represented graphically. To do this, a significant Low and a significant High are taken from the chart. A parabola is then constructed using the “Parabolic_Gann” indicator. Next, a new parabola is constructed from the base that ap
We have always believed that the most efficient and intuitive methods can bring good results. M1 Breaking Point: An Intuitive Trading Indicator System
M1 Breaking Point is an exceptionally intuitive trading indicator system, meticulously engineered for the M1 timeframe. It functions seamlessly as a standalone system for scalping or minor trend trading on fast-moving one-minute charts, and also integrates effortlessly into your existing trading strategy to enhance decision-making efficiency.
W
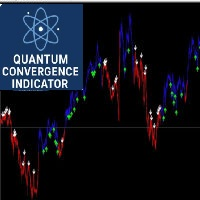
Strategy Overview The Quantum Convergence Indicator is an advanced multi-dimensional trading system that identifies high-probability entry points by analyzing the convergence of multiple market dimensions. This sophisticated algorithm detects when price action, momentum, and volatility align to create optimal trading opportunities. Key Features Multi-Dimensional Analysis Trend Dimension : Analyzes market direction using dual momentum oscillators Momentum Dimension : Measures market strength and
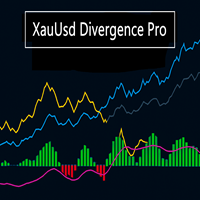
The XAUUSD Divergence Pro is a specialized technical analysis tool designed specifically for gold traders. This indicator operates in a separate window and provides a unique perspective on market dynamics by comparing the relative strength of XAUUSD against a custom-calculated USD index. The tool displays two main lines representing momentum indicators for both gold and the US dollar, with a histogram that visually highlights significant divergence patterns between them. These divergence signals
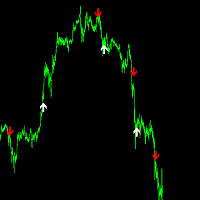
The 5-minute trend buying and selling point reference for gold has an accuracy rate of 90%. All signals are not redrawn, Parameters need to be adjusted for different varieties and periods. The default value for gold trading is the 5-minute period. You can carefully study what direction guidance is suitable for you. We hope you can make money and it is worth referring to for professionals and novice traders. Stop loss is at the end of the line, real-time signal. Welcome to use it. If you have an

Hi Traders,
On purchase this tool we will give lifetime free updates for this tool
you can contact me how to use this tool better or your suggestion for improvement
This tool will work on any accounts
Where When Enter Exit – Trade Plotter helps traders easily see, track, and review their sell trades directly on the chart.
It clearly shows where you entered, when you exited, and why , so you can quickly learn from every trade. Key Features Auto Plot Entries & Exits

Gold Rush FVG (Multiple Time Frame) - Professional Fair Value Gap Indicator Product Description Discover hidden trading opportunities with Gold Rush FVG , a powerful visual tool that automatically identifies Fair Value Gaps on your charts across multiple timeframes. Fair Value Gaps are price 'imbalances' that occur when the market moves so quickly that it leaves "gaps" in normal trading activity. These gaps often act as magnets, with price returning to fill them later - creating the potential fo

The Signal Premium Pro System SMART ANALYZER SYSTEM V3 (2025) – Next Generation Market Intelligence for Traders Smart Analyzer System V3 is a professional trading indicator for Forex, Gold (XAUUSD), and Indices. It provides real-time buy/sell signals, automatic levels, multi-timeframe analysis, and adaptive trading modes for scalping, intraday, and swing strategies. Trade smarter with precision, clarity, and confidence.
forex indicator, xauusd, gold trading, mt4 indicator, mt5 indicator,
The Strat Dashboard – Rob Smith 策略专用多符号模式扫描仪
以实时多符号 Strat 分析,提升您的交易表现
The Strat Dashboard 是一款强大、专业级别的指标,专为使用 Rob Smith 著名 “Strat” 交易方法的交易者设计。它可同时监控无限符号、跨多个时间框架,瞬间识别高概率设置,再也不会错过任何可操作的模式。 MT5 Version :- https://www.mql5.com/en/market/product/153384/
什么是 “The Strat”?
The Strat 是由 Rob Smith 开发的一种革命性价格行为交易策略,专注于识别特定的蜡烛图模式及其跨时间框架的关系。该方法根据蜡烛与之前蜡烛的互动,将每根蜡烛分类为编号类别,创造出一种通用语言,用于解读价格行为,可应用于任何市场、任何时间框架、任何时刻。 The Strat 蜡烛分类系统: 1 Bar (Inside Bar):当前蜡烛的高点低于前一蜡烛的高点 且 低点高于前一蜡烛的低点 — 表示盘整 2 Bar (Directional
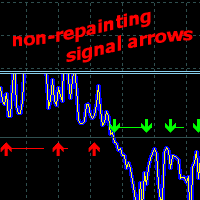
Price Direction Oscillator - 款用于监测短期和中期市场走势的指标。它适用于任何市场和时间框架。
它包含一条趋势线、- 个市场波动率震荡指标和一个潜在的交易信号生成器。
指标用途
它根据市场波动率判断趋势,并提供开立买入或卖出订单的信号。 信号箭头无需重新绘制历史数据,颜色保持不变,并会在K线图收盘时显示。 根据信号,预测的价格走势将以线条形式绘制。 在M1-M5时间框架下,该指标适用于剥头皮交易,在其他时间框架下,则适用于中期交易。 该指标始终位于价格图表底部,不会造成价格图表过载。 提供多种警报类型。
它可以作为独立指标使用,也可以作为辅助工具,减少技术分析中的不确定性。输入参数允许交易者自定义指标,根据时间框架和各种交易工具调整趋势周期和市场噪音平滑。 For M1 and M5 timeframes, increase the "Noise Smoothing" parameter.
For XAUUSD and other highly volatile instruments, multiply the "Noise Smoothing" v
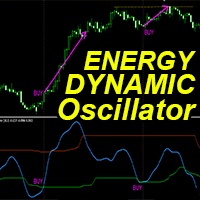
“动态能量震荡指标”是一款高级自定义加密货币外汇指标,适用于 MT4 平台,高效交易!
- 新一代震荡指标 - 请查看图片了解如何使用。 - 动态能量震荡指标具有自适应超卖/超买区域。 - 这是一个技术动量指标,在趋势市场中非常有用。 - 震荡指标是一种辅助工具,可帮助您从超卖/超买区域找到准确的入场点。 - 超卖值:低于绿线,超买值:高于橙线。 - 它比标准震荡指标更精准。适用时间范围:30 分钟、1 小时、4 小时、1 天、1 周。 - 提供 PC 和移动端提醒。 ................................................................................................................. // 优秀的交易机器人和指标可在此处获取: https://www.mql5.com/en/users/def1380/seller 本产品为独家产品,仅在 MQL5 网站上提供。

适用于 MT4 的 Crypto_Forex 指标“HTF 布林带”。
- 使用适用于 MT4 的专业指标“HTF 布林带”升级您的交易方法。HTF 代表“更高时间框架”。 - 布林带是市场上最优秀的指标之一,是完美的交易工具。 - 大约 90% 的价格波动发生在两个布林带之间。 - HTF 布林带指标非常适合多时间框架交易系统,可设置价格波动入场点,或与其他指标结合使用。 - 此指标允许您将更高时间框架的布林带附加到您当前的图表中。 ................................................................................................................. // 优秀的交易机器人和指标可在此处获取: https://www.mql5.com/en/users/def1380/seller 这是仅在 MQL5 网站上提供的原创产品。
技术说明 Nexus Signal System 是一款 MT4 指标,结合了 12 个技术指标来生成交易信号。该系统在确认信号前会分析多种因素的共振(趋势、动量、成交量、支撑/阻力区),与只使用单一指标的工具相比,可减少假信号的数量。 分析标准(评分 0–15 分): 图形形态识别(Pin Bar、吞没形态) 多时间框架分析(高时间框架趋势确认) ADX 市场状态(避免无趋势市场) 支撑/阻力区(自动识别波段点) 均线 20/50/200(趋势对齐) RSI 14 周期(动量指标) 相对成交量(机构确认) ATR(波动率) 功能特点: 带透明评分的信号(0–15 分) 自动检测支撑/阻力区并在图表上显示 初步信号(当前K线)与确认信号(已收盘K线) 止损和止盈通过 ATR 计算 实时市场信息面板 8 种颜色主题可供视觉定制 56 个可配置参数,可适应您的交易风格 使用方法: 安装: 在 MetaEditor 编译并加载到图表 关键参数: Min_Signal_Score :设置最低信号质量阈值(默认 6.5/15) MTF_Timeframe :确认用时间框架(默认 H4) Colo
技术说明 Nexus Signal System 是一款 MT4 指标,结合了 12 个技术指标来生成交易信号。该系统在确认信号前会分析多种因素的共振(趋势、动量、成交量、支撑/阻力区),与只使用单一指标的工具相比,可减少假信号的数量。 分析标准(评分 0–15 分): 图形形态识别(Pin Bar、吞没形态) 多时间框架分析(高时间框架趋势确认) ADX 市场状态(避免无趋势市场) 支撑/阻力区(自动识别波段点) 均线 20/50/200(趋势对齐) RSI 14 周期(动量指标) 相对成交量(机构确认) ATR(波动率) 功能特点: 带透明评分的信号(0–15 分) 自动检测支撑/阻力区并在图表上显示 初步信号(当前K线)与确认信号(已收盘K线) 止损和止盈通过 ATR 计算 实时市场信息面板 8 种颜色主题可供视觉定制 56 个可配置参数,可适应您的交易风格 使用方法: 安装: 在 MetaEditor 编译并加载到图表 关键参数: Min_Signal_Score :设置最低信号质量阈值(默认 6.5/15) MTF_Timeframe :确认用时间框架(默认 H4) Colo

Crypto_Forex MT4 版“修正突破形态”指标,无需重绘,无延迟。
- “修正突破形态”指标是价格行为交易的强大指标。 - 指标可检测价格修正后的看涨和看跌突破条: - 看涨修正突破形态 - 图表上显示蓝色箭头信号(见图)。 - 看跌修正突破形态 - 图表上显示红色箭头信号(见图)。 - 支持 PC、手机和电子邮件提醒。 - “修正突破形态”指标可与支撑/阻力位结合使用。 ................................................................................................................. // 优秀的交易机器人和指标可在此处获取: https://www.mql5.com/en/users/def1380/seller 本产品为独家产品,仅在 MQL5 网站上提供。
VolumeRejectionSignals v5.0 高级成交量分析指标 总体描述
VolumeRejectionSignals v5.0 是一款先进的技术指标,旨在通过对成交量拒绝的深入分析,精确识别价格的重要波动。
通过结合订单流动态与市场结构,它能够检测出买方或卖方压力减弱的区域,从而提前预判趋势反转或趋势加速。 智能评分系统
该指标基于加权评分系统,对每个信号的质量进行 0 至 100% 的评估。
信号被划分为三类: 标准型: 50–65% 强力型: 65–80% 高级型: 80% 及以上 这种分级方式有助于评估信号的可靠性,并根据信心水平调整交易策略。 过滤与自定义
VolumeRejectionSignals v5.0 提供多种可配置过滤器,可根据市场环境优化信号检测: 趋势过滤(上升、下降或中性) 波动率过滤(避免过于平静或过度波动的市场) 交易时段过滤(伦敦、纽约、亚洲) 成交量强度过滤(筛选最显著的拒绝信号) 内置多周期分析功能,可跨多个时间周期验证信号,提高分析的稳健性与一致性。 警报与可视化界面
信号实时生成,并配备完全可自定义的警报(声音、视觉或推送通
MetaTrader市场是一个简单方便的网站,在这里开发者可以出售自己的交易应用程序。
我们将帮助您发布您的产品,并向您解释如何为市场准备您的产品描述。市场上所有的应用程序都是加密保护并且只能在买家的电脑上运行。非法拷贝是不可能的。
您错过了交易机会:
- 免费交易应用程序
- 8,000+信号可供复制
- 探索金融市场的经济新闻
注册
登录