适用于MetaTrader 4的新技术指标 - 92

TPSpro Screenshot is an indicator that screenshots the chart workspace and saves it to a folder you specify on your computer with a specified resolution and at a specified time interval. The following configurable parameters are available: Screenshot Width - Screenshot width Screenshot Height -Screenshot height The name of the folder for screenshots (by pressing "]") - The name of the folder for screenshots Rewritable File Name - Name of the file being rewritten Step in seconds for a photo - Ste
FREE

The Supertrend draws a line following the current trend.. Green Line under the candle means a likely bullish trend Red Line above the candle means a likely bearish trend
How to trade with SuperTrend indicator Buy when the Supertrend Green line is below the price, Sell when the Supertrend Red line is above the price. It is strongly suggested to use this indicator in a trending market.
Parameters Multiplier - the lower it is and the more sensitive is the line, meaning it will follow the price
FREE

it is an indicator for trading on the forex market and binary options, it is a trend tool with which you can take it most often when the first signal appears, open a trade in the indicated direction stop loss set above the arrow if the signal is lower or below the arrow if the buy signal when signals appear in the same direction where the transaction is open, you can enter into additional stop loss orders; we also set up trading without take profit; you need to close the transaction when a signa

Scalping Modulator is a scalping trading system. The indicator consists of several analytical modules. It automatically analyzes the market and shows the trader all the necessary information for trading. Scalping Modulator draws two trend lines on the chart. One line shows the long-term direction of the price, the second line shows the medium-term direction of the price. The indicator also draws red and blue dots on the chart. They indicate a likely change in price movement. In order to open a
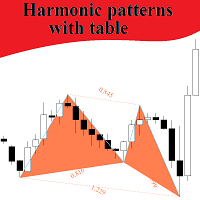
This indicator searches harmonic patterns on different TFs, and can track patterns in real time on all TFs for seted symbols. High and Low points for patterns defined by Bill Williams method, not by Zigzag or Fractals, it's more clear signals. Important input parameters: Where patterns search : "Current symbol" - searches patterns on the current symbol; "Seted symbols" - indicator creates table with seted symbols. Allowable percent of deviation : percent of deviation from perfect pattern Sym
Ни для кого не секрет, что для того чтобы, заработать на финансовых рынках необходимо движение цены инструмента. И чем движение сильнее тем больше возможностей предоставляется для торговли трейдеру. Для поиска сильных движений цены и был разработан PulseScanner. Панель предназначена для быстрого визуального нахождения и отображения сильных движений цены по всем периодам и на любых выбранных валютных парах одновременно. Индикатор имеет несколько режимов поиска и визуального отображения сигналов.
Gladiator Signal indicator for binary options can be used in the forex market...
a signal appears when you open a new candle, we need to wait for it to close.. and at the time of opening a new one if the signal is to open a deal for one candle of the current timeframe works great on all time frames... in the settings you can enable turn off the alert and sound vision...

RSI Candle Signal Indicator will change bars’ color when set overbought or oversold levels reach.
How to Use RSI Candle Signal Uptrend/Downtrends - RSI may be used to detect trending markets. For example, the RSI may stay above the mid line 50 in an uptrend. Top and Buttoms - RSI may help in identifying the tops around the overbought readings (usually above 70), and the bottoms around the oversold area (usually below 30). Divergence - divergence occurs when RSI directional movement is not c
FREE

DO NOT STOP OCCUPY THE POWER OF THE UNION OF VARIOUS TIME FRAMES. From now on you can see the RSI that you use for your trading analysis in a single window without having to be opening others to form very graphic and easy. Color settings Possibility of deactivating the timeframes you want. Up or down arrows in relation to the previous sail. We also have Multiframe MACD and Momentum version available. Visit My signals https://www.mql5.com/es/signals/620506

The Awesome Oscillator (AO) Signal Candle Indicator is an indicator used to measure market momentum. Awesome Oscillator (AO) Signal Candle Indicator will change bar's color when set overbought or oversold levels reach. Colored Candles, based on Awesome Oscillator (AO) Signal.
-If the indicator is above zero, the market is bullish. -If the indicator is below zero, the market is bearish. -If the market is bullish, you can take a stand with green candle signals. -If the market is bearish,
FREE
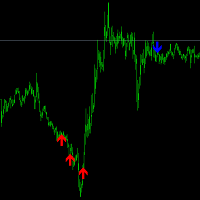
This index doesn't disappear, it doesn't get rewritten, the way it's calculated is to look for a trend shift, when the arrow comes up, there's a high probability that the trend will change. It is recommended to use a larger cycle, but you can also use the 5 minute cycle, the larger the cycle, the higher the winning rate. Indicators in the form of arrows, blue down arrow short, red up arrow do, in a large trend may appear in a continuous arrow, every arrow appears, is an opportunity to add positi

KT MACD Divergence shows the regular and hidden divergences build between the price and oscillator. If your trading strategy anticipates the trend reversal, you can include the MACD regular divergence to speculate the potential turning points. And if your trading strategy based on the trend continuation, MACD hidden divergence would be a good fit.
Limitations of KT MACD Divergence
Using the macd divergence as a standalone entry signal can be a risky affair. Every divergence can't be interpr

All time zones. But I use it daily and 4 hours continuously. When trading in small time zones it is necessary to check the top time zones and especially 4 hours and logs. Red Arrow - SELL Green Arrow - BUY When the Green Arrow is lit while the Bar is Blue (Check the overall trend rise) - Buy When the Red Arrow is lit while the Bar is Red (Check general trend downtrend) - Sales NO RE-PAINTING GOOD TRADE

Dashboard uses Ichimoku Strategy to find best trades. Get extra Indicators/Template: And read more about detailed Product Description and usage here: https://www.mql5.com/en/blogs/post/747457
Please note: I won’t be able to add new settings. It already has 72 settings Some people are using it with their EAs. And iCustom function can only take Max 64 settings. So, I cannot let it grow any further.
I’ll definitely be maintaining the code and solving issues. Don’t worry Please check all

"TPA Sessions" indicator is a very important tool to complement "TPA True Price Action" indicator . Did you ever wonder, why many times the price on your chart suddently turns on a position you can`t explain? A position, where apparently no support or resistance level, or a pivot point, or a fibonacci level is to identify? Attention!!! The first run of the TPA Session indicator must be in the open market for the lines to be drawn correctly.
Please visit our blog to study actual trades with
Mars 10 is a Oscillators indicator is a powerful indicator of CHANGE DIRECCTION for any par and any timeframe. It doesn't requires any additional indicators for the trading setup.The indicator gives clear signals about opening and closing trades.This Indicator is a unique, high quality and affordable trading tool. Can be used in combination with other indicators
Perfect For New Traders And Expert Traders Low risk entries. Never repaints signal. Never backpaints signal. Never recalculat

The different server times for each broker can be a heavy load when trading in short period.
This indicator displays the minimum trade information required to win at a glance.
The sub window displays the local time, and the main chart displays not only the local time,
-Symbol
-Period
-BarEndTime
-Spred
-TokyoTime
-LondonTime
-NewYorkTime
-ServerTime
and so on...
The information display on the main chart can be selected from four places: upper right, lower ri
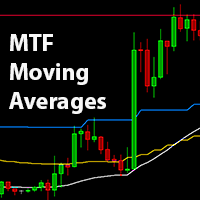
MTF Moving Averages is an useful indicator that brings you data from fully customizable higher timeframe Moving Averages on your charts, you can add multiple Moving Averages to use even more data of current market conditions. Check the indicator in action [Images below]
What MTF Moving Averages does apart from showing higher timeframe MA's?
Time saver , having all your higher timeframe MA's in just one chart, time is key, avoid switching between timeframes. Enter Trends precisely, easy to fol

HEDGING MASTER line indicator It compares the power/strength lines of two user input symbols and create a SMOOTHED line that indicates the degree of deviation of the 2 symbols Strategy#1- FOLLOW THE INDICATOR THICK LINE when CROSSING O LEVEL DOWN --- TRADE ON INDICATOR THICK LINE (TREND FRIENDLY) !! Strategy#2- TRADE INDICATOR PEAKS (Follow indicator Reversal PEAKS Levels)!! you input - the index of calculation ( 10/20/30....) - the indicator Drawing start point (indicator hi

The FX Secretary indicator is a mini assistant for MT-4. His functional duties include - notifying the trader about closing deals with profit or at a loss. In the settings there is only one parameter in which you can change the language of the voice message. So far, the indicator speaks only two languages. In the future, it is possible to expand the functionality with an increase in languages and a set of words. Use for health!
FREE
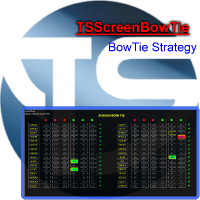
Expert for trading with the BowTie strategy. Intelligent algorithm for scalper and intraday traders. Multi time frame and multi currency panel. The benefits you get: Easy-to-use panel that alerts you to crossings of moving averages, like strategy, on each currency. Possibility to choose your favorite crosses. Possibility to choose to activate only the preferred time frames. Never redesigns, does not retreat, never recalculates. Works on forex and CFD, timeframe from M5 to D1. Integrated pop-up

KT Asian Breakout indicator scans and analyzes a critical part of the Asian session to generate bi-directional buy and sell signals with the direction of a price breakout. A buy signal occurs when the price breaks above the session high, and a sell signal occurs when the price breaks below the session low. MT5 Version is available here https://www.mql5.com/en/market/product/41704
Things to remember
If the session box is vertically too wide, a new trade should be avoided as most of the price

The current Rise and Fall is judged from the Commodity Channel Index (CCI) of the three cycles and displayed in a panel by color coding.
The second and third of the three cycles are changed according to the correction factor multiplied by the first cycle (minimum cycle).
In addition, each CCI is displayed with ATR (Average True Range) corrected for variation.
When two of the three CCI are complete, Trend_1 is displayed. When all three are complete, Trend_2 is displayed.
// ---
Sq
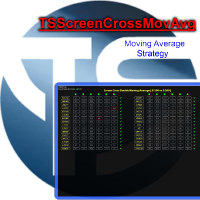
indicator for trading with the strategy with two moving averages. Intelligent algorithm for scalper and intraday traders. Multi time frame and multi currency panel. The benefits you get : Easy to use panel that alerts you to crossings of moving averages, as per strategy, on each currency. Possibility to choose your favorite crosses. Possibility to choose to activate only the preferred time frames. Never redesigns, does not retreat, never recalculates. Works on forex and CFD, timeframe from M

The Quadro Trend indicator works stably, correctly, and gives great flexibility when analyzing prices. There are many similar indicators, but Quadro Trend , unlike most of them , gives pretty good signals.
A great tool for working inside the day. On charts with a period of less than a day will help you see the daily candle in its usual form.
U-turn occurs when an arrow of the corresponding color appears. There is a parameter in the indicator to enable the supply of alerts when the color cha

Useful indicator that incorporates three moving averages, for your favorite trading strategy. Moving averages are fully configurable, Period, Method, Color, Etc Just place it on your favorite timeframe.
The benefits you get : Never redesigns, does not retreat, never recalculates. Works on forex and CFD, timeframe from M1 to Monthly. Easy to use. Convenience for your trading.
FREE
Indicator that displays the current price and the percentage of loss or gain, compared to the previous day.
The benefits you get : Possibility to choose your favorite crosses. Never redesigns, does not retreat, never recalculates. Works on forex and CFD, timeframe from M1 to monthly. Easy to use.
Parameters : FontSize = 20; font size FontType = "Tahoma"; character type Angle = Bottom_Right; angle view (top right .. top left sect ..) Show_Price = true; view the Bid Show_Var = true; see the d
FREE

This Momentum Seeker indicator is super simple! It is based in a few indicators to give you a quick entry to the Market. Once candle is closed and if parameters are all in place, an arrow is drawn in the chart, so there is no repainting! It works with any instrument! Risk management and trading skills are still needed! Inputs: Sensitivity: It is based in Periods, so the lower the number, more signals will come to screen but accuracy will decrease also. Recommended is 9 and above Audible_Alerts:

Welcome to my new indicator. It is a simple trend indicator, suitable for all instruments and timeframes. You should adjust it to your taste and you will know this product it's trustworthy. Trading skills and risk management, as usual are needed! There is not a perfect indicator in the market but you can find great helpers, and I think this is one of them. Inputs: SupRes_Interval Original setting is 5 and works very well with Indices. Lower numbers are more sensitive and suitable for scalpin

Level Scanner 指标是一个强大的工具,旨在自动识别图表上的 较高 和 较低 区域,以及所有 支撑和阻力位 。它结合了 赫尔移动平均线 的使用,以提供更清晰、更平滑的真实趋势表示。该指标以惊人的速度运行,使交易者能够快速识别感兴趣的关键领域并做出更明智的交易决策。 Level Scanner 的突出特点之一是它的多功能性。它可以应用于任何交易品种和时间框架,使其适用于范围广泛的交易策略。该指标有效地生成信号,使交易者能够迅速识别潜在的交易设置。此外,它还提供用户友好的参数,这些参数可以完全自定义以符合个人交易策略和偏好。 交易者可以通过自己的周期、CCI、RSI 和随机指标过滤信号,进一步完善他们的信号。此功能使交易者能够根据他们的特定要求和市场分析方法定制指标的输出。通过结合这些额外的指标,交易者可以增强他们的决策过程并更深入地了解市场状况。 此外,该指标包括趋势参数,使交易者能够设置移动平均线周期、方法和价格常量。此功能有助于趋势识别并使交易决策与当前市场方向保持一致。 为了让交易者了解情况并保持警惕,Level Scanner 为已识别的高低区域以及支撑位和阻力位提供通

works great with the trend, ideal for traders who trade using the scalping system. This is a pointer indicator. how to make deals. when the blue one appears, you need to open a trade to increase by 1 candle if the timeframe is m1 then for 1 minute, etc. if a red dot appears, you should make a deal to reduce it by 1 candle. Indicator signals appear along with a new candle; the working candle is the one on which the signal is located.
A Powerful Solution That Analyze The Renko And The Standard Charts And Filters Out The Noise Or The Narrow Range Moves And Gives Entry And Exit Signals. A statistics window is included to show the net points gained from these signals taking into considerations the spread of the pair and to evaluate accurately the overall performance.
Advantages It Provides A Clear Buy and Sell signals with take profit and stoploss levels. A Statistical analysis that offers an accurate image of net gained point

3 Level ZZ Semafor Scanner:
This is a Dashboard indicator which uses 3LZZ Indicator in the background to find semafors. It will give priority to the semafors3 because they specify a strong signal. So, even if there is a sem1 or 2 on current bar, and if Sem3 was within "Check Previous Bars for Sem 3". Then it will show Sem3 instead.
You can go through this video tutorial to see how it works: https://youtu.be/Z4v4h8U6RiM Get all extra Indicators/Template from here: https://abiroid.com/product/

The Th3Eng PipFinite indicator is based on a very excellent analysis of the right trend direction with perfect custom algorithms. It show the true direction and the best point to start trading. With StopLoss point and Three Take Profit points. Also it show the right pivot of the price and small points to order to replace the dynamic support and resistance channel, Which surrounds the price. And Finally it draws a very helpful Box on the left side on the chart includes (take profits and Stop loss

The Advanced Bands Squeeze indicator is a custom indicator based on the classic Bollinger Bands as created by John Bollinger. The Bollinger Band Squeeze occurs when volatility falls to low levels and the Bollinger Bands narrow. This low volatility level is called a “Squeeze”.
According to John Bollinger, periods of low volatility are often followed by periods of high volatility, where prices tend to move a lot in either direction. Therefore, a volatility contraction or narrowing of the bands

The TRs indicator works by using the waveform function. Thus, all entry points will be the optimal points at which motion changes. Entry points should be used as points of potential market reversal. The indicator settings by default are quite effective most of the time. You can customize them based on your needs. But do not forget that the approach should be comprehensive, the indicator signals require additional information to enter the market.
Multicurrency RSI indicator that works on any set of timeframes. The set of symbols is chosen from the Market Watch of the terminal. The table is customizable (color, width, font size, line height, column width) Alerts and sending push-notification on a smartphone.
Adjustable Parameters: Signal_Bar - choose a bar for analysis (current or closed) 6 switches for timeframe sets Indicator_Period - period of the RSI indicator Level_Signal - the level of the indicator value to generate signal (the o

YOU DON'T HAVE TO SHIFT ON ALL TIME FRAMES FOR EACH CURRENCY PAIR TO CONCLUDE ITS TREND AND ITS POWER YOU HAVE IT ALL IN ONE TABLE , 20 CURRENCY PAIR WITH 5 TIME FRAMES ALSO , COMPARE BETWEEN CURRENCIES STRENGTH AND ALERTS THE STRONGER /WEAKER PAIR BASED ON 5 TIMEFRAMES CALCULATIONS The Power meter currencies table is a very helpful tool to indicate the TREND strength of up to 20 currencies pairs using 5 time frames M5 M30 H1 H4 and D1 ( latest version You SELECT you own 5 timeframes from M1 t

The easiest indicator to know to which address the price is MOVED: taking into account other indicators to measure the exact price direction more accurately and with less noise. it is useful to know when to perform a BUY operation one from SELL

SSA stands for ' Singular Spectrum Analysis '. It combines elements of classical time series decomposition, statistics, multivariate geometry, dynamical systems and signal processing. SSA decomposes time series into a sum of components (ETs), with each component representing a lower smoothing, using several SVD ( Singular Value Decompositions ).
It is a powerful filtering process used in many fields of research (climatology, biomedical, aerospace, etc), where high quality forecasting and smoo
Rectangle Control простой индикатор который отображает на графике панель для рисования прямоугольников с различными настройками, будет удобен тем кто рисует на графике зоны поддержки, сопротивления. Прямоугольник можно нарисовать с заливкой или без, различной толщины и цвета. А также выбрать таймфрейм на котором нарисованный прямоугольник будет отображаться. При нажатой кнопке алерт будет срабатывать оповещение (если прямоугольник находиться ниже цены на верхнем его краю, если прямоугольник нах
FREE
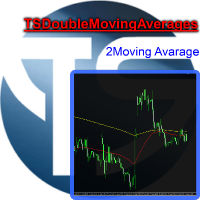
Useful indicator that incorporates two moving averages, for your favorite trading strategy. Moving averages are fully configurable, Period, Method, Color, Etc Just place it on your favorite timeframe.
The benefits you get : Never redesigns, does not retreat, never recalculates. Works on forex and CFD, timeframe from M1 to Monthly. Easy to use. Convenience for your trading.
FREE

A simple Approach to Elliot waves patterns Signal generated on trend continuation when breaking the "5" level or on corrective direction after 1-5 waves detected 1-5 labeled points arrows used for signal UP/DOWN direction Chaotic patterns in Blue are drawn all times until a 1-5 Elliot wave pattern detected 1-5 Red pattern in Bull Market : UP arrow in BULL trend continuation OR DOWN arrow as a reversal DOWN direction as pattern correction 1-5 Green pattern in Bear Market :DOWN arrow in BEAR tr
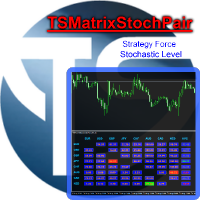
TSMatrixStochasticPair Indicator for currency strength trading, through the Stochastic indicator. Intelligent algorithm for scalper and intraday traders. The benefits you get: Never redesigns, does not retreat, never recalculates. Works on forex, timeframe from M1 to D1. Integrated pop-up, push notification and sound alerts. Easy to use. Parameters: KPeriod: k_ stochastic parameter. DPeriod: D_ stochastic parameter. Slowing: stochastic parameter. MA_Method:

SSA stands for 'Singular Spectrum Analysis'. It combines elements of classical time series decomposition, statistics, multivariate geometry, dynamical systems and signal processing. SSA decomposes time series into a sum of components (ETs), with each component representing a lower smoothing, using several SVD (Singular Value Decompositions).
It is a powerful filtering process used in many fields of research (climatology, biomedical, aerospace, etc), where high quality forecasting and smoothin

+Pips is a simple indicator which was design with FIVE trading confirmations in mind that works on all pairs and time frame. It's great for scalping, as it is a powerful indicator on its own. This indicator can be used by any type of trader(new or experience). The choice of sending notification to your mobile device and sounding alerts is up to the user as this is an optional setting. This is all you need no more cluster to your charts. If high probability and low risk trades, that alerts and se
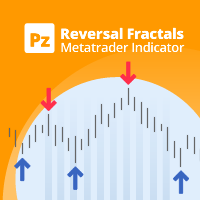
这是我著名的指标反转分形的最新版本,该指标在近十年前首次发布。它检查分形的价格结构以确定市场中可能的反转点,为已经拥有基本或技术估值模型的头寸交易者提供时机。 [ 安装指南 | 更新指南 | 故障排除 | 常见问题 | 所有产品 ] 反转分形可以开始长期趋势 指标不重绘
它实现了各种警报 可定制的颜色和尺寸 该指标是一个反应或滞后信号,因为分形是奇数条柱的形成,中间的柱是最高或最低的,并且当分形中的所有柱关闭时,指标绘制。但是,具有预先存在的方向偏差的交易者会发现该指标非常有用,可以提早进入点。 该指标不是简化的信号指标,也不是完整的交易系统。请不要这样评估或审查它。
输入参数 分形中的条:每个分形中的条数。必须是奇数,例如 3, 5, 7, 9, 11, 13, ...
最大历史柱线:指标加载时要评估的过去柱线的数量。
颜色:自定义箭头和线条的颜色和大小。 警报:启用或禁用各种警报。
支持 我很乐意提供免费产品,但由于我的时间有限,它们没有任何形式的支持。我很抱歉。
作者 Arturo López Pérez,私人投资者和投机者、软件工程师和 Point Zer
FREE

该指标建立当前报价,可以与历史报价进行比较,并在此基础上进行价格走势预测。指示器有一个文本字段,用于快速导航到所需日期。
选项:
符号 - 选择指标将显示的符号;
SymbolPeriod - 选择指标从中获取数据的时段;
IndicatorColor - 指示器颜色;
HorisontalShift - 由指标绘制的报价移动指定的柱数;
Inverse - true 反转引号,false - 原始视图;
ChartVerticalShiftStep - 图表垂直移动(键盘上的向上/向下箭头);
接下来是文本字段的设置,您可以在其中输入日期,您可以通过按“回车”立即跳转到该日期。 接下来是文本字段的设置,您可以在其中输入日期,您可以通过按“回车”立即跳转到该日期。
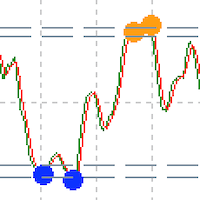
Custom Relative Strength Indicator with multiple timeframe selection About RSI The relative strength index is a technical indicator used in the analysis of financial markets. It is intended to chart the current and historical strength or weakness of a stock or market based on the closing prices of a recent trading period. Features
Indicator gives alert when reached oversold or overbought levels Gives dot indication while reaching levels. Can set indicator bar alert intervals for alerts Can choo
FREE

NEW check the FULL Version Including the private ICT tools limited so far until the release of the full 2016 Mentorship Core Content to the public. Indicator type: Money Management Calculator; Forex Position Size Calculator; Fixed or ATR value for Stop Loss and Take Profit levels; Average Position Size Indicator (True Average Price); Acc ount Information; Stop-out Level, Margin and Risk Exposure Warning, Forex Sessions; Institutional Levels Grid; Major Highs and Lows, Detailed Account Report an

Mars 9 is a TREND indicator is a powerful indicator of TREND DIRECCTION for any par and any timeframe. It doesn't requires any additional indicators for the trading setup.The indicator gives clear signals about opening and closing trades.This Indicator is a unique, high quality and affordable trading tool. Can be used in combination with other indicators
Perfect For New Traders And Expert Traders Low risk entries. Never repaints signal. Never backpaints signal. Never recalculates signal.

The Penta-O is a 6-point retracement harmonacci pattern which usually precedes big market movements. Penta-O patterns can expand and repaint quite a bit. To make things easier this indicator implements a twist: it waits for a donchian breakout in the right direction before signaling the trade. The end result is an otherwise repainting indicator with a very reliable trading signal. The donchian breakout period is entered as an input. [ Installation Guide | Update Guide | Troubleshooting | FAQ | A
FREE

The indicator calculates the current spread for each tick using the formula Spread=(ASK-BID)/Point. Schedule of changes in the boundaries spread over the timeframe displayed in a separate window from the date of accession of the indicator. Two lines corresponding to the minimum and maximum spread values are displayed. The indicator window is self-adjusted according to the minimum and maximum values from the moment of launch. The minimum and maximum values for the entire period of the indicator o
FREE
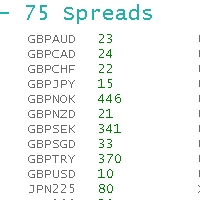
ObiForex 75 Spreads Discover a powerful indicator showcasing instant spreads for 75 currency pairs. Unlock valuable insights for informed trading decisions and optimize your strategies. The indicator features 3 columns, providing a comprehensive view of the spreads. Spread reading can be effectively used with macroeconomic news. Share your strategies! For optimal performance, install the indicator on the USDJPY currency pair. Experience the capabilities of ObiForex 75 Spreads and elevate your tr
FREE

Insider Scalper Binary This tool is designed to trade binary options.
for short temporary spends. to make a deal is worth the moment of receiving the signal and only 1 candle if it is m1 then only for a minute and so in accordance with the timeframe.
for better results, you need to select well-volatile charts....
recommended currency pairs eur | usd, usd | jpy ....
the indicator is already configured, you just have to add it to the chart and trade .... The indicator signals the next can
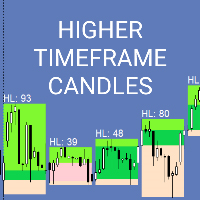
The indicator draws candles of the selected high timeframe on the current chart. It supports both standard timeframes and custom ones set in minutes. Built-in support for displaying the size of the candle, its body, as well as the upper and lower shadows. Alerts when High / Low breaks the previous candlestick of the selected timeframe. Customized types of elements for the simultaneous operation of several indicators on the same chart.

Price Predictor is an indicator that shows precise price reversals taking into account a higher time frame and a lower time frame candle patterns calculations it is great for scalping and swing trading . Buy and sell arrows are shown on the chart as for entry signals. BIG Arrows indicates the trend - SMALL Arrows signal a trade (BUY/SELL) - A Green BIG UP Arrow with a support green line indicates a Bull Market : wait for buy signal - A Green SMALL Up Arrow after a BIG green arrow is
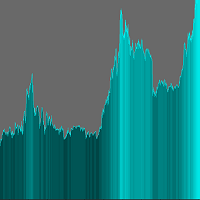
The indicator adds an overlay to the graph to create a histogram.
There are no parameters to set.
On the chart you can choose the color in the upper right corner by clicking on the appropriate brick.
The histogram is shaded depending on the price value.
Remember to set a line chart (shown in the screenshot). ........................... I invite you to purchase.
FREE

Auto redrawn Pivot support resistance horizontal lines with signal of Buy/Sell possibilities with SL level and with trend support resistance lines too used for all symbols and time frames you can adjust inputs parameters (only 2) and test it on various symbols and time frames input number of bars for calculation and moving average for signal accuracy example : use it on M30 time frame with input 200 for bars count and 100 for MA
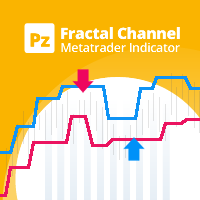
这是交易可变分形周期突破的非常简单但有效的指标。分形是奇数数量条的价格形态,中间条是形态的最高或最低价格点。这些价格充当短期支撑和阻力位,该指标用于绘制价格通道并显示突破。 [ 安装指南 | 更新指南 | 故障排除 | 常见问题 | 所有产品 ] 容易交易 分形突破可以开始长期趋势 分形通道是一种很好的尾随止损方法 它是不可重涂和不可重涂的 它实现了各种警报 可自定义的颜色和尺寸 较高的期限会导致更可靠的突破,但出现的频率会降低。该指标应通过更高时限的分析来确认。通常,您需要为较低的时间范围增加分形周期,为较高的时间范围减少分形周期。
输入参数 周期:用于计算分形的条形数量。必须为奇数 突破:启用或禁用突破 颜色:自定义箭头的颜色和大小 警报:启用或禁用各种警报
作者 ArturoLópezPérez,私人投资者和投机者,软件工程师和Point Zero Trading Solutions的创始人。

该系统是一个简单的系统,旨在为初学者交易者生成一致的条目。当找到相同方向的两个连续条并且确认ADR和ADX指示器时,放置一个输入箭头。我们的想法是,人们不是在寻找系统的圣杯,而是使用一个系统来进入市场。人们应该关注金钱和风险管理。 建议使用枢轴点作为目标线来确定可能的条目是否有空间增长到利润,然后如果奖励/风险比率最小为2比1则进入市场。因此,从您的进入位置到下一个枢轴线的空间必须至少是从您的进入到止损线的空间的两倍。 风险是货币的止损金额,应该是您账户价值的0.5-1.0%。开始使用的风险更低,可能为0.2%。这似乎很少,因为利润也很少,但你学会连续几次亏损是非常重要的。对于所有良好的交易系统,你会发现一系列的损失和赢家,因为你无法承受一组损失而退出使用系统将是一种耻辱。 将您的位置尺寸缩小到足够小,以便止损足够大,不会太快取出。 Gāi xìtǒng shì yīgè jiǎndān de xìtǒng, zhǐ zài wèi chū xuézhě jiāoyì zhě shēngchéng yīzhì de tiáomù. Dāng zhǎodào xiāngtóng fā

Great news from today you can test indicator within1 week absolutley for free! FREE version of indicator https://www.mql5.com/en/market/product/41465 We present you an indicator - Insider Scalper by LATAlab developed by the LATAlab team, that allows you to bring scalping trading to a whole new level of quality! With our strategy you can: Insider Scalper by LATAlab displays a hidden tick chart that is not available in the basic tools of the terminal. Automatically detects and draws strong level
Trend directional oscillator with additional flat filtering It helps to quickly navigate when changing the direction of price movement and is painted in the appropriate color You can conduct trend and counter trend trade It works on all timeframes, on any currency pairs, metals and cryptocurrency Can be used when working with binary options Distinctive features Not redrawn; Flat filtering - when the histogram is in the yellow zone; Simple and clear settings; It works on all timeframes and on all
FREE
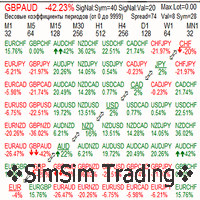
SimSim Tournament Currency Strength Table This is a multi-currency indicator; it shows the relative strength of the currency and 28 major currency pairs. There are many similar indicators on the market, but let there be one more. In this indicator, unlike others, you can specify weighting factors for each timeframe.
Weighting factors. Why are they? Each trader prefers to work with a specific time frame, which is the main one for him, and the signals from him are most important. Examples of
pappye indicator uses bolinger band to trigger it's signal ,it contain's pappye animation for alerting trading signals this alert is not continuous for the same arrow it will played 2 times only it could be used for any pair any time frame personally i prefer to inter a trade when there is to consecutive arrow in horizontal level after a breakout drift in a price but you could choose your way after trying the demo copy on your terminal
parameters fast : fast bolinger period slow : slow boli
FREE

Ultra Arrows Scalper Pro Ultra Arrows Scalper pro indicator for efficient binary options trading ----------- complete lack of redrawing -----------... ....... ... An arrow is formed on the current candle and indicates the direction of the next candle and the possible direction of the trend in the future. Enter the deal is on the next candle. its advantages: signal accuracy. complete lack of redrawing. You can choose absolutely any tool. the indicator will provide many profitable and accurate

Kelter Channel is a technical indicator designed to find overbought and oversold price areas, using a exponential moving average and ATR. And it implements a particularly useful twist: you can plot the bands of a higher timeframe in the current chart. [ Installation Guide | Update Guide | Troubleshooting | FAQ | All Products ] Find overbought and oversold situations Read data from higher timeframes easily The indicator displays data at bar opening The indicator is non-repainting Trading implica
FREE

An Indicator that calculates the Pivot Point line, along with the 2 levels of support and resistance lines, known as S1, S2, R1, R2 respectively.
The formulas for calculation are as follows:
Pivot point (PP) = (High + Low + Close) / 3
First level support and resistance: First resistance (R1) = (2 x PP) – Low First support (S1) = (2 x PP) – High
Second level of support and resistance: Second resistance (R2) = PP + (High – Low) Second support (S2) = PP – (High – Low)
The trader can adj
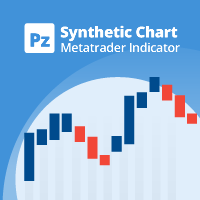
This indicator creates synthetic charts. It creates a candlestick chart plotting the price of one instrument measured against another, helping you to find hidden opportunities in the market crossing relationships between different instruments. [ Installation Guide | Update Guide | Troubleshooting | FAQ | All Products ] Find hidden trading opportunities Get a broader sense of the price of commodities Commodities range against each other and are easier to trade Correlated Indices can be traded ag
FREE

This indicator calculate the minimum,maximum,average and relative (to points of the bar) spread in the chart applied period. The indicator must be applied to one or more different period on a Pair and analyze the spread for all the Pairs available by the Broker. The csv output for one minute chart is something like this https://gofile.io/?c=K5JtN9 This video will show how to apply the indicator https://youtu.be/2cOE-pFrud8 Free version works only for GBPNZD
FREE
MetaTrader市场是一个简单方便的网站,在这里开发者可以出售自己的交易应用程序。
我们将帮助您发布您的产品,并向您解释如何为市场准备您的产品描述。市场上所有的应用程序都是加密保护并且只能在买家的电脑上运行。非法拷贝是不可能的。
您错过了交易机会:
- 免费交易应用程序
- 8,000+信号可供复制
- 探索金融市场的经济新闻
注册
登录