 MetaTrader 5
 专家
专家
 指标
指标
 程序库
程序库
 实用工具
实用工具
 窗口小部件
窗口小部件
 规则
规则
适用于MetaTrader 4的新技术指标 - 161
 下面列出的技术指标信号对MetaTrader 4平台的开仓交易和平仓交易起着至关重要的作用。
指标的本质就是一种交易品种的数学转换,旨在预测价格变化。
下面列出的技术指标信号对MetaTrader 4平台的开仓交易和平仓交易起着至关重要的作用。
指标的本质就是一种交易品种的数学转换,旨在预测价格变化。 
The MultiCurrency RSI indicator calculates the values of the standard RSI indicator for each of 8 major currencies: EUR, GBP, AUD, NZD, USD, CAD, CHF, JPY.
Advantage of the indicator: The calculation is performed based on 8 virtual currency charts: EUR, GBP, AUD, NZD, USD, CAD, CHF, JPY; Shows the strength of currencies, not depending on the currency pair; Allows any time to determine the strongest and the weakest currency, also sorts currencies by strength; At any time it shows the current str
Индикатор таблица, постоянно меняющихся значений, пройденных ценой пунктов от начало дня (D1) , от начала недели (W1) и от начала текущего месяца (MN) . Индикатор также показывает средний дневной АТР за выбранный период. Параметры всей таблицы регулируются. Перемещение по осям монитора, для расположения в удобном месте, цвета текстов и заполнений ячеек, размеры столбцов, строк, цифр и текстов. Пользоваться можно на белом и тёмном фоне. По индикатору трейдер может легко определить настроение на р

Flow Of Lines
The indicator calculates and shows on a symbol chart trend channels, as well as the price movement channels, each of which corresponds to its specific timeframe. This method provides easy analysis of long- and short-term trend movement dynamics. In addition to all of the above, the indicator displays breakouts and the presence of a strong trend in the digital format (on the right top of the table). The lines that serve as the channel borders, can be at the same time used as certai
Initial Balance Target Strategy is an indicator based on Fibonacci Levels. Its graphics flexibility allows you to adapt very well to your strategies or Trading System setting it with levels in input. The analysis of the time range allows replication of strategies as London Breakout and Kiss . The indicator is fully customizable, you can change colors, texts and percentages of Target. The simplicity and manageability of this indicator makes it an useful tool for all Intraday Trader .
Input Value

Break-even Price indicator Shows Break even price tag for multiple positions on chart Multiple Levels for custom Profit/Loss Percentages of Balance, and Amounts in Deposit Currency Works for a specific Magic Number trades or all trades on chart Calculation includes Spread, Commissions and Swaps
How to use The basic use of the indicator is to calculate the "break-even price level" for multiple mixed positions for the same symbol and show it on the chart. In addition to this, the indicator will s
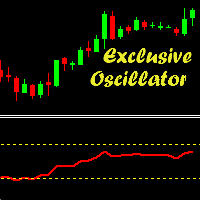
Exclusive Oscillator is a new trend indicator for MetaTrader 4, which is able to assess the real overbought/oversold state of the market. It does not use any other indicators and works only with the market actions. The indicator is easy to use, even a novice trader can use it for trading. Exclusive Oscillator for the MetaTrader 5 terminal : https://www.mql5.com/en/market/product/22300
Advantages Generates minimum false signals. Suitable for beginners and experienced traders. Simple and easy

This indicator is designed for trend trading and it helps in determining the best entry points. To identify the points, it is necessary to follow the signal line. Once the line crosses the zero level upwards - buy, and when it crosses downwards - sell. In addition to the signal line, the indicator also displays the so-called market "mood" in real time in the form of a histogram. The indicator works on all timeframes and with all instruments. The indicator operation required the Moving Average in

该指标根据 ZigZag 指标、交易时段、分形或蜡烛(包括非标准时间范围:年、6 个月、4 个月、3 个月、2 个月)自动绘制斐波那契水平(自动斐波那契回撤)。 您可以选择任何更高的时间范围进行斐波纳奇计算。 每次当前柱关闭时都会重新绘制级别。 当超过指定级别时可以启用警报。
您还可以分析历史水平。 为此,需要在“过去的斐波纳奇数”参数中指定斐波纳奇位的数量.
参数
Calculate Fibo according to — 斐波纳奇计算模式: Candles (High-Low) — 根据最高价-最低价构建斐波那契; Candles (Close-Close) — 基于收盘价-收盘价构建斐波那契; ZigZags — 通过 ZigZag 点构建斐波那契; Sessions — 通过交易会话构建斐波那契; Fractals — 通过分形点构建斐波那契。 Minimum fibo size, points (0-any) — 最小斐波那契尺寸,以点为单位。 如果斐波那契尺寸小于此大小,则忽略它。 TF for Candle — 用于构建斐波那契水平的蜡烛时间范围; Numbe
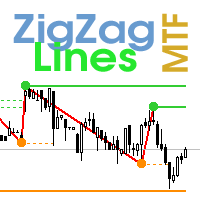
多时间框架锯齿形调整浪指标。 它显示支撑/阻力水平线及其突破,并绘制当前的市场目标。 它还可以显示分形指标的线条和其他时期(最多季度)的蜡烛。指标——连接关键低点和高点以显示趋势线。
该指标重新绘制最后一个(当前)点,并且在某些情况下可以更改最后 2-3 个点。
所有线条均绘制为对象(不是指标缓冲区,但有可能接收 EA 的数据). 在 Expert Advisor 中使用时,您可以使用 iCustom 读取 ZigZag 点.
设置 Mode — 根据计算支撑位和阻力位: — Zig Zag — ZigZag 指标; — ZigZag Close — 之字折线收盘指标; — Fractals — 分形指标; — High-Low of the period — 通过高低水平构建指标。 时间范围在Period参数中指定; — Candles only — 仅绘制蜡烛; Depth — 如果最后一根蜡烛的偏差小于(或大于)前一根,则 Zigzag 将不会绘制第二个最大值(或最小值)的烛台的最小数量; Deviation — 锯齿形形成局部顶部/底部的两个相邻烛台的最高点/
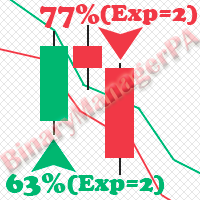
BinaryManagerPA is an indicator for binary options based on the analysis of the Price Action and indicator setups using complex filters. The main advantage of the indicator is that it estimates the current state of the market in advance with using several expiration times. As a result, the indicator generates the statistics on the percentage of successful trades (WinRate) for the selected instrument and timeframe. In addition, the indicator displays the win rate and the recommended expiration fo

This indicator is designed to find the difference in price and indicator. This indicator uses various indicators. These indicators RSI, Macd, Momentum, RVI, Stochastic, Standard deviation, Derivative, Williams, and custom. You can use these indicators by selecting the indicator type section. This indicator shows the price and indicator difference on the screen. Indicators are individually selectable. You can use the custom type to enter the desired parameters. The user is alerted with the alert

Info Plus is a simple tool that displays the current status on an asset class. The information displayed by Info Plus includes: Bid Price The high and low of the day. Candle time left. Current spread. Selected timeframe. Asset class selected (Symbol). Pip value. Open Positions. Total pips booked. Pips per trade. Session times (they may not be accurate and are subject to changes). Date and time.
How it Works When loaded onto any chart, Info Plus automatically gets the following parameters: Bid P
FREE

The MACD CloseBars indicator is a trading system based on the MACD indicator popular among many traders, which is built on the principle of bars closing above the moving averages selected in the indicator settings. The signal for entering/exiting the market is the frame of the bars colors according to the trend: in case the bars in the main window of the chart are closed above/below the Fast Moving Average, Slow Moving Average individually or both together.
Indicator Parameters Fast Moving Aver

Face smiling trend indicator is an oscillator designed to search for turning points. Face smiling trend indicator represents an oscillator that uses in his work an average price for a certain period and is designed to determine the price reversal points. Face smiling trend indicator oscillates between 0.00 (oversold) and 105 (overbought) values depending upon market conditions. Red bars suggest bearish pressure and blue bars bullish pressure. Typically, a reversal of the trend occurs when achiev

Undefeated trend indicator, an indicator that uses MacD and Bollinger bands. It is a coded indicator to find trends. It finds these trends by its own algorithm. This indicator requires visual monitoring. It does not give any warning because it needs visual follow-up. The main trendline should turn down to find the down trend. The main trend line should go under the white line and then go under the yellow line. The main trendline should turn upward to find the upward trend. The main trend line sh

Super Custom Indicator allows you to design trading signals on your own without coding knowledge. You just need to input the trading rules and it will scan multiple symbols at multiple time frames to find the signals for you in real-time as well as in history chart. Real-time signals will be sent to your mobile and email also. The indicator can calculate and analyze every technical indicators, even custom indicators, with complex operations to give the signal exactly. Normally, it is hard for yo

This indicator uses two moving averages, a slower and faster moving average. A crossover occurs when a faster moving average (i.e., a shorter period moving average) crosses a slower moving average (i.e. a longer period moving average). Signal show alert pop-up and push notification. Variable setup for each Moving Average, 3 types of signal arrow, pop-up alert and push notifications.
Settings Fast_MA_Setup Period - period of Faster Moving Average (value 0 - xxx). Mode - type of Moving Average (S
Candlestick Patterns All Pair is a simple and convenient indicator of candlestick pattens. It is able to identify 29 candlestick patterns. It displays the latest patterns for all pairs and timeframes.
The considerable advantages of the indicator It finds and marks 29 candlestick patterns; Displays a table of the last patterns for the 28 major pairs and each timeframe; It has settings for 5 extra pairs; Indicates the classic trade direction; Each candlestick patterns can be disabled in the setti

Full Stochastic - is Stochastic Oscillator which displays all three essential lines: %K Slow K %D Standard Stochastic Oscillators displays only Slow K and %D.
Why it is important to analyze all three lines in SO? Standard SO users must choose if they want to use fast or slow SO. In case of fast SO traders set the slowing parameter typically to 1 or 2, or if they want to use slow SO, they set the slowing parameter usually to 3 or more. With Full Stochastic you can have both!
Full Stochastic Par
FREE

Target Geometry is a next-generation indicator that uses the geometric nature of the markets to give high statistical probability levels ( Fibonacci ). This indicator creates a very important map that optimizes the entry points and it optimally defines your own money management. The indicator can be used both in static mode or in dynamic mode, you can use it on any financial instrument. The use in multi timeframe mode is a very good ally to have. The target levels are high statistical probabilit
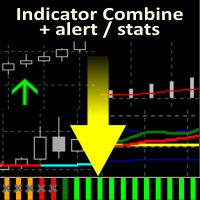
Allows multiple indicators to be combined into a single indicator, both visually and in terms of an alert. Indicators can include standard indicators, e.g. RSI, CCI, etc., and also Custom Indicators, even those purchased through Market, or where just have the ex4 file. An early alert is provided, say when 4 out 5 indicators have lined up, and a confirmed alert when all are in agreement. Also features a statistics panel reporting the success of the combined indicator by examining the current cha

Centaurus Trend Engine is an indicator that uses custom indicators to give the current momentum moves of the market with a multi-timeframe approach to trading Features Value Area -It is the (red/green) rectangular box on your chart based on the dynamic structure period set;Green to indicate you focus on LONG moves & Red for SHORT moves Analysis - Displays The Market Analysis Strength - Displays The Market Strength Trend - Displays The Market Trend Entry State - Displays the BEST entry time for t

The Zones indicator provides a visual display of the boundaries around a price action. There are two types of zones included in the indicator: High-Low price zones Time period zones (delineations) High-Low price zones display the boundaries of the High and Low price points. Typically, these zones are displayed for the High and Low price of the day. Time period zones display boundaries around time period intervals.
PARAMETERS Yancy indicator
IndicatorName – indicator name displayed in the chart

The ”Trend Guess” is a complex software that does not involve the MACD, RSI or moving averages. It adapts itself to current market conditions using complicated algorithms based on price action and out custom indicators. The indicator will gives you trading signals Buy or Sell stop loss levels indicated in the popup alert window and graphically. You have to do is to press buy or sell button whenever you get a signal
Important Rules Identify a current long term trend. Example – if you trade on a
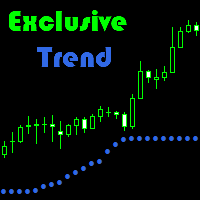
Exclusive Trend is a trend indicator that can be used for scalping, as well as intraday trading.
Advantage of indicator: Generates minimum false signals. Perfect for scalping. Simple and easy indicator configuration.
Recommendations on usage It is recommended to use the indicator during session movements to reduce the likelihood of falling into flat. Period M1 to D1. Trending currency pairs: GBPUSD, EURUSD, AUDUSD.
Signals for Position Opening: Open Buy when the indicator is blue. Open Sell w

This indicator indicates potential entry points. Rsi indicator and console wax combination. In addition to the signals in the graphic arrows, text comments are also used. Features
Works on any currency pairs. It works in all periods. Sensitivity setting. You can set the signal frequency. Use recommended standard settings. The greatest feature of this display is the possibility of manual martingale.
The signal intensity region tends to go in the direction of the signal. Works on all charts. An

Strong trend indicator is a special indicator designed to capture healthy signals. There are lines showing the signal of the indicator and the power of buying and selling. The signal line is yellow. The green lines are Buy lines. The ones that are brown are Sell lines. The green line must close above the yellow line to perform the operation. The brown line must close above the yellow line to sell. The important line is the first one that closes above the yellow line. If the first line is green,

Price Action Triggers indicator uses the purest form of data available in the market (price action) to determine the entry triggers. The signals are formed by observing the shape, positioning and relative size of the candles. The triggers will appear once either a single or a multi candle setup is detected. It is important to note that the triggers will not observe the broader direction of the market (market sentiment). Thus the indicator should not be used as a stand-alone trading system. The P

The Extreme point indicator helps in determining the probable price reversal points on the chart. The indicator facilitates the search for points to enter the market with greater accuracy. The indicator displays certain impulses, after which there is a high probability of the price continuing its movement in the same direction. The indicator can be used in conjunction with other indicators for a more accurate detection of the position entry points. The indicator can also be used independently. F

AIS Weighted_Moving_Average 指标计算加权移动平均线,并允许您确定趋势市场运动的开始。
权重系数的计算考虑了每个柱的具体特征。这使您可以过滤掉随机的市场走势。
确认趋势开始的主要信号是指标线方向的变化和穿过指标线的价格。
WH(蓝线)是高价的加权平均值。 WL(红线)是最低价的加权平均值。 WS(绿线)是所有价格点的加权平均值。
选项 LH - 计算值的柱数。 要快速选择 LH,您首先需要检查是较高时间范围的倍数的值。
例如,指标设置为 M15。
然后我们检查以下LH的值
周期 M30/M15 = 2 期间 H1/M15 = 4 期间 H4/M15 = 16 周期 D1/M15 = 96 周期 W1/M15 = 480 它们之间的值也可能是有趣的。

Color Trend FX 直接在图表上显示当前的趋势方向,并标出入场点、trailing 跟踪止损位以及可能的出场点。该指标专为想看到开仓点、获得平仓建议并查看历史表现的交易者设计。它可以作为独立工具使用,也可以作为您自己交易系统的一部分,或作为您 Expert Advisors 的基础。 指标以彩色圆点的形式显示信号,圆点跟随趋势,同时充当持仓的 trailing 跟踪止损位。当行情动能减弱、价格开始从极值回撤时,会出现一个提示出场 / 平仓的信号。 购买后请直接联系我,获取关于如何在交易中使用该指标,以及如何将其正确接入您自己的交易系统和 Expert Advisors 的更多信息。 主要功能 趋势圆点跟随价格,充当持仓的 trailing 跟踪止损位。 当行情动能减弱、价格从极值回撤时,出现出场信号。 不重绘信号:信号出现在已收盘的 K 线上,固定不动,之后不会重新计算。 趋势变化提醒:终端弹窗、声音提示、Push 和 Email(需要在终端中额外设置)。 可灵活调节信号过滤器灵敏度(Accuracy Delta)以及出场检测灵敏度,适配不同品种和周期。 可选的时间过滤器:设
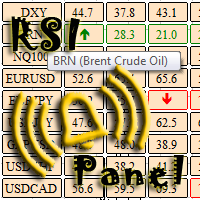
The RSI Panel MTF indicator has been created in order to have the ability to monitor the values of the standard RSI indicator from a multitude of timeframes and symbols on a single chart, as well as to receive timely notifications about the trading opportunities using an audio signal or a notification. The indicator can output both the indicator values, and only the indicator signals (confirmed and expected). A user-friendly feature for selecting the required symbol has been implemented - simply
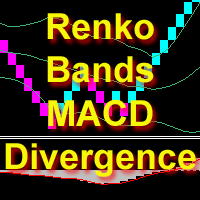
The indicator displays Renko bars, uses their data to calculate and display the Bollinger Bands, MACD indicators and provides buy/sell signals based on divergence/convergence of the price action and oscillator. Renko is a non-trivial price display method. Instead of displaying each bar within a time interval, only the bars where the price moved a certain number of points are shown. Renko bars do not depend on a time interval, therefore the indicator works on any timeframe without losing its effi
Three moving averages with three timeframes and High/Low levels on one chart, individual period parameter for each of them. The indicator helps to determine the values of moving averages on the current, the next smaller and the next higher timeframes. The filtered vales are displayed in the top right corner of the chart according to the logic of traffic lights. If a buy or sell sign is green, then a long or short position can be opened in the specified timeframe. If the sign is red, it is time t

The oscillator shows trend direction using its own algorithm, which is based on calculating price values by analyzing prices of separate currencies (original valuation of currencies). The histogram shows the average value of physical price change over the selected period. When the histogram has a positive value, the trend is rising, if negative - the trend id falling. The indicator uses standard RSI to determine the current market direction on a selected period as follows: the default value of
Stochastic is the indicator used by traders the most. This version allows to extract the maximum amount of information without hassle of constantly switching between the timeframes and, thereby, greatly simplifies working with it. This is a standard Stochastic oscillator provided with an info panel displaying the current relative position of %K and %D lines on all timeframes. The info panel is intuitive and easy to use. The oscillator is especially useful in scalping techniques when you need to

It would be good to always be aware of the "struggle" between buyers and sellers. Then it would be much easier to determine the best direction to go in order not to lose out. This indicator offers an original solution to this problem: the supply and demand values are compared with the High and Low prices for the selected period, thus trying to determine the market movement towards the stronger side without ignoring the strength of the opposite side. All this is displayed in a separate window usi
Break It Down is based on the Directional Movement Index and tells the trader when a market trend probably maxed out and ready to fall back. This pattern is more predictable when we apply this system only when the market is rallying but within a trading range. Because traders Sell off in fear the market often moves faster when declining! When this happens, good moves can occur. As traders are no longer interested in the trend, the volume will decline and the price will usually fall back on itsel

The Advanced EMA indicator implements an exponential moving average with many additional features. First, EMA is color-coded to indicate distance between the price and EMA. This Advanced EMA has many features and configurations that set it far above standard EMA indicators used most platforms. There are 3 types of indications in the indicator. The EMA is color-coded. Secondly, cross points of price and EMA are marked. Thirdly, BUY/SELL signals are shown. Color-coding the EMA allows you to easil
目前8折优惠!
对任何新手或专家交易者来说都是最好的解决方案!
这个指标是一个经济实惠的交易工具,因为我们结合了一些专有功能和新的公式。
高级累积货币量指标专门针对主要的28个外汇对,并在所有的时间框架内工作。它是一个新的公式,在一个图表上提取澳元、加元、瑞士法郎、欧元、英镑、日元、新西兰元和美元的所有货币量(C-Volume)。这在交易中是一个很大的优势。成交量交易者会知道如何使用它。如果你是新手,那么学习如何阅读极端值,并将其加入你的交易武库。
把C-Volume看作是一个盾牌,而不是一把枪。
在主图上会显示一个警告标志,警告你进入错误的交易。
这不是常用的简单的交易量。外汇市场被扫描,每个货币的交易量被提取并累积到C-Volume。我们现在可以看到哪些货币有最高或最低的交易量。我们可以在一张图表上看到所有28个外汇对的情况。如果欧元有一个强大的峰值,检查欧元对的可能交易。如果英镑有一个强大的峰值,那么检查英镑对。
建立在新的基础算法上,它使识别潜在的转折点更加容易。这是因为它以图形方式显示货币的C-Volume峰值。这些功能的设计是为了帮助并使你远离不良交易,指导

RiverScope automatically determines the nearest most important price levels and support and resistance zones in history, it also identifies a large number of price action patterns (30+). The support and resistance levels are determined based on an algorithm that calculates and filters the historical values of the price, its movement character, volumes, etc. It displays the current situation, therefore the nearest levels change in real time depending on the current price.
Advantages flexible cus

Nowadays a lot of traders need to open more positions for the same pair, because one position is not usually the best possible position, thus a lot of trades are accumulated, sometimes with different lot sizes, and not easy to calculate the breakeven price of all opened positions, for solving this issue the Breakeven Price indicator was created. Breakeven Price is an MT4 indicator which calculates real time the breakeven price of all Buy & Sell positions opened by trader or EAs. It shows real ti
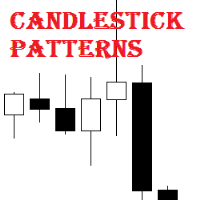
Candlestick Patterns MT4 is a simple and convenient indicator able to define 29 candle patterns.
Advantages Defines and highlights 29 candle patterns; Estimated trading direction is shown as an arrow; Each candlestick pattern can be disabled in the settings; The indicator can be used as an arrow indicator in EAs.
Parameters TextSize - chart text size; TextColor - chart text color; Alert - enable/disable alerts; ---------- Candlestick Patterns ------------- - settings separator; AdvanceBlock ;
Candlestick Patterns Analytics is a powerful tool for analyzing candlestick patterns. Do you trade based on candlestick patterns? Then Candlestick Patterns Analytics is designed for you.
The undeniable advantage of the indicator: Predicts trading result when trading candlestick patterns; Uses statistical data based on the history of the selected symbol and timeframe.
What the indicator does Finds and marks on the chart 29 candlestick patterns; Draws arrows to indicate the classical and statist
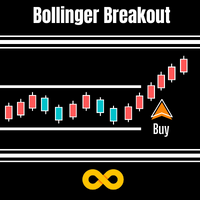
Bollinger Breakout Trader tells the trader when the market is about to breakout from a non-volatile period. Non volatility usually means its building up steam for more good moves in future. A signal is formed when this switch from non-volatile to volatile occurs. These periods are measured by both Bollinger Bands and Keltner Channels. Bollinger Bands measure the standard deviation of price from the Moving Average which results in an expanding and contracting channel. Keltner Channels are based o
Candlestick Patterns Custom is the lite version of the Candlestick Patterns Analytics indicator , intended for use as a conventional arrow indicator and in expert advisors.
The considerable advantages of the indicator It finds and marks 29 candlestick patterns (43 variants of signal patterns) on the chart; It allows the user to configure the signal of each pattern in accordance with the analysis results of the Candlestick Patterns Analytics indicator; The indicator can also be used as an arrow
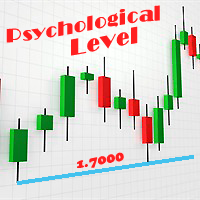
The Psychological levels indicator for the MetaTrader 4 terminal. Forex trading is very closely related to psychology. The psychological factors often cause spikes in demand or supply, which is bound to affect the movement of the currency quotes. In Forex, the price usually moves within a certain price corridor, the so-called psychological levels often serve as the boundaries of such corridors. Where are these levels located, and what causes their formation? The psychological Forex levels occur
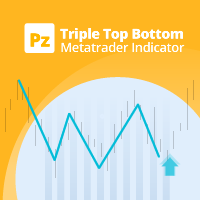
顶部和底部三重模式是一种用于预测趋势反转的图表模式。当价格在几乎相同的价格水平创建三个峰值时,就会出现这种模式。从第三个峰值附近的阻力反弹明确表明购买兴趣已耗尽,这表明将要发生逆转。 [ 安装指南 | 更新指南 | 故障排除 | 常见问题 | 所有产品 ] 清除交易信号 可自定义的颜色和尺寸 实施绩效统计 可定制的斐波那契回撤水平 显示适当的止损和获利水平
该指标可用于查找连续或反转形态 它实现了电子邮件/声音/视觉警报 这些图案可以扩展,并且指示器通过重新绘制跟随图案。但是,该指标采用了一种扭曲方式,以使其更容易交易:它在向交易发出信号之前等待Donchian突破,然后发出交易信号,使其信号非常可靠,并且几乎没有重涂。
输入参数
将指标加载到任何图表时,将显示一组选项作为输入参数。如果您认为它们太多,请不要感到失望,因为参数被分组为不言自明的块。这就是每个参数块的作用。 幅度-幅度表示替代价格点之间的最小柱线量。要找到大图案,请增加幅度参数。要查找较小的模式,请减小幅度参数。您可以在图表中多次加载具有不同幅度的指标。
闵。回撤-形态中所需的最小斐波那契回撤。
最大。回撤-形态

Candle Times 该指标仅适用于小于日线图周期的周期。显示每日蜡烛图和交易时段的界限。 指标设置说明: Count_Bars - 限制计算指标柱的数量 lineColor - 线条颜色 lineStyle - 线条样式 lineWidth - 线宽 蜡烛向上 - 看涨蜡烛标记的颜色 蜡烛_dn - 看跌蜡烛标记的颜色 蜡烛宽度 - 线宽 AsiaBegin - 亚洲时段开盘时间 AsiaEnd - 亚洲时段收盘时间 AsiaColor - 亚洲时段的颜色 EurBegin - 欧洲时段开盘时间 EurEnd - 欧洲时段收盘时间 EuroColor - 欧洲时段的颜色 USABegin - 美国时段开放时间 USAEnd - 美国时段结束时间 USAColor - 美国会话颜色 该指标仅适用于小于日线图周期的周期。显示每日蜡烛图和交易时段的界限。

Turns Area Alert 该指标通过警报信号指示潜在价格反转的区域。
基于移动平均线指标和 RSI 指标指标,显示了它们的区别。 指标设置说明: EMA_Period - 计算移动平均指标的平均周期 EMA_Method - 平均方法。可以是任何枚举值,SMA是简单平均,EMA是指数平均,SMMA是平滑平均,LWMA是线性加权平均。 EMA_Price - 使用的价格。可以是枚举值之一。 CLOSE - 收盘价。 OPEN - 开盘价。 HIGH - 期间的最高价格。 LOW - 期间的最低价格。 MEDIAN - 中位数价格,(高 + 低)/ 2。 TYPICAL - 典型价格,(最高价 + 最低价 + 收盘价)/ 3。加权 - 加权收盘价,(最高价 + 最低价 + 收盘价 + 收盘价)/ 4。 RSI_Period - 计算 RSI 指数的平均周期。 PSI_Price - 使用价格。类似于 EMA_Price。 level_up_alert - 信号的上层。 level_dn_alert - 信号的较低级别。 警报 - 显示包含用户数据的对话框。 Text_BUY -

Professional OB/OS Oscillator Is the digital momentum indicator , based on our ob/os formula and algorithm of digital output signal .
It shows you when price goes on OverBought/OverSold position and also OverBought/OverSold of Trend .
In the middle is an adjustable " Stop_level ". Above and below this area you should not trade .
Precise; above Stop_level - stop going long , below Stop_level - stop going short .
Min/Max indicator values are +-100%, but the scale is +-110% just for “easy look”.
Th

The indicator analyzes the volume scale and splits it into two components - seller volumes and buyer volumes, and also calculates the delta and cumulative delta. The indicator does not flicker or redraw, its calculation and plotting are performed fairly quickly, while using the data from the smaller (relative to the current) periods. The indicator operation modes can be switched using the Mode input variable: Buy - display only the buyer volumes. Sell - display only the seller volumes. BuySell -
FREE
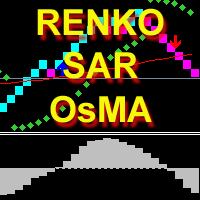
The indicator calculates and displays renko bars using Moving Average, Parabolic SAR and OsMA data as well as provides buy/sell signals. Renko is a non-trivial price display method. Instead of displaying each bar within a time interval, only the bars where the price moved a certain number of points are shown. Renko bars do not depend on a time interval, therefore the indicator works on any timeframe without losing its efficiency. The buy signal is generated when the OsMA indicator crosses the ze
The indicator displays the moment the price reaches an extreme level, including an invisible one (due to screen size limitations). Even small peaks and bottoms are considered extreme points. The level is shown as a trend line extending for a distance from the current candle (bar) to the left. The level has two values: distance (in bars) for the extreme point in a straight line to the left and distance (in bars) from the current candle (bar) to the extreme point (see the screenshots). The indicat
It is the same of Advanced Arrow indicator but shows the signal of 8 currencies pairs at the same time on 5 Timeframes without any TPs line or SL.
Features You will know when exactly you should enter the market. This indicator does not repaint it's signals.
Signal Types and Timeframes Used You can use this indicator on any timeframes but i recommend you to use it on H1, H4 frames. The indicator gives you four signals (Ready to Buy "RBuy", Ready to Sell "RSell", Buy, Sell). When RBuy appear you

The indicator plots a trend line and determines the levels for opening trades, in case the price goes "too far" away from the trend level. More detailed information is available in the screenshots.
Settings Away from the trend line - distance from the trend line to the trades level; Arrow Signal for deals - enable displaying an arrow when the price reaches the trades level; Size of Arrow - size of the arrow; Alert Signal for deals - enable generating alerts when the price reaches the trades lev

结合交易环境的突破信号 ACB Breakout Arrows 识别价格进入平稳阶段后出现的方向性突破,并用买入或卖出箭头标记该形态。箭头代表检测到的突破形态,并不保证每个信号都会发展成大幅行情。 买入箭头表示看涨突破形态,卖出箭头表示看跌突破形态。价格可能回测突破区域,也可能重新回到原有区间,因此入场前应检查周围的市场结构、趋势方向以及附近的支撑或阻力。 在图表上规划交易 指标可以围绕每个信号绘制实用的参考价位: Stop Loss: 根据所选 K 线数量计算的保护价位。 Quick Profit: 较近的目标,可用于提前离场、部分止盈或决定是否移动到保本位置。 Take Profit: 为选择继续持有突破行情的交易者提供更远的目标价位。 这些价位有助于建立一致的交易计划,但仓位大小和最终的交易管理仍由交易者负责。 确认突破 多周期面板可帮助您比较不同可用图表周期上的突破信号。如需更多背景信息,可以使用 ACB Trade Filter 检查市场情绪和趋势方向。绿色配合看涨趋势支持多头形态,红色配合看跌趋势支持空头形态,灰色配合横盘趋势则表示市场条件混合。 您还可以检查买入信号是否直

Future Price 未来价格 - 该指标根据报价历史中的匹配搜索显示未来价格变动的预期选项。该指标以两种模式运行,第一种 - 枚举和显示指定数量的选项,第二种 - 指标显示一组选项。
设置说明 静态变量 = 0; - 设置要显示的所需选项,如果= 0,则选项的迭代有效 TOTAL_VARIANTS = 20; - 设置一组选项的数量,建议不要超过30 Time_Seconds_Show = 3; - 给定集合中一个选项的最小显示时间,最大时间受下一个报价到达时间的限制 Future_Bars = 50; - 未来显示的柱数,建议不超过60 History_Bars = 636; - 历史中分析柱的数量 未来价格 - 该指标根据报价历史中的匹配搜索显示未来价格变动的预期选项。该指标以两种模式运行,第一种 - 枚举和显示指定数量的选项,第二种 - 指标显示一组选项。

江恩箱(或江恩方)是一种基于 W.D. Gann 的“市场预测的数学公式”文章的市场分析方法。 该指标可以绘制三种正方形模型:90、52(104)、144。有六种网格变体和两种弧形变体。 您可以在一张图表上同时绘制多个方块.
参数 Square — 江恩方格模型的选择: 90 — 90 的平方(或 9 的平方); 52 (104) — 52(或 104)的平方; 144 — 144的万能平方; 144 (full) — 正方形的“完整”版本,结合了其他正方形的线条。 据我们所知,W.D.江恩并没有这样的加价; for Arcs — 圆弧的简化正方形; Grid — 网格的变体: 4x4 (52) — 4 x 4 网格,52 个标记; 5x5 (40); 8x8 (90); 8x8 (104); 8x8 (144); 16x16 (144); 36x36 (144); disable — 禁用网格; Arcs — 弧线的变体: 4x4; 5x5; disable — 禁用弧; 开始时的方形参数: Length of Square, Bars (X-axis) — 正方形的长度(以条

Speed ticks 该指标测量滴答的速度。一秒内的滴答数。它的计算方法是设置中指定的刻度数除以它们出现的时间。 可以通过带有扬声器图标的按钮关闭滴答声出现的声音伴奏,绿色 - 开,红色 - 关。
指标设置说明 number_ticks - 开始计算的刻度数,只有在整个指定的刻度数出现后才会开始计算 _corner - 文本和按钮的锚点,默认右下角 clr_back - 背景颜色 clr_border - 边框颜色 clr_text - 文本颜色 width_border - 边框粗细 file_sound1 - 第一个声音文件 file_sound2 - 第二个声音文件 Speed ticks 该指标测量滴答的速度。一秒内的滴答数。它的计算方法是设置中指定的刻度数除以它们出现的时间。 可以通过带有扬声器图标的按钮关闭滴答声出现的声音伴奏,绿色 - 开,红色 - 关。
指标设置说明 number_ticks - 开始计算的刻度数,只有在整个指定的刻度数出现后才会开始计算 _corner - 文本和按钮的锚点,默认右下角 clr_back - 背景颜色 clr_border

Swing High Low Pattern Recognition is a great indicator able to fix price levels and analyze the market swings. Swing High Low uses a dynamic approach of analysis that allows you to identify easily the best entry levels. The indicator using the minimum and maximum periods of the previous candles to analyze the impulsive movement and finally it sets the entry levels. The entry levels are: fast, good and best . The best is the last confirm of the swing. For a correct use we advise to wait the comp
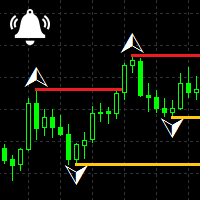
Fractals Notifier MT4 is a modification of Bill Williams' Fractals indicator. The fractal consists of two sets of arrows - up (upper fractals) and down (lower fractals). Each fractal satisfies the following conditions: Upper fractal - maximum (high) of a signal bar exceeds or is equal to maximums of all bars from the range to the left and to the right; Lower fractal - minimum (low) of a signal bar is less or equal to minimums of all bars from the range to the left and to the right. Unlike a stan

The indicator provides volume delta analysis and visualization. It calculates tick volumes for buys and sells separately, and their delta on every bar, and displays volumes by price clusters (cells) for a specified number of recent bars. This is a special, more descriptive version of the indicator VolumeDelta . This is a limited substitution of market delta (market depth) analysis, which is normally based on real volumes, but they are not available on Forex. The indicator displays the following

Price Action Strength indicator uses the purest form of data available in the market (price action) to indicate the strength of the market move. Reading price action and measuring its strength is a subjective matter and it is a technique that takes years to master. The purpose of the indicator is to make the reading of the price action strength as objective as possible. The indicator is far more advanced then default oscillators, because in addition to the price movement and its direction, the P

Comb 指示器显示蜂窝网格或正六边形。替代标准交易终端网格。 指标设置说明: color_comb - 网格颜色 width - 宽度,例如:22为1920*1080分辨率的屏幕,15为1366*768分辨率的屏幕等。 height - 高度,例如:6代表分辨率为1920*1080的屏幕,4代表分辨率为1366*768的屏幕等。 指示器显示蜂窝网格或正六边形。替代标准交易终端网格。 指标设置说明: color_comb - 网格颜色 width - 宽度,例如:22为1920*1080分辨率的屏幕,15为1366*768分辨率的屏幕等。 height - 高度,例如:6代表分辨率为1920*1080的屏幕,4代表分辨率为1366*768的屏幕等。
FREE

Pivot Points is used by traders to objectively determine potential support and resistance levels. Pivots can be extremely useful in Forex since many currency pairs usually fluctuate between these levels. Most of the time, price ranges between R1 and S1. Pivot points can be used by range, breakout, and trend traders. Range-bound Forex traders will enter a buy order near identified levels of support and a sell order when the pair nears resistance. But there is more one method to determine Pivot po
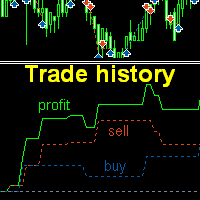
The indicator plots charts of profit taken at the Close of candles for closed (or partially closed) long and short orders individually. The indicator allows to filter orders by the current symbol, specified expert ID (magic number) a nd the presence (absence) of a substring in a order comment , to set the start time and the periodicity of profit reset (daily, weekly or monthly) to calculate the profit chart. The indicator also displays the floating (not fixed) profit of the opened orders at the

Multi-timeframe Parabolic SAR dashboard allows you to add and monitor PSAR trends. The multi-timeframe Parabolic SAR dashboard will save you a lot of time and gives you a single view of the markets using PSAR. In short, you can just view one window and get a snapshot of up to 21 instruments on your MT4 platform. The indicator opens in a sub-window. Below are the features of the PSAR Dashboard Indicator Modify PSAR Settings: The PSAR Dashboard comes with default PSAR settings of 0.02 (Step) and 0

3xEMA Golden Cross Alert is indicator signal strategy trading by 3 Exponential Moving Average (EMA). It'll alert signal on next bar open with an audio or pop up on the chart when EMA signal cross above/below 3 periods EMA for Buy/Sell and Exit alert signal. BUY/SELL: When Short term's EMA > Medium term's EMA > Long term's EMA = Buy Signal When Short term's EMA < Medium term's EMA < Long term's EMA = Buy Signal Exit: When Short term's EMA < Medium term's EMA > Long term's EMA = Exit Signal for Bu
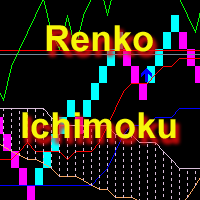
The indicator displays Renko bars, uses their data to calculate and display the Ichimoku Kinko Hyo indicator and provides buy/sell signals. Renko is a non-trivial price display method. Instead of displaying each bar within a time interval, only the bars where the price moved a certain number of points are shown. Renko bars do not depend on a time interval, therefore the indicator works on any timeframe without losing its efficiency. Indicator generates two signals: When the Tenkan-Sen line is ab
MetaTrader市场是您可以下载免费模拟自动交易,用历史数据进行测试和优化的唯一商店。
阅读应用程序的概述和其他客户的评论,直接下载程序到您的程序端并且在购买之前测试一个自动交易。只有在MetaTrader市场可以完全免费测试应用程序。
