适用于MetaTrader 4的新技术指标 - 21
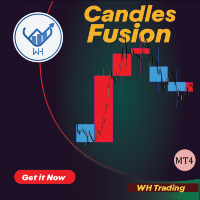
Candles Fusion is a powerful MT4 indicator that enhances your trading analysis by displaying higher timeframe candles on the current timeframe.
This unique feature provides traders with a comprehensive view of price action across different timeframes, enabling them to make more informed trading decisions.
Features:
Multi-Timeframe Overlay. Customizable Timeframe Selection. Clear Visualization and color candle selection . Real-Time Updates. User-Friendly Interface.
Candles Fusion is
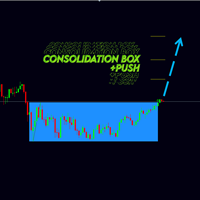
Новая версия индикатора консолидаций Consolidation box Generator. Предыдущая версия тут . Примеры настроек на индикатор тут . На данный момент этот инструмент анализа рынка уже нельзя назвать просто индикатором. Потому как это торговая стратегия. Наше ноу-хау заключается в том, что данный индикатор не требует огромного количества тестов в тестере стратегий. В индикаторе реализован блок статистики - при нанесении на график вам сразу будет видна результативность работы стратегии. Вы можете настро
The Relative Currency Strength Indicator is a tool designed to analyze and compare the strength of a quote currency against four different currency pairs on a selected timeframe. It provides a visual representation of the relative strength of currencies, helping traders identify potential trading opportunities. Key Features: Customizable quote currency: Select a specific currency to measure its strength against multiple currency pairs. Multi-timeframe analysis: Choose the desired timeframe to ev

TPSpro TRENDPRO - is a trend indicator that automatically analyzes the market and provides information about the trend and each of its changes, as well as giving signals for entering trades without redrawing! The indicator uses each candle, analyzing them separately. referring to different impulses - up or down impulse. Exact entry points into transactions for currencies, crypto, metals, stocks, indices! - Version MT5 DETAILED DESCRIPTION / TRADING SETUPS

5/10份,30美元--->下一个50美元// MT5版本
Forex Vigor 是一个技术指标,评估8种主要货币(欧元、英镑、澳元、新西兰元、美元、加元、瑞士法郎、日元)的动能强度。该指标依靠数学计算来衡量28种货币对之间缺乏相关性的情况。为了计算它们的价值,它使用线性加权平均法(LWMA)加上一个统计系统来分析收盘价之间的百分比差异,该系统消除了模型中不代表意义的价值。这种方法提供了一个加权平均值,使最近的价格变动具有更多的意义。通过考虑这个百分比的差异,该指标提供了一个衡量货币动量的强度和方向。
由于它能够评估主要货币的动能强度,并对市场动态提供有价值的见解,该指标可以帮助交易者识别潜在的交易机会,做出更明智的交易决定,并有效地管理风险。
特点 无重绘 新数据到来时,该指标不改变其数值 交易对 28个交易对 时间框架 所有 (M1, M5, M15, M30, H1, H4, D1, W1, MN) 交易时间 每天24小时
配置
ma_period:这个参数影响算法的计算,按照你的意愿使用它。默认情况下,你不需要改变它。 ma_delta:这个参数会影
你是否厌倦了使用不可靠的二元期权指标,它们给出错误的信号,导致损失和沮丧?别再犹豫,来试试CLOCK INDICATOR吧!它是目前MT4交易平台上最好的二元期权指标!
凭借先进的算法和强大的技术分析工具,CLOCK INDICATOR是新手和经验丰富的交易者的终极交易工具。它准确预测市场趋势,发现有利可图的交易机会,帮助你最大化利润,减少亏损。
与其他复杂难用的二元期权指标不同,CLOCK INDICATOR安装和自定义都非常简单。你可以根据个人交易偏好调整设置,并且它在所有主要货币对和时间框架上无缝运行。
CLOCK INDICATOR的一大亮点是它不会重绘。一旦信号生成,它就会一直显示在图表上,这样你可以确信自己基于准确信息做出了明智的交易决策。
不要再浪费时间使用不可靠的指标给出错误信号了。立即下载CLOCK INDICATOR,开始在二元期权交易中看到真正的结果吧。无论你是初学者还是经验丰富的专业人士,这个强大的指标一定能让你的交易水平提升到新的高度。

介绍 F-16 飞机指标,这是一款领先的 MT4 工具,旨在革新您的交易体验。灵感来自于 F-16 战斗机无与伦比的速度和精准度,该指标结合了先进算法和尖端技术,在金融市场上提供卓越的性能。 通过 F-16 飞机指标,您将在竞争中腾飞,因为它提供实时分析并生成高度准确的交易信号。其动态功能旨在识别各种资产类别上的利润机会,让您能够自信地做出明智的决策。 配备用户友好的界面,F-16 飞机指标与热门的 MetaTrader 4 平台无缝集成,确保交易过程顺畅高效。无论您是初学者还是经验丰富的专业人士,该指标都可以轻松定制,以符合您独特的交易风格和偏好。 感受 F-16 飞机指标的威力,它以精确和敏捷的方式驾驭市场趋势。其先进的图表功能使您能够始终领先,检测关键的入场和出场点以实现最佳时机。掌控您的交易之旅,并凭借 F-16 飞机指标释放稳定盈利的潜力。 准备起飞,以这款出色的 MT4 指标将您的交易表现提升到新的高度。F-16 飞机指标是您在金融市场世界中的终极副驾驶员,让您以速度、精确度和自信取得成功。

Professional Histogram (PH) 是一种高效可靠的外汇、差价合约和二元期权交易工具。
PH 易于使用和配置,适合初学者和经验丰富的交易者。
与大多数指标不同,Professional Histogram 发现更长的趋势并提供更少的错误信号。
当出现买入或卖出信号时,会触发警报,让您及时开仓,避免一直坐在电脑前。
交易技巧 当直方图改变颜色时开仓。 请参阅屏幕截图 1 上的示例交易。
该指标最适合在 M15-H4 上交易。
特征 适合剥头皮和长线交易。 向电子邮件和移动设备发送信号。 易于使用和配置。 它既可以作为独立工具使用,也可以与其他指标结合使用。 无需重绘。 没有滞后。
参数 Period - 负责计算指标的平均周期的关键参数。 Filter - 过滤周期。 Alert - 启用/禁用警报。 Email - 启用/禁用电子邮件。 Push - 启用/禁用向手机发送消息。 clrUPPER - 正直方图颜色。 clrLOWER - 负直方图颜色。 Width - 线宽。 祝您交易顺利!

隆重推出 Hull 移动平均线扫描仪 ,这是一种适用于 MT4 的高级多品种和多时间框架指标。这个功能强大且用途广泛的工具旨在增强您的交易决策。该指标结合了 赫尔移动平均线 (HMA) 并提供其他功能以提供快速可靠的警报。 借助赫尔移动平均线扫描仪,您可以受益于跨多个货币对和时间范围的赫尔移动平均线的独特特征。该指标的综合仪表板将所有信号显示为按钮,使您可以方便地访问所需信息。只需单击一个按钮即可打开带有 HMA 线的新图表,更详细地显示信号。 为了简化您的交易体验,该指标包括自动打开与信号对应的最新图表的选项。通过激活“打开新图表”功能,您可以快速分析交易机会并采取行动。 Hull Moving Average Scanner 指标提供两种模式:扫描和单 HMA 线图。在扫描模式下,您可以有效地扫描多个货币对和时间范围以寻找潜在信号。或者,您可以专注于单个 HMA 生产线以进行深入分析和决策。 借助我们全面的警报系统,绝不会错过任何交易机会。该指标提供了一系列通知选项,包括弹出警报、移动通知、电子邮件警报和声音警报。在任何设备上保持联系并接收即时更新,使您能够迅速响应市场动向。 H

隆重推出移动平均交叉扫描仪专业版,这是一种功能强大且用途广泛的多品种交易品种, 多时间框架 旨在增强您的交易决策的指标。这个高级指标结合了移动平均线 (MA) 交叉并提供额外的功能以提供快速可靠的警报。
使用移动平均线交叉扫描仪专业版,您可以受益于跨多个货币对和时间范围的 MA 交叉的独特特征。该指标的综合仪表板将所有信号显示为按钮,使您可以方便地访问所需信息。只需单击一个按钮即可打开带有交叉线的新图表,以更详细地显示信号。
为了简化您的交易体验,该指标包括自动打开与信号对应的最新图表的选项。通过激活“打开新图表”功能,您可以快速分析交易机会并采取行动。
Moving Average Crossover Scanner Pro 提供两种模式:扫描和单交叉线绘制。在扫描模式下,您可以有效地扫描多个货币对和时间范围以寻找潜在信号。或者,您可以专注于单条交叉线以进行深入分析和决策。
借助我们全面的警报系统,绝不会错过任何交易机会。该指标提供了一系列通知选项,包括弹出警报、移动通知、电子邮件警报和声音警报。在任何设备上保持联系并接收即时更新,使您能够

体验 Parabolic Breakout Scanner Pro 的强大功能,这是一种先进的多品种和多时间框架指标,它将改变您的交易旅程。该指标具有无与伦比的准确性,使您能够识别 SAR 突破并及时接收最佳进入和退出点的警报。发现用户友好的仪表板、可自定义的参数、自动图表打开以及让您与市场保持联系的综合警报系统的便利性 Parabolic Breakout Scanner Pro 旨在为交易者提供卓越的功能。凭借其同时扫描和分析多个货币对和时间框架的能力,这个强大的指标为您提供了市场格局的整体视图。借助我们全面的仪表板,可以清楚地了解潜在交易,无缝浏览交易机会并轻松做出明智的决定。 通过我们的交互式按钮界面简化您的交易体验,让您轻松访问详细的图表分析。只需单击一个按钮,即可深入研究市场趋势、分析模式并发现有价值的见解。告别手动打开图表,因为我们的自动打开图表功能会为您处理流程,确保无缝和高效的分析。 使用我们全面的警报系统,再也不会错过任何交易机会。接收弹出通知、移动警报、电子邮件和声音通知,让您随时了解潜在的进入点和退出点。保持联系并充满信心地利用市场走势,因为您知道最新信息触手可
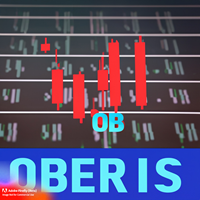
您想使用訂單塊指示器改善您的交易嗎? 訂單塊是市場上買入或賣出訂單積累的區域,可能導致趨勢變化或強勁波動。 識別這些訂單塊對於尋找進入和退出機會以及管理風險和利潤非常有幫助。 但是手動查找這些訂單塊可能既困難又乏味。 這就是我們創建 Oberis 的原因,它是 MetaTrader 4 的訂單塊指示器,可幫助您自動檢測並在圖表上標記這些塊。 Oberis 是如何工作的? Oberis 是一種分析價格和交易量以識別市場中最相關的訂單塊的指標。 這些訂單塊顯示為綠色或紅色矩形,具體取決於它們是看漲還是看跌。 Oberis 非常易於使用。 您只需將它安裝在您的 MetaTrader 4 中並將其應用到您要交易的貨幣對或資產的圖表上。 Oberis 適用於任何時間範圍和任何圖表類型。 Oberis有什麼優勢? Oberis 為您提供多項優勢來改善您的交易: 通過為您找到訂單塊來節省您的時間和精力。 幫助您在正確的時間以正確的方向進入市場。 允許您根據訂單塊設置止損和目標。 使用專業有效的工具讓您充滿信心和安全感。 實時更新圖上的OB
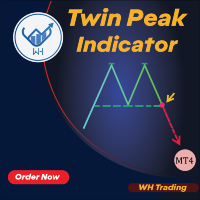
欢迎使用双峰指标 MT4 --(双顶/双底)-- 双顶底指标是一种技术分析工具,旨在识别市场中潜在的反转模式。
它确定了价格连续出现两个几乎相等高度的波峰或波谷,随后价格向相反方向移动的区域。
这种模式表明市场正在失去动力,可能已准备好趋势逆转。
特征:
自动图表注释:指标自动在图表上标记双顶底形态 易于使用:该指标用户友好,可以轻松应用于 MT5 平台中的任何图表。 可定制:指标具有可定制的设置。 警报系统。 适用于任何乐器。 该指标可与其他技术分析工具结合使用,以确定趋势方向和反转形态的潜在强度。 总的来说,双顶和双底指标是寻求识别市场潜在趋势逆转的交易者的强大工具。
其可定制的设置、警报和自动图表注释使其易于使用,
而其多时间框架分析和趋势确认功能为交易者提供了对潜在交易机会的宝贵见解。
介绍绘图指标:释放您在图表上的创造力!
您是否厌倦了在交易图表上进行注释的困扰?是否试图理解自己的分析或有效传达自己的想法?别再犹豫了!我们非常高兴向您推荐绘图指标,这是一款创新的工具,让您只需点击几下鼠标或挥动笔尖,就能轻松地在图表上进行绘图和注释。
我们创新的绘图指标旨在增强您的图表体验,释放您的创造潜力。有了这个强大的工具,您可以轻松表达自己的想法,标记重要水平,突出显示模式,并以前所未有的方式可视化您的交易策略。无论您是经验丰富的交易者、技术分析师还是初学者探索迷人的交易世界,绘图指标都是一个宝贵的资产,将彻底改变您与图表互动的方式。
主要特点:
用户友好界面:我们理解无缝用户体验的重要性。我们直观的界面确保您可以轻松地操作工具,并轻松访问所有功能。告别繁琐的设置,迎接简单性。
精准绘图:绘图指标允许您直接在图表上绘制线条、形状和注释。无论您是使用鼠标还是笔,我们的工具都提供流畅且响应灵敏的绘图体验,确保您的创造力无障碍地流动到图表上。
删除和重绘:犯了个错误或者想重新开始?没问题!我们方便的删除按钮可以轻松删除之前的绘图或注释。通过纠正和完善您的作品

Scalping Entry Points - is a manual trading system that can adjust to price movements and give signals to open trades without redrawing. The indicator determines the direction of the trend by the central level of support and resistance. The dot indicator provides signals for entries and exits. Suitable for manual intraday trading, scalping and binary options. Works on all time frames and trading instruments.
The indicator gives several types of alerts.
How to use the product
The blue line
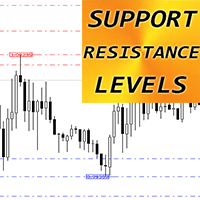
MT4 外汇指标“支撑阻力位”
“支撑阻力位”指标是非常有用的交易辅助指标 “支撑”和“阻力”是图表上受价格影响的重要区域 支撑位是价格定期停止下跌并反弹的地方 阻力位是价格通常停止上涨并回落的位置 指标“支撑阻力位”显示最近的水平: 阻力位 - 红线。 支撑位 - 蓝线 用于计算的条数、线型和颜色可以在设置中调整 “支撑阻力位”指标非常适合通过价格行为模式来规划您的止盈目标、价格反转和重新测试。
// 这里提供更多优秀的 EA 交易和指标: https://www.mql5.com/en/users/def1380/seller // 也欢迎您加入盈利、稳定、可靠的信号 https://www.mql5.com/en/signals/1887493 它是仅在该 MQL5 网站上提供的原创产品。

"Dragon's Tail"是一种综合交易系统,而不仅仅是一个指标。这个系统以分钟为单位分析每一个蜡烛,这在市场波动性高的情况下特别有效。 "Dragon's Tail"系统确定市场的关键时刻,称为"公牛和熊的战斗"。基于这些"战斗",系统给出交易方向的建议。在图表上出现箭头的情况下,这表明有可能在指示的方向上开设两个交易。黄线和绿线分别作为第一和第二个交易的获利水平。在达到黄线水平并关闭第一笔交易后,建议在第二笔交易开启的水平上设定止损。 时间框架和工具的选择取决于交易员的偏好,但为了达到最佳结果,建议使用H4和D1的时间框架,并考虑所选工具的差价大小。 "Dragon's Tail"的设置参数可以分为两组: 直接影响交易结果的参数: 历史深度 - 只影响图表上入口点的显示。推荐值:D1 - 10,H4 - 15,H1 - 20。 获利1和获利2 - 影响最终结果。取决于时间框架的推荐值:D1 - 250/450,H4 - 150/250,H1 - 75/150。 负责系统视觉设计的参数。可以根据交易员的意愿进行设置。 重要的是要记住,"Dragon's Tail"是一个需要交易员

The Accurate Werewolf indicator tracks market trends, ignoring sharp swings and market noise. The indicator can work both for entry points and as a filter.
The Accurate Werewolf indicator displays information in a visual way. It will help in finding entry points in the analysis. Suitable for trading on low timeframes because it ignores sudden price spikes or corrections in price action by reducing market noise around the average price.

Jerk Trend is a new product that allows you to identify the current market phase (uptrend, downtrend or flat). Represents a typical investor strategy that usually indicates a trend change from bearish to bullish. A tool that allows you to determine the direction and strength of a trend. Unlike most indicators, Jerk Trend finds longer-term trends and gives fewer false signals.
This indicator displays arrows of different colors depending on the current state of the market and thus signals the u

Ready-made trading strategy on the signals of the "Myforexfunds" indicator:
1. Market entry point: When the indicator draws a blue line, open the cover to buy (long). When the indicator draws a red line, open the cover to sell (short). You can enter the market at the close of the bar, when a new signal is formed.
2. Market exit point: Set-stop-loss (stop-loss) at the old distance from the entry point, eliminating potential losses in case of wrong market direction. For example, you can set a

The ICT Concepts indicator regroups core concepts highlighted by trader and educator "The Inner Circle Trader" (ICT) into an all-in-one toolkit. Features include Market Structure (MSS & BOS), Order Blocks, Imbalances, Buyside/Sellside Liquidity, Displacements, ICT Killzones, and New Week/Day Opening Gaps. It’s one kind of Smart money concepts. USAGE: Please read this document ! DETAILS Market Structure Market structure labels are constructed from price breaking a prior extreme

URGENT REMINDER> Only 5 remaining Copies for next unlimited price to be 360$ (THIS IS A SPECIAL OFFER TOOL) If you are looking for FAST , RELIABLE and PROFITABLE indicator to help you take easy trades then this is the tool to go with. Trading is very tricky, frustrating, confusing, embarrassing and even can make you go broke if you approach the market with gambling mindset, poor entry and exit strategies, unreliable indicators or signals, poor money management skills and lack of knowledge. Many
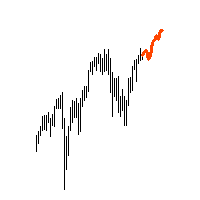
"AV Forecast" is a preview or forecast indicator for MetaTrader 4, which draws forecast future price changes on the chart from historical data. To do this, it primarily uses the everyday rhythm and the seasonality of the year. For timeframes below H1 closer dates can be selected. The lines for calculation can be made visible.
Settings:
- Draw line for x candles: draw x candles in the future
- Show all lines: yes/no
- Look back years or mixed (> H1 same): one year back or less beneath H

The indicator visualizes the result of the CalculateScientificTradePeriod script (which, of course, also needs to be downloaded), which, firstly , estimates how many Mx bars of the active chart the future trend will most likely continue and what is its quality, and, secondly , calculates the optimal the averaging period (which is also equal to Mx) of the ScientificTrade indicator, which gives the maximum profit according to the extremely effective ScientificTrade strategy. For the FindS

Automated Supply and Demand Trading Edge MT4 These videos demonstrate how we apply the supply and demand system to our latest trading review and market analysis. US Tech 100 Index Trade Setup time laps 12/6/2023. https://youtu.be/zHdjHnr3GNo https://youtu.be/JJanqcNzLGM , https://youtu.be/l70MIHaQQa4 , https://youtu.be/pg0oiT5_8y0 Enhance your Trading Strategy with the Supply and Demand Trading Edge MT4. Gain a competitive market advantage with the Supply and Demand Trading Edge MT4

A popular signal indicator marking buy/sell points. Recommended for use in conjunction with a trend indicator to filter signals. The indicator has only one adjustable parameter that determines its sensitivity, which greatly simplifies setting the indicator to the current market and the user's trading style. The indicator can be used to trade any market. Its basic parameters perform well in most situations. At the same time, before starting trading, you should choose the most effective indicator
The presented indicator gives signals about the price leaving the Donchian channel, as well as about the price returning to the channel. Donchian channel - a technical indicator developed by Richard Donchian, is a variation of the trading interval breakout rule. It is built by taking the highest (high from High) and lowest (low from Low) prices for the previous n periods, followed by marking the area between them on the chart. Donchian recommended using his indicator for daily timeframes with an
The presented indicator gives signals about the price exiting the Keltner channel, as well as about the price returning to the channel. Keltner channel is a technical indicator consisting of two bands above and below the moving average of the price indicator, the width of which is determined as a share of the average price change over the period. The author of this technique is Chester W. Keltner, who published it in his book How To Make Money in Commodities in 1960. The Keltner channel has unde
One of the basic rules of trading is that the trend is your friend. The presented indicator is one of the best solutions for building your own trading system. Basic rules for its use: Green line - buy trades are allowed; Red line - sell trades are allowed. The indicator displays signals confirming the development of a bullish and bearish trend using the ADX oscillator algorithm. Average directional movement index (ADX) determines a price movement direction comparing its high and low with high an

The Binary Tend Follower indicator has been designed especially for Binary options trading. The best time frame to use the indicator on is a 1M chart with 1Min expiry's as soon as the signal candle closes. There is no need to over complicate your trading as all the thinking has been done for you. The indicator was designed as simple as possible to take out all the subjectivity of trying to follow a complicated strategy, and allowing the trader to focus on extremely simple entry's. Buy: When th

The Shock Trend indicator shows the moments for entering the market with arrows. This is a hybrid indicator, as it is based on the signals of several two well-known products - the average true range indicator, which determines the range of minimum and maximum price fluctuations, as well as closing prices. As a result - indicates the current market volatility. Also an indicator of the oscillator family. The indicator helps to calculate the oversold and overbought levels of a trading instrument.

Love Trend indicator showing buy and sell areas. The indicator follows the price movement around the opening price. It also displays information about the trend following the breakout of the low and high. The indicator has a very simple but effective graphic: an orange dot is displayed above the open price, and a blue dot is displayed below the open price. The indicator also includes an audible alert and a pop-up window to alert you when the candle closes at these important levels. The indicator

Forex indicator "Search for a reversal" is a technical tool designed for traders involved in scalping in the Forex currency market. Scalping is a trading strategy that aims to make small profits from frequent trades on short-term time frames. The "Search for a reversal" indicator helps traders identify the best entry and exit points in the market, taking into account short-term trends and price fluctuations. The main purpose of the "Search for a reversal" indicator is to provide traders with th
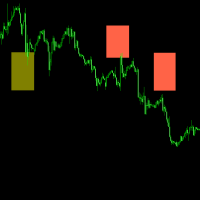
用这个指标,应用于货币兑非常好用,比如欧元、英镑、澳元、纽元、加拿大元、瑞士法郎 可以很容易找到的上下区间 国际上标准的大平台都很好用,不建议使用小平台.推荐瑞讯银行.或者EXNESS.
瑞讯开户链接: https://trade.swissquote.ch/signup/public/form/full/fx/com/individual?lang=cn&partnerid=daf9af43-2f95-443e-86c5-89ce1ab2bd63#full/fx/com/individual/step1 EX开户链接: https://one.exness.link/a/t2v0o2v0 只要稍微懂一点交易,用上这个指标的辅助,就如鱼得水 这个指标能告诉我们方向和价格区间 红色是做空 深黄色是做多 这个指标是本人独立开发,任何问题都能联系我,可以留言,也可以在TG找我。 用法: 行情遇到色块会回头 上方色块做跌 下方色块做涨 下单位置在色块边缘及色块中央 止损位置在色块外 止盈位置无法固定,参考前面的行情。
FREE

TrendXplorer indicator is designed to provide valuable insights into market trends, helping you navigate the dynamic world of trading with confidence. Key Features: Accurate Trend Analysis: TrendXplorer utilizes a special algorithm to analyze trends combined with price action. This enables easier trend detection and is less prone to change during price manipulation. Built-in Risk Calculator: Take control of your risk management with TrendXplorer's built-in risk calculator. This feature assesses
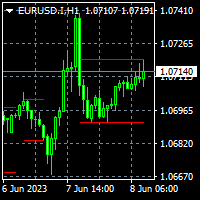
To get access to MT5 version please contact via private message. This indicator is not a standard indicator and you may get into trouble installing it. Please contact via private chat if you face trouble. This is exact conversion from TradingView: "Consolidation Zones - Live" by "LonesomeTheBlue". This is a light-load processing indicator. Updates are available only upon candle closure. Buffers are available for processing in EAs. It is a repaint indicator. So previous buffer values do not repre
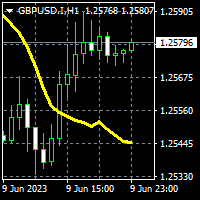
To get access to MT5 version please click here . This is the exact conversion from TradingView: "ZLSMA - Zero Lag LSMA" by "veryfid". This is a light-load processing indicator. This is a non-repaint indicator. Buffers are available for processing in EAs. All input fields are available. You can message in private chat for further changes you need. Thanks for downloading

Introducing Round Range 5, a versatile and dynamic indicator designed to optimize your trading strategies on MT4. Let's explore how this indicator can revolutionize your trading experience by adapting round number levels to suit the unique characteristics of each instrument.
In the fast-paced world of financial markets, round numbers play a crucial role. These price levels, ending with multiple zeros or other significant digits, often act as psychological barriers that influence market sentim
FREE

This indicator is based the principle of breakout candle. Every candle that breaks out from the cluster may not lead to a rally. There are various factors that determine how a breakout candle will behave. This indicator calculates all those factors to suggest BUY/SELL signal once a breakout happens. This is a universal indicator that can work for all kind of instruments eg stock, currency, oil, crypto etc. This also works in every timeframe. PARAMETERS ================= move = 20 strongCandle =

Introducing the Gold Multiply Funds EA - a revolutionary trading tool that is based on the powerful principle of compounding. MT4 Version : https://www.mql5.com/en/market/product/90177
MT5 Version : https://www.mql5.com/en/market/product/95784
Brief description EA for XAUSUD: AI & machine learning detect/respond to market trends with precision. Trading Strategy Advanced pattern recognition using AI and Machine learning for profitable trades 65-70% correct prediction accuracy in 10

When it comes to trading in the financial markets, there's no question that the banks have a major advantage. They have access to vast amounts of resources, including high-powered trading algorithms, in-depth market research, and teams of experienced traders. But what if you could level the playing field and trade like the banks do? That's exactly what our Smart Money Indicator allows you to do. By providing you with critical insights into market structure and supply and demand zones, you can ma
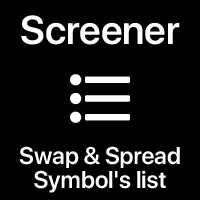
Market screener: Spread and Swap, for selected Symbols. You can customize the list: set only the Symbols (currency pairs) that are needed. The number of Symbols is unlimited. The list can be sorted in ascending or descending order (Symbol name). The panel can be moved to any place on the chart. You can also minimize the panel. Displayed values: Current market price (BID); Spread size; Swap, for Long positions; Swap, for Short positions; Overall P/L of the entire account; My #1 Utility : includ

TruRange is a Next-Level trend and range detection created from algorithms based on price action. No other indicator apart from ATR is used in the computing of the main line indicator
It separates Trending and Ranging market conditions without any lag. It's good to separate mean reverting strategies from trending/breakout strategies.
Settings : Bars : number of bars to compute Sensitivity : a lower value will have longer range periods while a higer value will have more smaller ranging peri

Dynamic Price Volatility Indicator (DPVI)
The Dynamic Price Volatility Indicator (DPVI) is designed to provide traders with valuable insights into market volatility and potential price movements. It combines elements of volatility analysis and trend identification to assist traders in making informed trading decisions.
Features: Dynamic Volatility Bands: utilizes a proprietary algorithm to calculate dynamic volatility bands that adjust in real-time based on market conditions. These bands act
FREE
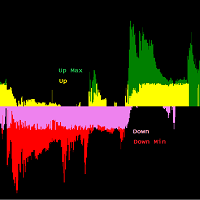
Trend Reversal Identifier es un indicador de análisis profundo que no repinta de alto rendimiento que sirve para detectar y confirmar Pullbacks, Soportes y Resistencias. También posee un alto valor para detectar divergencias al tener los movimientos alcista y bajistas dados por separado con mucha claridad. Debido a la estructura implícita del algoritmo es plenamente válido para cualquier par/periodo y no necesita configuración. Tenemos dos zonas principales: Zona Up y Zona Down, las cuales a s

货币强度向导是一个非常强大的指标,为您提供成功交易的一体化解决方案。该指标使用多个时间范围内所有货币的数据来计算这个或那个外汇对的力量。此数据以易于使用的货币指数和货币电力线的形式表示,您可以使用它们来查看这种或那种货币的力量。 您所需要的只是将指标附加到您要交易的图表上,该指标将向您显示您交易的货币的真实强度。该指标还向您显示买卖量压力的极值,您可以在顺势交易时利用这些压力。该指标还显示了基于斐波那契的可能目标。该指标可用于各种交易时间范围。该指标支持各种货币对的交易。 该指标为您提供所有类型的警报,包括推送通知。 购买后请联系我。我将与您分享我的交易技巧,并免费为您提供丰厚的红利指标! 祝您交易愉快,获利丰厚!
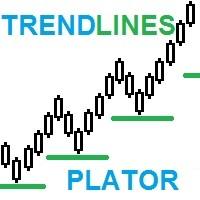
TrendLines Plator:利用先进的趋势投影指标优化您的交易策略 探索我们创新指标的潜力!该指标具备在您当前时间段内直接分析和预测更长时间框架的趋势线的能力,为普通交易者提供战略性支持。这些点将成为您交易中强大的支撑或阻力水平,增强您的交易策略。 想象一下拥有这样一款能够与您的价格行动指标完美融合的指标。我们创新指标填补了这一空白!试用它,您将惊叹于其准确性。它可能成为提升您策略并推动您业绩的关键要素。 别错过这个机会!立即抓住将这款令人惊叹的工具纳入您的交易资源中的机会。如果您认识到它的价值和潜力,请毫不犹豫地在今天获取它。提高您的交易准确性,实现新的成功高度,这款高性能指标将助您一臂之力! 关注我们的最新消息 立即订阅以获取我们独家发布的最新产品。将 Francisco Gomes da Silva 添加为好友,独享我们的新品发布。 别再浪费时间! 立即下载我们的 Metatrade指标 ,仅需几秒钟即可获得准确高效的市场分析。 同样适用于您的MT4平台 如果您正在寻找类似于MT5的工具,您可以从以下链接下载: Trendlines Plator MT5 。

Tendenceris - MT4趨勢指標 提升您的交易能力,使用 Tendenceris ! 這款令人驚豔的 MetaTrader 4 指標,以即時模式顯示不同時間框架的趨勢。不要錯過任何交易機會! 主要功能: 在不同時間框架(從 1分鐘 到 1天 )識別並視覺化趨勢。 直觀簡潔的界面,清楚呈現圖表上的趨勢資訊。 即時更新,隨時獲取趨勢變化的最新資訊。 支援廣泛的金融工具。 可根據個人偏好和交易策略進行自定義設置。 主要優勢: 根據 主導趨勢 做出明智的交易決策。 節省時間和精力,全面了解不同時間框架上的趨勢。 以準確及時的資訊增加交易信心。 根據最強勁和最 持久的趨勢 來優化您的交易策略。 避免逆勢交易,最大化您的利潤。 不要錯過任何交易機會!立即獲取 Tendenceris ,提升您的交易能力! 請注意, Tendenceris 兼容MetaTrader 4,可在真實和模擬賬戶上使用。 立即使用 Tendenceris 提升您的交易能力!
YouTube

推出适用于 MT4 的 Hull Crossover Alert 指标,这是一款旨在增强您的交易决策的强大工具。该指标利用 赫尔移动平均线 (HMA) 并结合高级功能来过滤错误信号并提供快速可靠的警报。
使用 Hull Crossover Alert 指标,您可以从 Hull 移动平均线的独特特征中获益。它对价格变化的响应能力和平滑的曲线可帮助您更准确地识别潜在的趋势变化和市场逆转。
借助我们全面的警报系统,随时了解最新消息,绝不会错过任何交易机会。该指示器提供弹出、移动、电子邮件和声音警报,使您能够在任何设备上接收即时通知。无论您是在积极监控市场还是在旅途中,您都可以保持联系并针对潜在的交易机会迅速采取行动。
Hull Crossover Alert 指标的设计用途广泛,可适应您的交易风格。它可以应用于各种时间框架、市场和交易策略,使其成为各种专业水平交易者的宝贵工具。
参数 HULL 移动平均参数 快速 HMA 周期 - 快速 Hull 移动平均计算周期。
快速方法 - 用于快速 Hull 移动平均计算的方法。 Fast price - 用
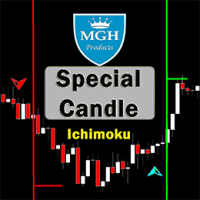
特殊蜡烛
您想使用其中一个最佳的外汇指标和成功的Ichimoku策略吗?您可以使用基于Ichimoku策略的这个令人惊叹的指标。
MT5版本在这里 。
第一策略:
此策略涉及识别很少出现相似强交叉。
此策略的最佳时间框架为30分钟(30M)和1小时(H1)。
适用于30分钟时间框架的合适符号包括:
• CAD/JPY
• CHF/JPY
• USD/JPY
• NZD/JPY
• AUD/JPY
• EUR/USD
• EUR/GBP
对于1小时时间框架,适当的符号包括:
• GBP/USD
• GBP/NZD
• GBP/AUD
• USD/CAD
• USD/CHF
• USD/JPY
• EUR/AUD
第二策略:
此策略涉及识别与趋势方向相同的强大Tenkunsen和Kijunsen交叉。
此策略的最佳时间框架为1分钟(1M)至15分钟(15M)。
此策略可应用于大多数货币和符号。
第三策略:
此策略涉及将第一和第二策略组合起来,它们之间有x个蜡烛的距离。您可以从设置中更改X。默认设置为3。
我们提供支持,无论何时出
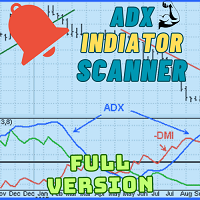
Welcome to advanced trading with the ADX Multicurrency Scanner! Elevate your trading experience with our powerful MT4 indicator, designed for seamless currency scanning and real-time insights. Key Features: Effortless Multicurrency Scanning: Unlock the full potential of the ADX Multicurrency Scanner by effortlessly scanning multiple currencies. Receive instant alerts when specific conditions are met, ensuring you stay ahead of the market and capitalize on every trading opportunity. Comprehensiv

Pips forex 是一個現成的交易系統。 該指標在圖表上用箭頭顯示您需要在何時何地開訂單。 如果箭頭是綠色的,那麼我們打開一個買入交易,如果箭頭是紅色的,那麼我們打開一個賣出交易。 一切都非常簡單而且非常有效。 TakeProfit 設置 15-25 點。 止損設置在點位水平。 當點移動時,我們立即覆蓋止損。 M1 和 M5 交易的推薦時間範圍。 這是一種剝頭皮策略,在最小的時間範圍內效果最好。 貨幣對可以是任意的。 在推薦的貨幣中,我們可以提供 GBPUSD、EURUSD、XAUUSD、USDCHF。 設置可以保留為默認值。 您可以使用此策略每天進行 10-20 筆交易。
Pips Forex 指標的優勢: 這是適用於任何貨幣對的現成交易策略。 這是在最小時間框架 M1 和 M5 上交易的剝頭皮交易策略 這個策略非常簡單,不需要額外的指標。 該策略非常穩定且非常安全,因為它使用止損來限制意外損失。 該指標不會重新繪製其信號。 他畫了一支箭,它永遠留在那裡。
點數外匯指標設置: period_indicator - 指標週期。 這是唯一的指標設置,創建它是為了減少或增加信
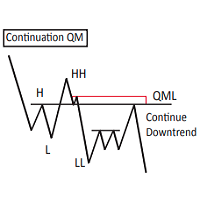
Custom Mapping Tool by Shredderline is an innovative MT4 indicator that simplifies the process of marking and mapping charts. With this tool, you no longer have to waste time rewriting repetitive words, rectangles, and trendline colors every time. New Feature V5.60:
Draw path - Same as the TV Path drawing mode, which is very useful for naked chart trader. You can draw zigzag, draw your patterns manually. Change style in indicator setting. Crop function disabled by default. Can be enabled and s
FREE
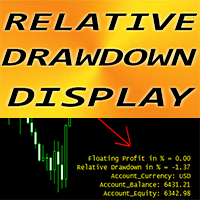
MT4 的外汇指标“相对回撤显示”,交易支持工具。
对于使用网格交易系统的交易者来说,这是必须具备的指标!
相对回撤显示指示器显示您账户当前的相对回撤或浮动利润(以百分比表示)。 PC 和移动警报内置可调节触发级别 指标还显示账户余额和净值 可以在图表的任何角落找到指标值: 0 - 左上角,1 - 右上角,2 - 左下角,3 - 右下角。 还可以设置颜色和字体大小。 如果使用相对回撤显示,交易者不再需要任何计算器
// 这里提供更多优秀的 EA 交易和指标: https://www.mql5.com/en/users/def1380/seller // 也欢迎您加入盈利、稳定、可靠的信号 https://www.mql5.com/en/signals/1887493 它是仅在该 MQL5 网站上提供的原创产品。

为您介绍MQL4的Donchian通道指标,这是一个强大的技术分析工具,旨在提升您的交易成功率。该指标由四条线组成,代表了在指定时期内价格运动的上限和下限。 通过Donchian通道指标,您可以轻松识别市场潜在的突破和反转。上线显示指定时期内的最高点,而下线代表最低点。这两条线之间的空间形成一个通道,为您提供了有关资产交易价格范围的有价值见解。 但这还不是全部 - 我们进一步改进了这个令人难以置信的指标。我们的修改允许您按照一定百分比(表示为'shadowTop'和'shadowBottom')减小通道宽度。通过缩小通道,您可以更敏锐地感知价格波动,并准确定位入场和出场点。 无论您是经验丰富的交易者还是初学者,带有减小通道宽度的Donchian通道指标都是您交易工具箱中必备的工具。它能够让您基于市场波动和价格行为做出明智的决策。 不要错过将您的交易推向新高度的机会。体验带有减小通道宽度的Donchian通道指标的强大功能,释放您的交易潜力吧。
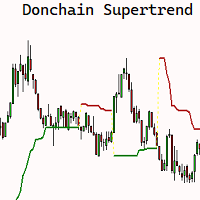
The SuperChannel indicator for MQL4 is a POWERFUL technical analysis tool designed to help you make informed trading decisions. BASED ON the popular SUPERTREND indicator, this indicator offers a UNIQUE approach Using HIGHS and LOWS over an n-period instead of the Average True Range (ATR) to construct the line. The SuperChannel indicator allows you to easily identify market trends and pinpoint optimal entry and exit points for your trades. By using historical highs and lows, the indicator plots a

An extremely convenient indicator that truly makes the process of making money on the exchange easy. It is based on the scientifically rigorous theory of the market developed by the author, the beginning of which is presented here . The full algorithm of this indicator operation is presented in the article . The indicator calculates the most probable price movement trajectory and displays it on the chart. Based on the predicted price movement trajectory

The MAtrio indicator displays three moving averages on any timeframe at once with a period of 50-day, 100-day, 200-day. After attaching to the chart, it immediately displays three moving averages with the parameters of simple (SMA) moving average SmoothingType50 , simple (SMA) moving average SmoothingType100 , simple (SMA) moving average SmoothingType200 . Accordingly, with the price type ValuePrices50, ValuePrices100, ValuePrices200 , by default, the price is Close price everywhere. All parame
FREE

"TOP G ARROWS" shows price reversal points designed for scalping and intraday trading.
Contains internal reversal filters (ATR, HHLL, RSI). Can be used on all time frames and trading instruments. Can be used on M1, M5, M15 time frames for scalping or M30, H1, H4 for intraday trading, Recommended for M30 and H1. The arrows are built on candle close (appears on previous bar at the open of the new candle)

If you have been anywhere near Forex forums or social media lately, you have no doubt been hearing people talk about Smart Money Concepts (SMC) trading. You may be wondering what SMC is, and whether it deserves all the hype. In this post, we will introduce Smart Money Concepts trading to you so you can make an informed decision about whether or not to give this strategy a try in your own trading. What is SMC Forex trading? Smart Money Concepts (SMC) is one of many forex trading methods. SMC

The indicator has been designed to function on any time-frame and any pair. This regime filter will help the trader better evaluate whether the current market is trending, and in which direction. It quickly reacts to changes in market dynamics using a series of advanced calculations. The user is able to select whether the calculation remains standard, or if a further filter constraint is added to the calculation. A Yellow moving average of the signal has been included for the trader to smoot
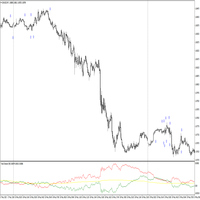
The indicator has been designed to function on any time-frame and any pair, although it is best suited for 5-minute charts. This trend filter will help the trader better evaluate whether the current market is trending, and in which direction. A dynamic filter threshold has been added to help the trader avoid choppy market conditions, and add greater confidence when entering, with an added functionality of plotting signal arrows on the chart to aid in detecting possibly entries. The Yellow in
The indicator has been designed to function on any time-frame and any pair, although it is best suited for currency pairs on 5-minute charts, and used in conjunction with the Trend Direction Filter Indicator . This trend volatility filter will help the trader better evaluate whether the current market is trending, and in which direction. A dynamic filter threshold has been added to help the trader avoid choppy market conditions, and add greater confidence when entering, with an added functiona

Unleash the Power of Repetitive Market Price Levels (Markets often repeat structure ).
Are you tired of guessing the crucial support and resistance levels in your trading strategy? Do you want to enhance your decision-making process with reliable and accurate market insights? Look no further! We proudly present the interactive digital product designed to transform your trading experience – the Ultimate Support and Resistance Zones Indicator.
Unlock the Potential of Critically Watched Sup
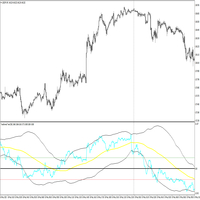
The indicator has been designed to function on any time-frame and any pair, although it is best suited for 5-minute charts. This price transformation will help the trader better evaluate whether the current market is trending, and in which direction. A dynamic filter has been added to help the trader avoid possibly entering against the trend. Two filter threshold lines may enable the trader to avoid choppy or flat market conditions. The Yellow indicator line is the filter and the Blue indica
Welcome to the world of advanced trading with the Parabolic SAR Scanner Full! Maximize your trading experience with our powerful MT4 indicator designed for seamless analysis and real-time insights. Key Features: Effortless Parabolic SAR Scanning: Unlock the full potential of the Parabolic SAR Scanner Full by effortlessly scanning multiple currency pairs. Receive instant alerts when specific Parabolic SAR conditions are met, ensuring you stay ahead of market movements. Comprehensive Dashboard In
Introduction: Welcome to the world of advanced trading tools! Introducing the CCI Multicurrency Scanner, an exceptional MT4 indicator designed to revolutionize your trading experience. With its powerful features and comprehensive insights, this tool will empower you to make informed decisions and maximize your profitability. Features: Efficient Multicurrency Scanning: Our CCI Multicurrency Scanner swiftly scans multiple currencies based on your inputs. Receive instant alerts when specific condit
FREE

*This is tradingview bot converted to mql4*
The UT Bot Alert Indicator is an advanced technical analysis tool designed to help traders optimize their trading performance. This innovative indicator is based on the proven UT Bot system, which utilizes multiple indicators to deliver accurate signals that can help traders make better decisions. The UT Bot Alert Indicator provides a range of features that can help you stay on top of market trends and capitalize on opportunities. Here are some of i
This indicator is mainly used to analyze future support and resistance levels for better trade analysis.
If the support level is effectively supported for many times, the market will break through the previous high point, and the effective trend breakout will be long.
After the down, the market cannot overshoot the pressure level for many times, and then goes down and breaks through the previous low price again, and the effective trend breaks through the short position.
When the marke

Thanks to this indicator, you can easily see the new ABCD harmonic patterns in the chart.
If the two price action lengths are equal, the system will give you a signal when it reaches the specified level.
You can set the limits as you wish. For example, You can get the signal of the price, which occurs in the Fibonaci 38.2 and 88.6 retracements, and then moves for the same length, at the level you specify. For example, it will alarm you when the price reaches 80% as a percentage.
In vertic
学习如何在MetaTrader AppStore上购买EA交易,MetaTrader平台的应用程序商店。
MQL5.community支付系统支持通过PayPay、银行卡和热门付款系统进行交易。为更好的客户体验我们强烈建议您在购买前测试EA交易。
您错过了交易机会:
- 免费交易应用程序
- 8,000+信号可供复制
- 探索金融市场的经济新闻
注册
登录