适用于MetaTrader 4的新技术指标 - 81

This indicators automatically draws the Support and resistances levels for you once you've dropped it on a chart. It reduces the hustle of drawing and redrawing these levels every time you analysis prices on a chart. With it, all you have to do is dropped it on a chart, adjust the settings to your liking and let the indicator do the rest. But wait, it gets better; the indicator is absolutely free! Get the new and improved version here: https://youtu.be/rTxbPOBu3nY Parameters Time-frame -> T
FREE

The principle of this indicator is very simple: detecting the trend with Moving Average, then monitoring the return point of graph by using the crossing of Stochastic Oscillator and finally predicting BUY and SELL signal with arrows, alerts and notifications. The parameters are fixed and automatically calculated on each time frame. Example: If you install indicator on EURUSD, timeframe M5: the indicator will detect the main trend with the Moving Average on this timeframe (for example the Moving

A new trend determination algorithm has been developed for this indicator. The algorithm with acceptable accuracy generates input signals and output levels. Strategy for trend trading, filtering and all the necessary functions built into one tool! The principle of the indicator’s operation is to automatically determine the current state of the market when placing it on a chart, analyze historical data based on historical data and display instructions for further actions on the screen to the trad

Индикатор MT4 для профессионалов. Задача индикатора - определить будущее поведение цены. Он определяет и рисует на графике: вершины и низинки волн в выбранном диапазоне цен линии прогнозируемых каналов на которых задерживается цена зоны вероятного горизонтального канала( флета) уровни Фибоначчи уровни на круглых значениях цены уникальные линии по вершинам волн. процент коррекции или импульса текущей и предыдущей волны время до окончания текущего бара. Принцип работы основан на разработанной но

Scalping Line is an advanced average that we created for use in our trading strategy. The essence of our trading strategy is to open a buy deal when the line is blue and the price drops below the line. Or open a sell deal when the price rises above the line, and the color of the line is red. Thus, we open deals when the price for a short distance goes in the opposite direction from the general trend. We close the deal when we get the minimum profit. We trade on the timeframe M30 or H1. Better to
Indicator for binary options and scalping in the forex markets recommended expiration time 1-2 candles time frames to M30 signals when a blue dot appears it is a buy signal when the red dot appears signals appear with a candle signals do not disappear the indicator is developed on an exclusive algorithm you will not find this anywhere It is recommended to avoid trading during strong news releases

IntradayMagic прогнозирует характер ATR и тиковых объёмов на 1 сутки вперёд. Индикатор не перерисовывается и не отстаёт. Используя Intraday Magic вы можете значительно повысить качество торговли и избежать излишних рисков. По его показаниям можно детектировать кризисные состояния рынка и моменты разворота тренда, уточнять моменты и направления входов. Это бесплатная ознакомительная версия ограничена символами (парами) включающими GBP. Никаких иных ограничений нет. Для других пар вы можете исполь
FREE

The indicator shows buy and sell signals. The " CounterTrend 4 " is designed to recognize profitable counter trend patterns from your chart. Features: The CounterTrend 4 is a Counter-Trend Trading with Simple Range Exhaustion System. Signals based on the daily trading range. The indicator calculates the trading range for the last few days and compare the price movements on short time intervals and generating short term reversal points. This is a leading indicator. It works on any instruments.
The brand new trading indicator using the TD Sequential strategy is presented by KING.Ai. This indicator were built base on the the theory of TD Sequential . TD Sequential difficult can by seen by human eye. Indicator can help to identical the pattern . KING.Ai Forex trader mainly use this strategy to "See Through" market . We do believe that it is a powerful method to predict reversal time of trend . Ross Hook were developed by Tom Demark, In the late 1970s he devised some indicators called
Pro Trade Signal Arrows is an indicator that generates trade arrows. It generates trade arrows with its own algorithm. Bu oklar alış ve satış sinyalleri verir. Gösterge kesinlikle yeniden boyanmıyor. Sinyalin verildiği nokta değişmez. Tüm grafiklerde kullanabilirsiniz. Tüm çiftlerde kullanabilirsiniz. Bu gösterge, giriş ve çıkış sinyallerini oklar ve uyarı olarak gösterir. When sl_tp is set to true, the indicator will send you the close long and close short warnings It tells you that you should
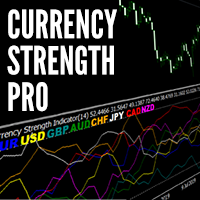
The Currency Strength Meter is the easiest way to identify the strongest and weakest currencies in the market. It works by applying clever calculations to 28 Forex pairs to establish which currencies are the driving force behind price action. By trading strength against weakness, we can greatly increase our chances of success and find some of the highest probability trends to trade. Technical Information
The strength meter uses the relative strength meter which is applied to all 8 major curren
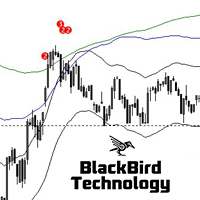
Multi MA Band Signal Indicator is a no-nonsense, no delay, no repaint indicator !
Moving Average bands together with a RSI filter is a 'simple', but very powerful and reliable signal.
Five "moving average bands" generate the signals. By default : MA25, 50, 100, 200 and 400. This can be changed in the parameters as well as the MA mode and the MA band deviation. The signal indicates the number of moving average bands that are crossed. The higher the value the stronger the signal. Two signal l
Trend Direction Estimation * Please use the free demo before renting or buying. This indicator works in all kinds of frames and presents you the trend in the time period you choose. This trial period (Rental for 1 month) offered for promotion is valid for a limited number of copies. At the end of the trial period, longer term rental and unlimited purchase options will also be opened in it's new prices. My expert advisor work is continuing for the strategies I have been developing for the Trend

Trend Direction Arrows * Please use the free demo before renting or buying. This indicator works in all kinds of frames and presents you the trend in the time period you choose. You can try to enter the bars in the bars where the arrows are formed or it helps you to understand the trend direction in the time period you look at. This trial period (Rental for 1 month) offered for promotion is valid for a limited number of copies. At the end of the trial period, longer term rental and unlimited pu

Fourteen plus nine What is it for? Applying Tom DeMark’s TD Sequential serves the purpose of identifying a price point where an uptrend or a downtrend exhausts itself and reverses. . What are the main components of TD Sequential? TD Sequential has two parts – TD Setup and TD Countdown. The first phase of TD Sequential starts with a TD Setup and is completed with a 9 count. When the 9 count is completed, it is at that point, a price pause, price pullback, or reversal is likely. It is also at tha

This is a small and simple indicator for MetaTrader 4. It displays necessary information for current symbol such as : Symbol name. Total of sell volumes (lots). Total of buy volumes (lots). Total profit or loss. Some properties of this indicator such as 'Font Size', 'Text Color', 'Position', etc are customizable for your best experience. Hope this indicator helps you succeed in your trade.
User Manual For more information pm me SL Currency28 Pair Dashboard is even used by the Banks to make profits. They take a strong currency and pitch against a weak currency This strategy i am made my other indicator SL Currency Strength Meter 28 Pair more improvement We can easily study the financial strength of multi-faceted trading SL Currency28 Pair Dashboard strength meter which creates multiple charts in a single window based on the price action of each currency in relation to
考虑到一个效率因素和 CCI + RSI + MA,结果是一个高概率的交叉。 基于上述因素,每个交叉点都可以被视为“Delta”。 随意根据自己的喜好进行调整。这不是一个“神奇”的指标,而是另一个帮助确认信号的工具。 参数 CCI期间 RSI周期 MA期间 系数(0 到 8) 绘画风格
彩色主线 彩色信号线 线宽(1 到 5) 显示穿过主/信号的箭头 显示穿过主要/级别的箭头 看涨箭头颜色 看跌箭头颜色 箭头宽度(1 到 5) [交叉线] 警报 [交叉线] 电子邮件 [交叉线] MQID Push 【主线过关】警报 【主线过关】邮箱 【主线过关】MQID Push 该产品仅在 MQL5.com 上出售。在其他网站上销售是非法的。 我所有的产品/信号: https://www.mql5.com/en/users/mike_explosion/seller#products
它以更友好和易于理解的方式显示买家和卖家的数量。这样我们就可以更准确地判断是空头还是多头赢了。 我们事先研究了一些行为模式,但本质上我们在做决定时会支持自己。此外,如果我们已经在市场中,我们可以确认趋势变化是否正在逼近,从而在变化之前退出。 参数 绘画风格 买家数量颜色 卖家体积颜色 宽度(1 至 5) 该产品仅在 MQL5.com 上出售。在其他网站上销售是非法的。 我所有的产品/标志: https://www.mql5.com/en/users/mike_explosion/seller#products 免责声明: 我永远不会忘记,过去的表现并不能保证未来。我总是建议先在一个非常低风险的模拟账户或真实账户上运行,以更好地了解 EA 如何执行交易并获取您的利润和损失。这是为了防止恐惧情绪在交易过程中控制您。了解系统如何工作以及有哪些起伏是非常重要的。这是一个专业的商业策略。这不是一个快速致富的计划,因此会不时需要损失以保护帐户。遵循我的指导方针,永远不要冒险失去超过心理舒适度的损失。学会接受外汇损失并保持耐心。这是在游戏中获利的唯一途径。
Scalp SWING indicator.
It works on any time frame and Instruments
It works on trending and ranging markets.
The signals are robust and does not repaint.
The system is robust and requires no supporting indicator.
You don’t need any multiple indicators to trade the markets.
The alerts/ notifications can be enabled to gain prompt entries.
The entries are at Top and Bottom of Trend Cycles
It is Very accurate and robust system- yet extremely simplified tools for the pro traders.
Sc

Henry - An indicator by which you can determine the levels and trend. The indicator calculates the saturation levels of the price chart. A signal to exit the resale area is a buy signal. A signal to exit the overbought area is a sell signal. Usually, you need to set relative values for the overbought and oversold levels of Bottom and Top - for this indicator.
Most often, a good trend is visible on the price chart visually. But an experienced trader must clearly understand the current balanc

Are you tired of the constant ups and downs? It is not worth becoming a victim of unstable market movements, it is time to somehow get rid of it! Already now, you can use Business Trend solutions to balance the analysis of price movements and get a clearer picture of price behavior.
Business Trend is a trend indicator for the MetaTrader 4 trading platform. This indicator allows you to find the most likely trend reversal points. You will no longer find a copyright indicator like this. A simple
---> Check all the other products <---
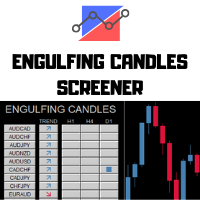
The Engulfing Candles Screener is a deeply customizable dashboard.
You can chose a trend filter, using 2 EMAs, with custom periods applied on a custom TimeFrames Then you can choose 3 timeframes to search, any TimeFrame is suitable and the screener will find the engulfing candles in the selected timeframe. 3 Timeframes to scan All the major forex pairs and crosses - up to 28 symbols Deeply Customizable
How to setup the screener:
Let the crosses v

The trader uses the Trend for Neuro indicator to determine the market situation. This is a trending algorithm that is convenient to download, install and use. The algorithm with acceptable accuracy generates input signals and output levels. Strategy for trend trading, filtering and all the necessary functions built into one tool! By launching the indicator, the user will see only two types of arrows that can change color to blue during an uptrend, to red during a downtrend there is no uncertaint

The Perspective Trend indicator tracks the market trend with very high reliability. All intersection points will be ideal points at which the direction of the trend changes. Sharp price fluctuations, as well as noise around averaged prices, are ignored. Signal points, places where color changes, can be used as points of potential market reversal. The indiuctor algorithm implements a kind of technical analysis based on the idea that the market is cyclical in nature. This development can be used b

With this indicator, you can easily make price regions in all time zones. In addition, with the automatic supply demand finder, you can ensure that the new regions are found automatically. You can increase your transaction quality by reaching more accurate operations with this auxiliary Tool and indicator.
I share your trial version of EURUSD for free with you. If you want to buy the working version in all parities, you can contact me. +New version Gap Bar Add ( Press G keyboard ) Default co
FREE

Ultimate pattern builder indicator
Allows you to build any pattern with up to 3 candlesticks (+ special fourth). This indicator is special because you can create any pattern you want, by modifying body and both wicks separately to your needs. If you ever wanted to create your own patterns , or just adjust any known popular pattern, then this is perfect for you. With this indicator you can learn how to build candles, testing it in strategy tester and get marked new candles on realtime charts, h
FREE

IntradayMagic predicts the nature of ATR and tick volumes for 1 day ahead. The indicator does not redraw and does not lag behind. Using Intraday Magic, you can significantly improve the quality of trading and avoid unnecessary risks. According to its indications, you can detect the crisis state of the market and the moments of trend reversal, specify the moments and directions of entries. How the indicator works Periodic events, exchange schedules, Bank schedules, expirations, and other similar
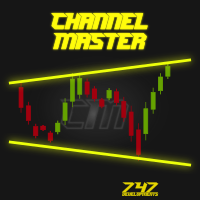
Channel Master is unique indicator for automatic channel finding. This indicator is fully adjustable by user. User can also put more instances of Channel Master to one chart with different channel size for better trend filtering. To find more information visit the 747Developments website. Features
Easy to use (just drag & drop to the chart) Fully adjustable Accessible via iCustom function Possible to use with any trading instrument Possible to use on any time-frame

The indicator shows key volumes confirmed by the price movement.
The indicator allows you to analyze volumes in the direction, frequency of occurrence, and their value.
There are 2 modes of operation: taking into account the trend and not taking into account the trend (if the parameter Period_Trend = 0, then the trend is not taken into account; if the parameter Period_Trend is greater than zero, then the trend is taken into account in volumes).
The indicator does not redraw .
Settings Histo
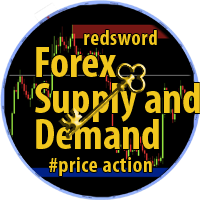
With this indicator, you can easily make price regions in all time zones. In addition, with the automatic supply demand finder, you can ensure that the new regions are found automatically. You can increase your transaction quality by reaching more accurate operations with this auxiliary Tool and indicator.
I share your trial version of EURUSD for free with you. If you want to buy the working version in all parities, you can contact me. +New version Gap Bar Add ( Press G keyboard ) +Redsword
The indicator is designed for Forex Markets. The algorithm is based on Moving average and a few filters. When to enter into transactions The blue arrow is a buy signal. The red arrow is a sell signal Recommended options are set by default. -------------------------------------------------------- You can use Moving average to filter signals. Period 30 Method linear Weighted Apply high You can also use Alligator, Bollinger bands, RSI.
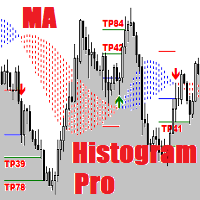
MA Histogram Pro is an expensive version of the indicator. It is equipped with the second Take Profit (TP) and is more equipped ( has a positive optimization method) than its cheaper brother. Simple and effective system with automatic optimization. See my forecasts .
MA Histogram are used primarily as trend indicators and also identify support and resistance levels.
Equipment:
Take Profit 1 Take Profit 2
Stop Loss Automatic optimization Result R/R Consecutive losses

No idea why demo is not working. you can check the GIF to see how it works.
Features With this scanner you can detect Candles which are below/above yesterday high/low lines. A pair's rectangle turns RED in dashboard if it is above the yesterday high, and rectangle turns GREEN in dashboard if it is below the yesterday low. It gives alerts in every 15m candle close. Contains a Dashboard which will help you to see all market pair's. It is possible to disable this sorting through to make it easie
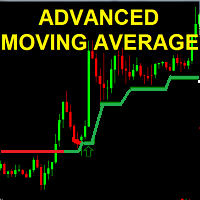
the Advanced MOVING AVERAGE indicator This is a formula of moving average based on support and resistance levels Two Colors indicator : UP trend --> Green Down trend -->Red Arrows UP/Down are shown for trend reversal indication ALERTS and mobile Push NOTIFICATIONS Simple Strategy : BUY on price over new green line Sell on price under new red line
Works on any TIMEFRAME MAin Input for calculation : index = 20.. 50..100..500 ... 1000 (Lower time frame -> Hi

The indicator displays 05 important parameters for traders 1. Display Bid -ASK price in big font 2. Display currency pair name and large time frame 3. TradeTick parameters 4. Swaplong and SwapShort 5. Point parameters used to calculate the price of SL or TP Indicators include 02 files supporting MT4 and MT5, You can download the link below. And follow the instructions of the video.

This indicator supports fast drawing of trendlines 1. Support drawing the next peak higher than the previous peak 2. Support drawing the lower peak after the previous peak 3. Support drawing the lower bottom of the bottom. 4. Support to draw the lower bottom higher than the previous bottom. 5. Support drawing trendline across the price zone. Peak connected vertex 6. Support drawing trendline across price range. Bottom connected Link to download and use for free. Including 02 files s

High-accuracy trend indicators, please use in 1H timeframe,Try not to use it in other cycles,Can be used on any currency pair. This indicator is a trend indicator, which can accurately judge the trend. Can be combined with other indicators to increase accuracy. Can be used as a good entry point, will continue to optimize if you have any questions, please contact the author.
LINEAR QUADRATIC ESTIMATION OF VELOCITY OSCILLATOR Linear quadratic estimation (LQE) is an algorithm that generates predictions of unknown variables observed over time using statistical noise and other inaccuracies and predicts a single measurement more accurately than those based on it. linear quadratic estimation of velocity oscillator shows trend. You can use this oscillator all pairs and on all timeframes. Better results are H1 and H4.

Kalman Filter Velocity Oscillator Kalman filter is an algorithm that uses a series of measurements observed over time, containing statistical noise and other inaccuracies. The filter was originally designed to work with noisy data. Also, it is able to work with incomplete data. Another advantage is that it is designed for and applied in dynamic systems; our price chart belongs to such systems. This Oscillator works all pairs, all timeframes, on separete windows and zero based oscillator.

TWO PAIRS SQUARE HEDGE METER INDICATOR Try this brilliant 2 pairs square indicator It draws a square wave of the relation between your two inputs symbols when square wave indicates -1 then it is very great opportunity to SELL pair1 and BUY Pair2 when square wave indicates +1 then it is very great opportunity to BUY pair1 and SELL Pair2 the inputs are : 2 pairs of symbols then index value : i use 20 for M30 charts ( you can try other values : 40/50 for M15 , : 30 for M30 , : 10 for H1 ,

OscillatorMotion - индикатор выполнен в виде осциллятора и показывает направление движения цены. Для удобства пользования и более точной настройки индикатора можно изменять период, количество предыдущих свечей или баров, которое индикатор берет для анализа. Так же есть функции alert и push-уведомлений. Индикатор работает на любой валютной паре и на любом таймфрейме. Входные параметры: period - количество предыдущих баров для анализа AlertSignal - включить функцию да/нет PushSignal - включить фун

MostTransactions - индикатор анализирует какие транзакции преобладают на рынке в данный момент покупки или продажи. Как правило если большинство трейдеров продает, то цена идет вверх, если преобладают покупки, то цена идет вниз. Таким образом крупные игроки заставляют обычных трейдеров терпеть убытки. Этот индикатор призван решить данную проблему. Если количество сделок на покупку превышает определенное среднее значение, то на графике появляется зеленая точка и следует ожидать движения вниз, есл
Quants 移动平均线斜率是非常强大的指标,可以提供方向指示和动量。 指标不重绘。您可以有效地计算 ma 角度并找到趋势。
一旦信号蜡烛关闭,利润计数就开始了。 所以它是在现场的确切结果。
建议的 TimeFrame 在 H1 上使用它。 指标的所有选项都是可编辑的。
提示:交易摆动和趋势突破方向。 分形、砖形柱和博林格带可以提高准确性和盈利能力。
使用角度线的发散方法可能会发现高点和低点。 该指标可用作支撑阻力、供需指标的额外确认。
Ma 斜率信息对于以趋势方向进入并具有退出点非常有用。 它适用于外汇、股票、指数。
您可以通过 PushNotifications / Email / SoundAlerts / PopUpAlerts 发出警报。
如果需要任何改进,您可以随时告诉我。
此致,
数量
Description
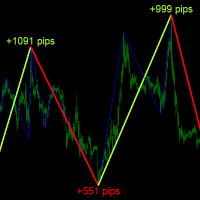
ABC Trend Detector is an indicator that identifies impulses and trends in the market and displays their presence on the price chart. Found patterns are drawn as colored connecting lines between their highs and lows. Above / below each extreme, the value of the range (the number of pips) of the trend is displayed.
Recommendations
You can use this indicator to determine the trend and, accordingly, to determine the direction of opening a position or closing an opposite positi
Description
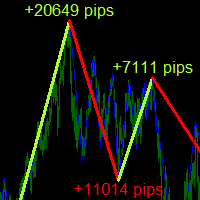
ABC Trend Detector Pro is an indicator that identifies impulses and trends in the market and displays their presence on the price chart. Found patterns are drawn as colored connecting lines between their highs and lows. Above / below each extreme, the value of the range (the number of pips) of the trend is displayed.
Recommendations
You can use this indicator to determine the trend and, accordingly, to determine the direction of opening a position or closing an opposite posit

This system never paints. This system uses 30 standard MT4 indicators. This indicator is only working in M5 period. This system is for long term and profitable. Signals are shown as arrows. as an optional limit orders. You can set a voice alarm or email notification. You can fins our other products from link : https://www.mql5.com/en/users/drbastem/seller Also, you can ask all your questins from email : haskayafx@gmail.com or mobile : +90 530 867 5076 or @MehmetBastem on teleg

T his system never paints. This system created by using Calculates the Standard Deviation indicator. This indicator is only working in M1 period. This system is for short term and profitable. BUY and SELL Orders Target is 30 Pipes. When the Market Order Reaches the Target or an order in the Reverse Direction is opened, the Pending Limit order is Closed. Signals are shown as arrows. as an optional limit orders. You can set a voice alarm or email notification. You can fins our

FBO Trend Admiral is a professional yet simple to use trend following system. It detects the prevailing trend and gives entry points as arrows. To determine the trend it uses a unique filtering algorithm. Suitable for defining entry points for scalping as well as for intra-day trading. Features Works with the prevailing market trend. Suitable for all markets (currency pairs, metals and indices). Ideal for short time trading on the M1, M5 and M15 time frames. Does not redraw/repaint the arrows
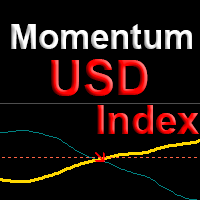
The indicator shows points for the continuation of the trend for currency pairs with the participation of the USD dollar with a probability of more than 80%. The algorithm is based on comparing the momentum of the current currency pair with the momentum of the DX dollar index at the current time. Using the dollar index allows us to evaluate not only the current pair, but the entire picture for all major currencies at once. This approach increases the reliability and reduces the number of false p

The ADX Indicator is known to be used to determine the trend direction. Not only that, but it also has deviation (+DI and -DI) that determine the direction of the trend as well. The role of the indicator is to spot the trend and its direction and generate signals accordingly.
Indicator Settings: - ADX period : default is 14 periods (it works best with the timeframe H1). - Signal Width : the size of signals arrows. - Signal Distance : the distance of the signal arrow from the candle. - Signal c
FREE
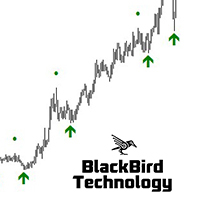
Multi Level Trend Swing is an indicator that identifies the most accurate buy/sell swing points with the highest probability, based on multi-level Zig Zag Swings. The indicator paints arrows at the Higher Highs, Higher Lows, Lower Lows and Higher Lows in the chart, but based on two level Zig Zag Swing. If the fast price swing is in line with the trend of the slow price swing, then the buy/sell arrows are biggest. If the price swing is against the trend, dots are displayed to signal a Higher High

TREND MATE is an useful indicator that will support your decision to trade according to the current trend. It is possible to configure alert and push notification to receive when entering to first candle for bull / bear trend. If you want to use this indicator for a EA, use the function iCustom as follows:
DOWNTREND : iCustom(NULL,0,"Trend_Mate",0,0) . If downtrend result is "1", otherwise is "0".
UPTREND : iCustom(NULL,0,"Trend_Mate",1,0) . If uptrend result is "1", otherwise is "0".
Fo
FREE

Stochastic BR allows you to recognize reversals professionally. The "Stochastic BR" is designed to recognize profitable counter trend patterns from your chart. Stochastic Indicator: This technical indicator was developed by George Lane more than 50 years ago. The reason why this indicator survived for so many years is because it continues to show consistent signals even in these current times. The Stochastic indicator is a momentum indicator that shows you how strong or weak the current trend

Nexxt2 Indicator This indicator shows you trend and also how strenght it is together. You can use this indicator for your own experts with iCustom() BlueBuffer is in the buffer ( 0 ) and GoldBuffer is in the buffer ( 1 ) Strategy can be like this; Blue and Gold cross till Blue touch to level 1 or -1. These levels show us must be ready close position. It depends on you. there are afew parameters for using this indicator on different currencies and different time frames. Best Results are in H4 (

This EA is an extension for the free trade indicator Trend Mate . https://www.mql5.com/en/market/product/50082
The main idea is to support your decision to trade according to the current trend. It is possible to configure alert and push notification to receive when entering to first candle for bull / bear trend.
For this extension of the free indicator now it is possible to filter the current trend info with other timeframes. For example show trend for timeframe M5 considering also timefra
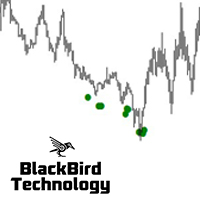
Multi MA Distance Signal Indicator is a no-nonsense, no delay, no repaint indicator ! Moving Average distance together with a trend filter is a 'simple', but very powerful and reliable signal. The current moving average distance for both a slow and a fast moving average is compared with the past MAD values. For two moving averages, all the distances between the Close price and the moving average (MAD) over a selected period of time are compared with the current MAD "Moving Average Distance". If

Fibonacci fast drawing tool with 4 outstanding features 1. Quick action by clicking on the candle 2. Draw the bottom of the selection exactly 3. Include Standard Fibo levels and display prices at levels 4. Draw extended fibo to identify the price zone after break out
Please see video clip below for more details. Free download link of FiboCandleClick indicator inside youtube.
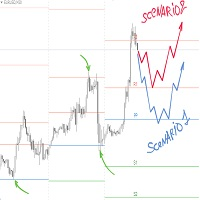
Pivot Point is a technical tool widely used by traders to predict major support and resistance price levels by calculating previous history and to predict the current price reversal points. Traders want to determine about the swing point from which there should be much possibility that the market price will be getting back, in such analysis pivot point plays an important rule. Different site explaining the logic of pivot point as:
A technical analysis indicator used to determine the overall t

1、能显示货币之间的强弱 0是最弱 7是最强 2、能显示28个货币以及黄金 原油的 涨跌幅度 3、能切换货币对 4、能显示持仓订单的货币对 1、能显示货币之间的强弱 0是最弱 7是最强 2、能显示28个货币以及黄金 原油的 涨跌幅度 3、能切换货币对 4、能显示持仓订单的货币对 5、能利用键盘的的上下键切换货币对,左右键切换周期 1、能显示货币之间的强弱 0是最弱 7是最强 2、能显示28个货币以及黄金 原油的 涨跌幅度 3、能切换货币对 4、能显示持仓订单的货币对 5、能利用键盘的的上下键切换货币对,左右键切换周期 5、能利用键盘的的上下键切换货币对,左右键切换周期 1、能显示货币之间的强弱 0是最弱 7是最强 2、能显示28个货币以及黄金 原油的 涨跌幅度 3、能切换货币对 4、能显示持仓订单的货币对 5、能利用键盘的的上下键切换货币对,左右键切换周期
FREE
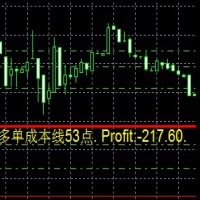
Dies ist ein Indikator
Dies ist ein Indikator, der immer die Auftragskosten und die Rentabilität in Echtzeit widerspiegelt
Besonders wenn es auf die Martin-Strategie angewendet wird, ist es bequemer 这是一个指标
这是一个时时反应订单成本 和实时 盈利值得 指标
尤其应用于 马丁策略的时候 更加方便 This is an indicator
This is an indicator that always reflects the order cost and real-time profitability
Especially when applied to the Martin strategy, it is more convenient
FREE

THIS IS DEFINITELY THE BEST INDICATOR ON THE MARKET Please book an appointment on our facebook page (www.facebook.com/wetrainfx)
Fantastic for scalping, swing trading and Intra-day tradering Arrows show direction ! You also get an early warning that a move is about to happen.
Mobile and desktop alerts.
Effective on any traded pair
Effective on any timeframe.
Perfect for new and old traders
THIS IS THE MT4 VERSION.
HOW TO USE 1. Open a few charts in 15min TF. 2.

FREE DOWNLOAD Understanding Support & Resistance Support and Resistance are critical levels used by market participants in making decisions. This level is used to determine whether the price will continue or reverse direction. If this Support and Resistance is combined with candlestick forms, it is believed that it will be able to determine the next movement. Economic support can be interpreted as a level where supply begins to decrease and demand increases so that if that happens, prices will

Place price Alerts on extended Rectangles and Trendlines - Risk reward indicator mt4 Extend Rectangles & Trendlines to the right edge Mark your supply demand zones with extended rectangle and draw support resistance lines with extended trendline. Find detailed manuals here . Find contacts on my profile . MT4 Rectangle extender indicator will simplify and make it easier for you to analyze markets and stay notified about important events. When you extend rectangle or trendline the action bu

你缺乏成为专业人士的优势。
按照一步一步的系统,检测最强大的动作!
研究市场模型,让您有机会根据经过验证和测试的策略赚取可观的利润。
利用你的重要优势 您可以访问一个独特的指标,将带您到一个新的水平!
在私人信息中写下所有问题!
你得到的好处 基于价格变动的独特算法。 与任何交易策略完美结合。 自动检测波浪和趋势。 信号是严格在"关闭酒吧"。 它适用于所有符号和时间框架。 与自动交易(EA)完全兼容。 该指标分析了先前价格走势的强度。
基于此,指示器显示一个黄色条以指示入口点。
进入是在第二根柱上做的,这是趋势运动的逆转.
111111111111111111111111111111111111111111111111111
FREE

这个多时间框架和多品种指标识别分形模式。作为奖励,它还可以扫描抛物线 SAR (pSAR) 趋势变化。结合您自己的规则和技术,该指标将允许您创建(或增强)您自己的强大系统。 特征
可以同时监控您的市场报价窗口中可见的所有交易品种。仅将指标应用于一张图表并立即监控整个市场。 可以监控从 M1 到 MN 的每个时间范围,并在识别出模式或趋势变化时向您发送实时警报。支持所有 Metatrader 原生警报类型。 可以使用 RSI 和/或移动平均线作为趋势过滤器来正确识别潜在的逆转。 该指示器包括一个交互式面板。当单击一个项目时,将打开一个带有相关代码和时间范围的新图表。 该指标将信号写入一个文本文件,智能交易系统 (EA) 可以使用该文件进行自动交易。比如 这个产品 。 您可以在博客中 找到有关文本文件的内容和位置的更多信息。
输入参数
输入参数的描述和解释可以在 这里 找到。 重要的
请注意,由于具有多功能性,既不会在安装指标的图表上绘制买卖建议,也不会绘制线条和箭头。图表上将绘制一个显示分形图案的箭头,点击面板中的信号即可打开图表。 我建议您将指标放在干净(空)图表上,不

TWO SYMBOLS CORRELATION line indicator It compares the power/strength lines of two user input symbols and create a SMOOTHED line that indicates the degree of deviation of the 2 symbols Strategy#1- FOLLOW THE INDICATOR THICK LINE when CROSSING O LEVEL DOWN --- TRADE ON INDICATOR THICK LINE (TREND FRIENDLY) !! Strategy#2- TRADE INDICATOR PEAKS (Follow indicator Reversal PEAKS Levels)!! you input - the index of calculation ( 10/20/30....) - the indicator Drawing start point (ind

El MACD ponderado, tiene las mismas caraterísticas del MACD simple, sólo que la diferencia es que se usan medias móviles ponderadas (LWMA) en lugar de simples (SMA) o exponenciales (EMA). Dibuja histograma. Dibuja una línea principal. Es especialmente útil para detectar divergencias alcistas y divergencias bajistas. También es muy útil para detectar divergencias alcistas y divergencias bajistas ocultas.
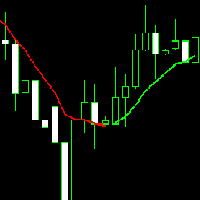
Linear Weighted Moving Average o Media Móvil Ponderada Lineal, es una media móvil que calcula los promedios de manera ponderada. Esta versión, además de las características regulares que poseen las demás Linear Weighted Moving Average o Medias Móviles Ponderadas Lineales, tiene también la propiedad de cambiar de color según las preferencias del usuario; puedes elegir un color para cuando la media móvil sea alcista y otro color cuando la media móvil sea bajista, o de lo contrario se puede elegir
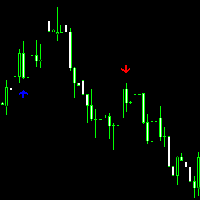
Este es un indicador que te avisa mediante flechas, cuando las medias móviles ponderadas (LWMA) de los periodos que hayas elegido, se crucen entre sí. Puedes elegir el color que quieras para cada una de las flechas, incluso puedes elegir un sólo color para las dos flechas. Cuando hay un cruce de medias alcista, sale una flecha hacia arriba, y cuando hay un cruce de medias bajista, sale una flecha hacia abajo. Como comenté al inicio, también puedes elegir el periodo de cada media móvil ponderada
MetaTrader市场提供了一个方便,安全的购买MetaTrader平台应用程序的场所。直接从您的程序端免费下载EA交易和指标的试用版在测试策略中进行测试。
在不同模式下测试应用程序来监视性能和为您想要使用MQL5.community支付系统的产品进行付款。
您错过了交易机会:
- 免费交易应用程序
- 8,000+信号可供复制
- 探索金融市场的经济新闻
注册
登录