SMT Divergence SMC MT4
- 指标
-
Ravi Shakya
 I’m Ravi Shakya, an MT5 developer with 5 years of trading experience in NEPSE and Forex. I use Smart Money Concepts (SMC) and price action to create simple and useful trading indicators, tools, and Expert Advisors.
 - 版本: 2.12
- 激活: 10
SMT Divergence Multi Pair compares the swing highs and swing lows of the chart symbol with up to two correlated symbols and marks the places where they disagree. This is the Smart Money Technique (SMT) divergence used in ICT and Smart Money Concepts analysis: one market moves beyond a previous high or low while its correlated market does not confirm the move.
How it works
The indicator finds confirmed swing highs and swing lows on the chart symbol and compares each new swing with the previous one. At the same moments in time it reads the swings of the comparison symbols. A small bar tolerance window is used, so swings that form one or two bars apart on different symbols are still matched.
Regular SMT
- Bearish: the chart symbol makes a higher high, the comparison symbol makes a lower high.
- Bullish: the chart symbol makes a lower low, the comparison symbol makes a higher low.
Hidden SMT
- Bearish: the chart symbol makes a lower high, the comparison symbol makes a higher high.
- Bullish: the chart symbol makes a higher low, the comparison symbol makes a lower low.
You can display regular SMT, hidden SMT or both.
Automatic pair selection
In Auto mode the comparison symbols are selected from the chart symbol. Supported groups are forex majors and crosses, metals (gold, silver, platinum, palladium), energy (WTI and Brent), stock indices (US500, NAS100, US30, US2000, GER40, EU50, FRA40, UK100, JP225) and crypto (BTC, ETH, SOL).
Broker symbol names are detected automatically, including suffixes and prefixes such as EURUSDm, EURUSD.raw or US500.cash. Symbols that move in the opposite direction, for example EURUSD and USDCHF, are handled automatically. In Custom mode you can enter any two symbols and mark each one as inversely correlated.
Trend filter
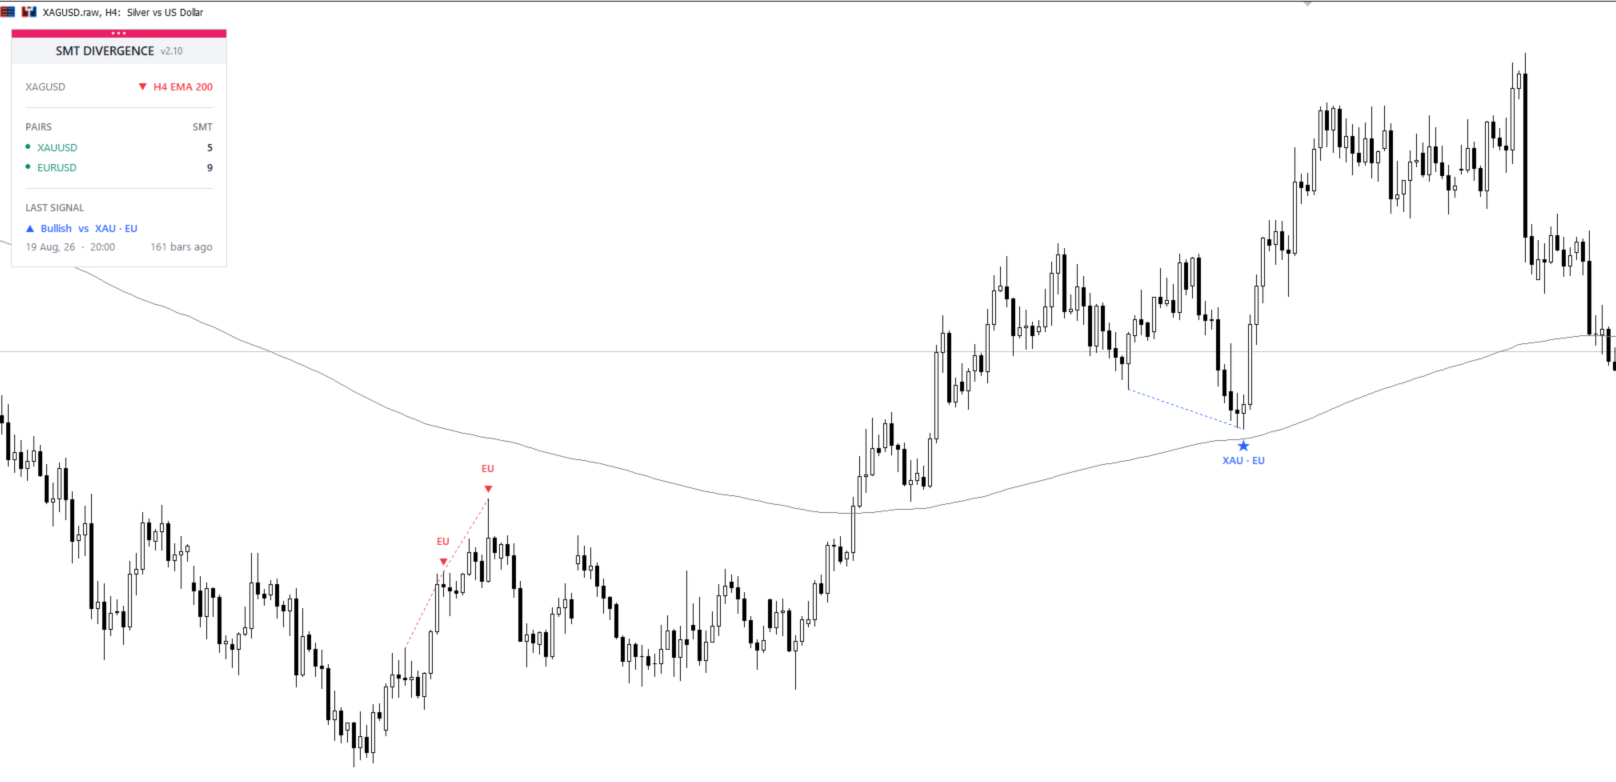
An optional 200 EMA trend filter shows only SMT signals in the direction of the trend: bullish signals when price is above the EMA and bearish signals when price is below it. The EMA can be calculated on the chart timeframe or on a higher timeframe, and it can be plotted on the chart. The trend is read from the last closed bar, so the filter result does not change after a signal appears.
Chart display
- A filled triangle marks a regular SMT with one comparison symbol.
- A filled star marks a regular SMT confirmed by both comparison symbols.
- Outlined triangles and outlined stars mark hidden SMT.
- Lines connect the two compared swings, dotted for regular and dashed for hidden.
- Labels show which symbols diverged, in short or full form.
To keep the chart clean, you can choose how many of the most recent signals are shown.
Dashboard
A compact panel shows the current trend, the comparison symbols with their status and number of signals, and the most recent SMT with its date, time and number of bars since it formed. The panel can be moved by dragging its header, its position is saved for each chart, and it switches between a dark and a light theme to match the chart background.
Alerts
Popup alerts and push notifications are available for new SMT signals. Each type of event can be switched on or off separately: bullish, bearish, regular, hidden, and signals confirmed by both symbols only. Alerts are sent only for new signals, not for signals found in history.
Signal timing
A swing is confirmed after the number of closed bars set in "Pivot right strength" (3 by default). Signals are calculated on closed bars only, so a signal is not redrawn after it appears.
Input parameters
Swing detection: pivot left and right strength, maximum bars between compared swings, comparison window tolerance, bars of history to scan and SMT type.
Comparison symbols: pairing mode (Auto or Custom), symbol names and inverse correlation settings.
Trend filter: on or off, trend timeframe, EMA period, EMA display and colour.
Display: colours, marker size, label style, swing lines and number of signals shown.
Dashboard: show or hide, start position, theme and chart grid visibility.
Alerts: popup and push notifications, and the event types that trigger them.
Notes
The comparison symbols must be available from your broker. The dashboard shows when a symbol is not found, and Custom mode lets you enter the exact names from Market Watch. On the first load the indicator waits for the history of the comparison symbols before it calculates.
SMT divergence is an analysis tool that highlights a market condition. It does not guarantee any trading result and should be used together with your own analysis and risk management.