 MetaTrader 5
 专家
专家
 指标
指标
 程序库
程序库
 实用工具
实用工具
 窗口小部件
窗口小部件
 规则
规则
适用于MetaTrader 4的新技术指标 - 120
 下面列出的技术指标信号对MetaTrader 4平台的开仓交易和平仓交易起着至关重要的作用。
指标的本质就是一种交易品种的数学转换,旨在预测价格变化。
下面列出的技术指标信号对MetaTrader 4平台的开仓交易和平仓交易起着至关重要的作用。
指标的本质就是一种交易品种的数学转换,旨在预测价格变化。 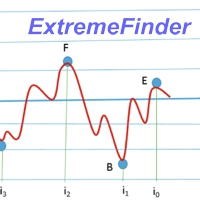
Description:
ExtremeFinder analyze chart and find local extremes - maximum and minimum. Searched extreme is always of opposite type then previous. Local extreme is confirmed when price difference is higher then set price difference, but not sooner then after set number of candles. Two different types of Local extreme confirmation are performed: Normal for common Price changes, Quick for steep Price changes. Price difference to confirm local extreme can be set as absolute value, in percent of lo
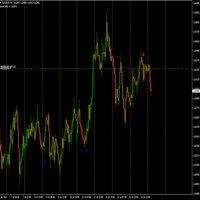
This indicator what the name says! it captures the biggest moves weekly on the 4 hour tine frame. This indicator can be used on any pair and any time frame but the 4 hour is most reliable. It works best before high impact news releases, check forexfactory.com to get when high impact news releases are happening. Its simple to use, just trade when you see the arrows appear.

本指标是实践实战交易完善的波浪自动分析的指标 ! 案例...
注: 波浪分级用西方叫法不习惯,因受到缠论(缠中说禅)命名方式习惯的影响,我是将基础波浪命名为 笔 ,将二级波段命名为 段 ,同时具有趋势方向的段命名为 主趋段 (以后笔记中都是这种命名方式,先告知大家),但是算法上和缠论关系不大切勿混淆.反映的是本人分析盘面总结的 千变万化纷繁复杂的运行规律 .
对波段进行了标准化定义,不再是不同人不同的浪 , 对人为干扰的画法进行了排除,在严格分析进场起到了关键的作用 .
使用这个指标,等于将交易界面提升美感,抛弃最原始的K线交易带你进入新的交易层次.如果不是为了交易,在宣传上也将使客户观感提升层次. 指标内容: 1. 基础波浪 (笔) : 首先我们找出了价格波动过程中的基础波动拐点,当然他的有序性低,为下一步的计算提供基础. 2. 二级波段( 段 ) :在基础波浪的基础上,通过算法分析得到层级更明显的二级波段,二级波段为波浪提供了分析基础 3. 波浪( 浪 ): 有着更清晰的趋势,更清晰直观的方向.分析一个波浪是否延续,需要看二级波段的形态,分析二级的构成,可以得出波浪

The indicator is created using a unique algorithm that has no analogues. Based on the calculations, the contract price itself and the percentages displayed in it are calculated, which are displayed in the indicator in the form of histograms in two drawing options, as well as in six options for displaying prices on a chart in various combinations, which allows you to accurately see the interest of all trading participants in the form of drawing levels support and resistance. Trading decisions can

The Magic Arrow Scalper sorts out low-probability signals in a trading strategy. The indicator uses a sophisticated filtration algorithm based on the market sentiment and trend. The indicator displays arrows on a chart (see attached screenshots) indicating a likely price reversal. Magic Arrow Scalper is not repainted. Once the candle is closed, a signal is confirmed and will never disappear from a chart. You can setup alerts when new arrows are displayed on a chart. The indicator is not des
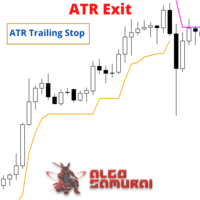
The ATR Exit indicator uses the candle close + ATR value to draw trailing stop lines (orange under buys, magenta over sells) that advance with the trend until the trend changes direction. It uses a multiple of the Average True Range (ATR), subtracting it’s value from the close on buy, adding its value to the close on sell. Moreover, the trailing stop lines are generated to support the order’s trend direction (long or short): In an upward trend, the long trailing stop line (orange line under bu
FREE

The indicator of the indicators. The Most Powerful Technique to Determine Forex Trend Strength in 2023. We have perfected Supreme Commander that it calculates an average of the selected indicators (up to 16) and the selected timeframe (all) with the result of a single trend that indicates the potential of buying and selling. It includes the following indicators:
Accelerator/Decelerator oscillator Average Directional Movement Index Awesome oscillator; Bulls and Bears Commodity Channel Index; De
The Icarus Reversals(TM) FREE Indicator is a powerful tool to identify high-probability reversal points, across all instruments. The Reversals Indicator provides traders and investors with a simple-to-use and highly dynamic insight into points of likely price-action reversals. Generated by a unique proprietary code-set, the Reversals Indicator (FREE version) generates long and short trade signals, which can be customised for key inputs and colourisation. Settings of the Icarus Reversals FREE h
FREE

Watch the Clock shows a clock at a desired position. The clock is useful if you want to check when a candle closes. You can also set an alert to be prepared before the news.
️ Watch the Clock works also in the strategy tester.
️ Watch the Clock requires a minimum of CPU power.
️ Watch the Clock can improve your manual style of trading.
Inputs Alert -> At which time should the alert occur? Time Shift in Minutes -> Should the time be incremented by x minutes? Size -> The font size of the tim
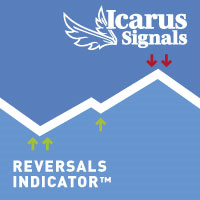
The Icarus Reversals(TM) Indicator is a powerful tool to identify high-probability reversal points, across all instruments. The Reversals Indicator provides traders and investors with a simple-to-use and highly dynamic insight into points of likely price-action reversals. Generated by a unique proprietary code-set, the Reversals Indicator generates long and short trade signals, which can be customised for all inputs, allowing for the complete optimisation fitted to any trader or investor style
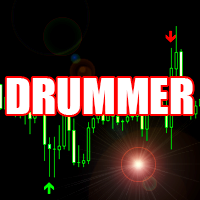
The leading indicator calculates the most likely places for a trend reversal or stop.
An example of use is shown on the screenshot using the ChainVector trading panel ( https://www.mql5.com/en/market/product/49155 ).
Support: https://www.mql5.com/en/channels/TrendHunter This indicator can be used as a stand-alone trading system or as an additional part of another trading system. Support : https://www.mql5.com/en/channels/TrendHunter
More products are available here: https://www.mql5.com/en

Check out other great products from https://www.mql5.com/en/users/augustinekamatu/seller
This indicator finds the entry points based on divergences of common indicators and does not repaint . The principles used ensure that it can be used on CFDs, Commodities and Stock with incredibly great results. With proper money management and portfolio balancing the Indicator can be applied to any trading strategy to generate consistent profits. A Winning Trading Strategy This article describes the com
FREE

This is a complete HiLo activator indicator. A trend guide indicator capable of signaling when the trend is changing, thus ensuring greater assertiveness in the entries. For the periods M30, M15 and M5 we recommend the setup: HiLo Periods 27, MA Method Exponential. For H1 or above, we recomend the setup: Hilo Periods 13, MA Method Smoothed. -- Periods Control -- MA Smoothing Type Control -- MA Line Width Control
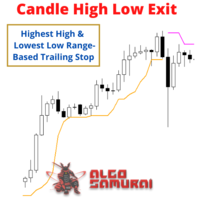
The Candle High Low Exit indicator uses the highest high and the lowest low of a range to draw trailing stop lines (orange under buys, magenta over sells) that advance with the trend until the trend changes direction. Moreover, the trailing stop lines are generated to support the order’s trend direction (long or short): In an upward trend, the long trailing stop line (orange line under buy) appears and advances upward until the close crosses under the line.
In a downward trend, the short trai
FREE
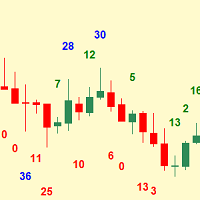
Simplest indicator for bar shadows. Very useful for Kangaroo Tail strategy.
"Shadows" - this is the distance from high and close of the bull bar and low and close of the bear bar. The purpose of the shadow is to show you if the bar is strong or not. Whether it is internal to the trend or is external. It even helps determine if a trend is starting. Input arguments: How many prevoius bars to calculate Value that should be passed to trigger the alarm How many times to repeat the alarm (Put 0 if yo
FREE
This is a New Single/Multi Timeframes Indictor based on Moving Average divergence concepts You can use it in differerent modes : Single time frame Mode :(2nd prefered) you input the time frames all the same period - you will get a square wave for Bear /Bull Areas two- time frame Mode :(1st prefered) you input the two time frames you prefer- you will get two square waves representing the 2 timeframes - when the two square waves are showing a Bear area a Red down arrow will appear and the same
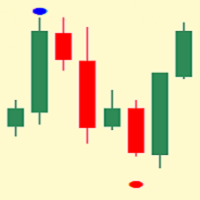
Indicator that shows two bars cluster bot and top. It will show you the forming top/bot based on the close prices. You can see the actual support and resistance.
The indicator accepts three arguments: Start bar - from which bar to start calculating Size of the dot on the chart (in font size) Distance from the top/bot Note: the indicator works on the timeframe you are currently on This indicator is very simple, does not distract you and will help you define better the trends and the channels.
S

you are in a trade making profit... should you take profit now or wait...? This easy to use Dynamic Take Profit Indicator helps you to decide when to get out of a winning trade. Or you can supervise or overrule any EA when to close an open order when manual trading, or read out the buffers[1][2] to integrate in an Expert! As soon as the price crosses the yellow line, price direction should reverse soon and orders should be closed. The band is dynamic and changing with every new candle as it

Chỉ báo tự động rút ra mức thoái lui fibonacci của tháng và năm. Draw from the same or under the same same or on the same of the tree before that. https://www.mql5.com/en/charts/12730171/audusd-pro-d1-axicorp-financial-services Màu đỏ là tháng fibonacci Màu vàng là tuần fibonacci White color is fibonacci date Red color is fibonacci month Yellow color is fibonacci tuần White color is fibonacci date Red color is fibonacci month Yellow color is fibonacci tuần White color is fibonacci date

Market Calculator is a powerful tool that allows you to easily and quickly calculate the main parameters of a trade: Lot size, StopLoss and TakeProfit, as well as estimate the amount of funds (required Margin) to open a position. The program has a very convenient and intuitive control, because implemented in OS Windows style. There are many interesting and handy features - just watch the video: youtu.be/FG2qqTJTIhE All program data are sorted into sections in the form of tabs: " Lot Calculator "
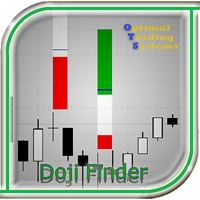
The indicator searches for and displays Doji candlesticks on the chart and signals the appearance of such a candle. The direction of the signal depends on the direction of the previous candles, as the Doji signals a reversal or correction. In addition to the possibility of signaling, the power of the reversal is graphically shown (the more green, the more likely growth, the more red, the price will fall). In the indicator settings, you can change the parameters of the Doji candlestick, the closu
FREE
Breakout FX draws arrows and emits alarms if the price exceeds or falls below the previous n candles.
️ Breakout FX can be used in expert advisors.
️ Breakout FX can improve already existing trading strategies.
️ Breakout FX is very fast and is not repainting.
Inputs Breakout Range [Candles] Breakout Price Type Arrow Size Enable Alerts Enable Push Notifications Enable Emails

Reversal Sniper is designed to find the extreme reversals of the price. Indicator collects data of Cycle Sniper Indicator.
NOTE: REVERSAL SNIPER Indicator is made for Cycle Sniper Users as an additional tool. However, it can be used by the traders who look for finding out strong reversal levels.
Indicator works on all timeframes and all instruments.
Reversal Sniper Checks: Harmonic Patterns RSI Zig Zag and Harmonic Swings Cycle Sniper Indicator's Buy / Sell Signals The complex algo is bas

Icarus Bolli-Band Change Display(TM) Indicator is a simple, but highly effective tool for visually identifying areas where the all-important 'Bollinger Band' values are in a state of expansion, contraction of neither. The traditional Bollinger Bands have been widely applied to trading charts globally since their creation by John Bollinger several decades ago. One of the limitations of the traditional Bollinger Bands is the ability to clearly identify when the bands are in fact expanding or contr
The Unique Trend indicator tracks market trends, ignoring sharp fluctuations and market noise. The indicator is suitable for trading on small timeframes because it ignores sudden price jumps or price corrections due to the reduction of market noise around the average price.
The scan at minima and maxima forms the internal boundaries (channel) when calculating the indicator signals. The channel allows you to remove market noise. iMA and iATR are used to generate signals using the author's algor

The original BoomTroom trend indicator. With this indicator, you do not need to sit near the computer and wait for the inflection point to appear day and night.
How important it is to determine the trend in the stock market or the Forex market! Still not sure how to determine the inflection point of a trend? Are you still worried about how to draw short-term and long-term trend lines? Run this smart utility. You will see pivot points of varying strength, as well as long-term and short-term tre

Implementation of indication of trend movement with moments for potential stops in the Cloud Power indicator.
The transition to the shadow warns of a possible reversal. The entry of the price inside the shadow speaks of a flat movement. The indicator tracks the market trend with unmatched reliability, ignoring sharp market fluctuations and noise around the average price. Simple, visual and efficient use. The indicator does not redraw and does not lag.
It can be easily used as an independent t

The Forex market can go through many different price paths to reach a point in the future. The future is dynamic. Therefore, planning a trade with a possible future scenario is an essential step for your success. For these purposes, we present to your attention Trend Units.
A unique author's strategy that simultaneously determines the strength of trends and points of entry into the market, visualizing it using arrows on the chart. The indicator is optimally adapted for trading on time periods

LSM Basket Indicator is a ideal tool to trade "Basket Currency" for scalping/day trading or swing trading. Imbedded tools: 1. MTF(Multi Time frame) Basket Currency Trend filtering system . 2. Identify Basket Currency Trend reversal Area (Combined with " SupplyDemand Zones Indicator " ) 3. Basket Currency Strength indicator. 4. Chart Symbols Changer.(please see video) 5. Symbol daily change %.
Parameters:
Alert On "Reached Buy level/Sell level: true/false Alert On "Enter Supply Demand
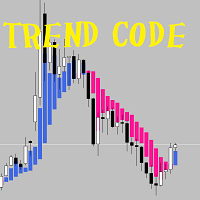
Trend Code 趋势码指标 趋势码指标是个简单而有效的指标,能够捕捉价格趋势,检测趋势反转信号,计算入场价格及止损价格。 趋势码指标是由一序列的颜色块组成,浅蓝色代表牛市,红色代表熊市。熊市块指标开盘价是方块上边,指标收盘价是方块下边,牛市则相反。 主要参数 TrendOpenAdjustment = 0.8, (range 0~1.0) TrendCloseAdjustment = 0.75, (range 0~1.0) TrendStopAdjustment = 0.5, (range 0~1.0) EnableKeyPriceLabel = true or false TrendOpenAdjustment 计算趋势快的开盘价 TrendCloseAdjustment 计算趋势快的收盘价 TrendStopAdjustment 计算推荐的趋势止损价 EnableKeyPriceLabel 选项为计算推荐关键价位 主要功能 一. 没有延迟,在一个图标时间周期内保持色彩形状不变。 二. 捕捉趋势 三. 检测趋势反转 四. 计算入场价 五. 计算止损价 六. 计算关键价,可

The Ribonucleic indicator is a versatile indicator that combines the advantages of three categories of indicators. You get 3 indicators in 1 product: multi-step trend detection (trend indicators), determination of resistance and support levels (level indicators), determination of overbought and oversold zones (oscillator indicators).
The indicator appeared in the process of many years of work with financial assets. The Ribonucleic indicator has become a consequence of those desires and require

Hit Man is an indicator for determining the trend, complements any strategy, and can also be used as an independent tool. Professional indicator for determining the trend and entry points. It uses a unique filtering algorithm to determine the trend. Shows a change in the direction of price movement on any currency pairs, without redrawing the result. Suitable for determining entry points for scalping and swing, as well as for intraday, medium-term trading.
Benefits Suitable for all types of tr

No redrawing, No delay, No repainting arrows, indicator for binary options and forex
IF YOU HAVE ANY QUESTIONS, CONSULTATIONS OR ACTIVATIONS OF THE INDICATORS PLEASE CONTACT ME IMMEDIATELY AT MY PERSONAL TELEGRAM When you buy this indicator you get two free indicators with binary and forex template for metatrader 4 One is a bot check there, it sends you signals automatically, you only execute after the signal, in favor or in reversal for FREE . The other indicator

Switchman is a smart indicator without delays or redrawing that shows the trend of the selected timeframes. The most important task of a trader is to spot a trend and follow it on time.
Uses an algorithm for calculating finding possible price reversals. It can be used as an additional or auxiliary tool for your trading strategy. The current timeframe the indicator is set to is used.
Using arrows for this that show the direction of the pivot points. Can be used with an optimal risk to reward r
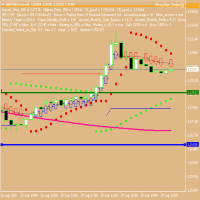
My Trend Finder
//**************************** FREE signal that uses all three of my indicators feel free to copy see link below https://www.mql5.com/en/signals/1318509?source=Site +Signals+My //**************************** period is the only setting basically number of bars on your chosen timeframe, Attach to chart of any timescale Period in bars = 7 which is a short monitoring period, 100 would be longer monitoring I use this set up on a one hour chart, basically No arrow means not su
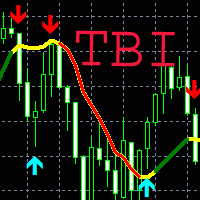
Простое визуальное и эффективное обнаружение тренда.Сигнал поступает на " закрытой свече ".Работает на всех символах и таймфреймах.Индикатор не использует входных параметров.Все алгоритмы для расчета заложены в код.Индикатор может использовать для разработки советников.Изменение цвета индикатора,характеризует поведение рынка.Зеленый цвет сигнализирует восходящее движение.Красный цвет сигнализирует о нисходящем движении.Желтый цвет показывает флет.Желаю всем удачной торговли!!!

HJZHI88888888888888888888888888888888888888888888888888888888888888888888888888888888888888888888888888888888888888888888888888888888888888888888888888888888888888888888888888888888888888888888888888888888888888888888888888888888888888888888888888888888888888888888888888888888888888888888888888888888888888888888888888888888888888888888888888888888888888888888888888888888888
FREE

All in One package includes the Oscillator Predictor , MACD Predictor , Thrust Scanner and Advanced Fibonacci indicators which are mandatory for applying Dinapoli trade plans.
Please visit below links for detailed explanations of indicators. Advanced Fibonacci Indicator => https://www.mql5.com/en/market/product/52834 Thrust Scanner Indicator => https://www.mql5.com/en/market/product/52830 Overbought /Oversold Predictor indicator => https://www.mql5.com/en/market/product/52621
Macd P

该指标在指定柱数的工作直方图上找到最大和最低价格量(市场概况)的水平。 复合型材 。 柱状图的高度是全自动的,并适应任何仪器和时间框架。 作者的算法被使用,并且不重复众所周知的类似物。 两个直方图的高度近似等于蜡烛的平均高度。 智能警报将帮助您了解有关交易量水平的价格。
概念Smart Money 。 Low Volume - Imbalance. 用于寻找良好的市场环境,确定市场结构并作为二元期权的过滤器。 它是价格的磁铁。 High Volume - Liquidity. 用于退出累积时的测试。
输入参数 。
基本 。 Bars Count - 要计数和显示的条数 。 Signal Fractal = 5 (对于颜色信号电平)。 水平将在以下条件下成为信号:顶部和底部有五个直方图不超过它 。 Min Candles For High Volume Level - 在水平蜡烛的最小数量,以便它可以成为一个信号 。
按钮设置 。 Visual Button - 按钮显示(启用/禁用) 。 Corner - 按钮的卡角 。 X inden

该指标分析指定数量的蜡烛并根据高低绘制斐波那契水平。 由于级别正在重新排列,我们对范围的右侧感兴趣。 价格会吸引水平并对触摸做出反应。 使用此工具在修正后找到趋势入口点。 如果在左边我们看到水平已经完美上升,那么我们可以假设我们已经在极值点找到了运动的终点。 所有线条都通过缓冲区或对象绘制(可选)。
输入参数 。
Bars Count - 计算范围 。
Visual Button - 按钮显示(启用/禁用) 。 Corner - 按钮锚定角度 。 X indent - 以像素为单位的水平填充 。 Y indent - 以像素为单位的垂直填充 。
Label Visual - 显示级别标签 。 Label Font Size - 字体大小 。 Label Shift Bars - 在酒吧的铭文的缩进 。 Label Tooltip - 在关卡上方的光标下显示文本 。
Draw Lines - 使用缓冲区或对象绘制 。 Box Visual - 启用/禁用框视觉 。 Box Width - 箱线粗细 。 Box Style - 框线样式 。
Le
FREE

Description
Range Detector is an indicator that identifies impulses in the market and displays their slope angles on the chart.
Recommendations
You can use this indicator to determine a trend and, accordingly, to determine the direction of opening a position or closing an opposite position.
Parameters
===== _INDICATOR_SETTINGS_ ===== - indicator settings
Maximum History Bars - maximum number of history bars for calculating the indicator. Average True Range Period - ATR indicator p
The Icarus Signals Continuation(TM) Indicator is a simple, but highly effective tool for identifying strong price trends, both long and short, across all time-frames and instrument types. The Icarus Continuation Indicator allows users to plot individual markers for each bar, when price has extended into a high-probability trend area, after a set level of extension. The Continuation Indicator allows users to fully optimise each of the unique Icarus settings to best fit a particular trading s

The indicator is the advanced form of the MetaTrader 4 standard Fibonacci tool. It is unique and very reasonable for serious Fibonacci traders. Key Features Drawing of Fibonacci retracement and expansion levels in a few seconds by using hotkeys. Auto adjusting of retracement levels once the market makes new highs/lows. Ability to edit/remove any retracement & expansion levels on chart. Auto snap to exact high and low of bars while plotting on chart. Getting very clear charts even though many ret
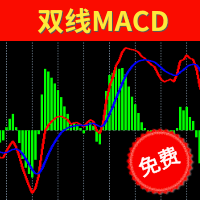
双线MACD 不少在MT4进行技术交易的人都喜欢使用MACD来判断行情的转折或者延续,而当大家在使用MT4自带的MACD指标时发现,该指标是单线的MACD,而且柱状图似乎也和过往所了解的MACD并不相符,为了能够给交易者提供完美的交易体验,一手财富技术团队特别为所有交易者提供免费的双线MACD指标! MT4中的单线MACD里的单线其实相当于双线MACD里的快线,而单线MACD的柱状图相当于双线MACD里的慢线(不过其计算方法略有不同,前者是SMA,后者是EMA),而且前者是以柱状图形式显示,后者在双线MACD里以曲线显示。同时双线MACD两个指标差是没有在单线MACD里有体现的。 具体详情可看: http://www.sygdpx.com/jywt/6696.html
FREE
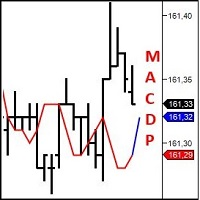
Very special indicator of Joe Dinapoli which is a derivative from traditional MACD indicator. It shows the precise price, at which MACD will show line crossing and trend shifting. Also, this level is known one period ahead of time.You can constantly reassess your current position by looking at this studying a variety of timeframes. When you are in a trade, you have a feel for how much time you have for the trade to go your way by looking at the distance between the MACD Predictor line and the
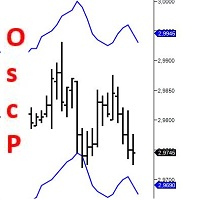
Very special indicator of Joe Dinapoli which is a derivative of a Detrended Oscillator. Through a set of parametric equations, a predicting oscillator is created that forecasts, one period ahead of time, overbought and oversold conditions. The resulting predictor values are expressed as bands on the bar chart, both above and below the market. It may be mistaken as a Bollinger Band but has no resemblance to it whatsoever. The Predictor bands may be used in a variety of ways to aid in entering an

Squat bar.
One of the signals of the "Trade Chaos" system of Bill Williams.
It is calculated based on the difference in price changes and tick volume.
Strengthens the signal of the "Bearish/Bullish Divergent Bar (First Wiseman)" if it coincides with it or is nearby.
Tested in comparison with the original program "Investor's Dream".
For more effective development of the system, read and see the materials of Bill Williams.
In the settings you can choose the color and width of bar. (Width: 3-if
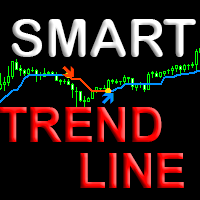
Indicator with an innovative algorithm for determining the direction of the trend. Shows the best results for determining the trend on any currency pairs, stocks, cryptocurrency without redrawing the result. It will help you immediately determine the profitability of the current pair and timeframe. Uses Price action patterns in conjunction with the author's unique algorithm. Suitable for both beginners and professionals for all types of trading. How to choose a profitable timeframe and optimize

The Knowledge of which Geometry aims is the knowledge of the Eternal - Plato Quant Stress Scanner is a Scientifically developed Stress detection algorithm along the geometrical lines on the price data which are quantified into Stress repulsion, fractures and clusters in a easily understandable signal form. Each signal are displayed in well-arranged with currency pairs in row-wise and timeframes in column-wise manner. Explanation of signal and plotting stress levels with trendlines are shown in
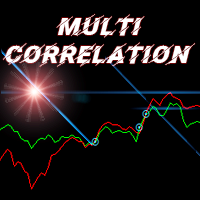
Indicator of correlation of two trading instruments.
Ideal for pair trading.
Example of use: if there is a significant divergence of correlated trading instruments, open two deals in the direction of each of them. Trades are closed when the correlation lines are crossed. Settings: First symbol (if empty - current) - The first trading instrument (if empty, the current one); Second tool (if empty - current) - Second trading instrument (if empty - current); Number of bars - Number of bars for ca

Draws Daily, Weekly and Monthly pivots and the respective supports and resistances levels (S1, S2, S3, R1, R2, R3). Ideal for placing stop losses and/or using as a break-out strategy. Features Unlike other pivot indicators in market you get very clean charts. Pivot levels are plotted irrespective of timeframe, on which you trade, i.e. M1, M5, M15, M30, H1,H4 or Daily timeframes. Pivot levels do not change when you change timeframe. Fully customizable options. If you are looking at Fibonacci
FREE

The indicator determines a special pattern of Joe Dinapoli. It gives very high probability buy and sell signals. Indicator does not repaint. Indicator Usage Buy Signal ''B'' Entry : Market buy order at signal bar close Stop : Low of signal bar Take Profit : First swing high Sell Signal ''S'' Entry : Market sell order at signal bar close Stop : High of signal bar Take Profit : First swing low Indicator Parameters Fast EMA : External Parameter (should be kept as default) Slow EMA: External Parame

This is an alert for when price is above the 200 ema, macd is below its zero line and the slow ma crosses above the fast ma and vice versa for sells. It has been tested 100 times as seen on youtube and has a 65% win rate on the 30 minute time frame.
I've attached a video to explain how to use it. Under the vuideo is a link to Trading Rush video where he tests the strategy 100 times on 30 minute.
(1) INDICATOR PARAMETERS
MA Period . Default is 200 MA Type . Default is

The indicator scans for Dinapoli thrust pattern in multiple timeframes for a specific market. Key Features Indicator can be used for all markets It can scan for thrust pattern on W1, D1, H4, H1, M30, M15 and M5 timeframes Ability to choose number of bars required above/below displaced moving average to define thrust Able to move display label on chart by single click Parameters Minimum Bars: Least amount of bars to account for Thrust DMA Period: Moving average period DMA Shift: Number or bars re

We know for sure that The Fibonacci sequence is a science used to calculate or estimate target distances.
How does this indicator work? 1. Tell the spread status 2. Tell me the current price 3. Indicate whether the candlestick status is bullish or bearish on each time frame. 4. Indicates the status of the past 2 candles 5. Tell Pivot Point 6. Tell the Fibonacci sequence. 7.The Fibonacci measurement can be set. 8. Pivot can be set backward. 9. Look at support and resistance.
Suitable for 1. Da

Non-proprietary study of Joe Dinapoli used for trend analysis. The indicator gives trend signals when the fast line penetrates the slow line. These signals remain intact until another penetration occurs. The signal is confirmed at the close of the period. It is applicable for all timeframes. Inputs lnpPeriod: Period of moving average. lnpSmoothK: %K period. lnpSmoothD: %D period. *****************************************************************************
FREE
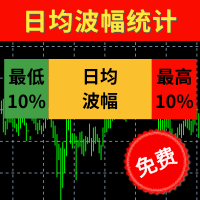
【最低10%】 统计过往100天蜡烛图的波幅并进行排序,最低10%的波幅以点数显示。 【日均波幅】 统计过往100天蜡烛图的平均波幅,并以点数显示。 【最高10%】 统计过往100天蜡烛图的波幅并进行排序,最高10%的波幅以点数显示。 【今日】 今日波幅以点数统计,箭头的位置是今日波幅相对于历史总体波幅的位置。越靠近左侧说明今日波幅越小,越有侧说明波幅越大。 波幅指标最适合用来审视当日距今为止波幅的大小,使用方法如下: 若今日时间尚早而且今日波幅尚较低,说明今日可能行情尚未启动,还有入场机会。 若今日时间尚早但今日波幅已经超过80%,说明今日趋势行情可能已经结束,接下的行情可能反弹。 若今日时间较晚,而且今日波幅已经超过60%,说明今日行情可能已经走完。 当日的止盈点位+当日已完成波幅最好不超过最高10%的波动点数。 当日的止损点位+当日已完成波幅最好超过最高10%的波动点数。 当然该指标是基于过往的100日数据进行统计,并不代表接下来今日的波幅一定不会创新低或者创新高,其作用是给日内交易者的入场时机和日内交易空间提出判断依据。 更多细节请看 http://www.sygdpx.co
FREE

Non-proprietary study of Joe Dinapoli used for trend analysis. The indicator gives trend signals when the fast line penetrates the slow line. These signals remain intact until another penetration occurs. The signal is confirmed at the close of the period. It is applicable for all timeframes. Parameters Fast EMA: period of the fast moving average. Slow EMA: period of the slow moving average. Signal EMA: period of the signal line. ************************************
FREE
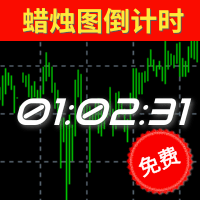
倒计时指标功能介绍 类别
解释
备注
预计结束倒计时 计算当前周期蜡烛图的结束时间(可应用于所有周期),其考虑了蜡烛图可能会因为日常休市而提前结束的情况; 如果该蜡烛图包含多个休市和开市的情况下,以最后的休市或者蜡烛图收盘时间为准。 值得特别注意的是:本指标并没有将平台额外公布的节假日休市、修改休市或者开市时间等因素纳入考虑范围,它仅仅是基于MT4所公开的交易时间做计算,无法100%确保本品种的收盘或者开盘时间无误 ,故使用者需提前明确该品种交易时间情况。
预计开盘倒计时 仅限于状态为"休市中"的提示,根据MT4上公开显示开市时间进行预估大约还有多久时间开盘; 和预计结束倒计时类似,并没有将额外公布的时间纳入考量。由于W1和MN1周期中包含多次的开盘和收盘,所以该两周期无休市提示。
【状态】 颜色 状态 备注 绿色 正常 一切正常 黄色 服务器无报价 服务器实际上传送到MT4并非是毫无中断的,可能是1分钟之内出现多次,甚至是连续较长的时间无报价,取决于您所处的网络延迟、服务器的情况等等。
本品种已有X秒无报价 MT4上并不是所有的品种的报价都是最新的,有可能某个品种长期无
FREE

Non-proprietary study of Joe Dinapoli used for overbought/oversold evaluation. Uses of Detrended Oscillator indicator Profit taking. Filter for market entry technics. Stop placement. Part of volatility breakout pattern. Determining major trend changes. Part of Dinapoli Stretch pattern. Inputs lnpPeriod: Perid of moving average Method: Calculation method ********************************************************************************* If you want to know market Overb
FREE

The Market Sessions Indicator for MT4 helps you predict market turnarounds by detecting major supply and demand areas. These pivot points tend to occur after a new session has started and the previous one is still open. It is also used to gauge how many points or pips the market moves on average during a session. This helps us to place better our take profits and stop losses. The indicator works on all forex pairs, gold, silver, commodities, stocks, indices and any other instrument that your b

The indicator scans for stop grabber (special pattern of Joe Dinapoli which gives very high probability buy / sell signals and does not repaint ) signals in multiple timeframes for the all markets filtered and shows the results on Dashboard.
Key Features Dashboard can be used for all markets It can scan for stop grabber pattern on MN1, W1, D1, H4, H1, M30, M15 ,M5, M1 timeframes Parameters UseMarketWatch: Set true to copy all symbols available in market watch MarketWatchCount : Set the number

The Squat is a function of the range of a given price bar and the volume, or TIC volume, that occurs while that range is being created. The basic idea is that high volume and little price movement indicate substantial support or resistance. The idea behind the approach to this indicator is to first look for likely Fibonacci support and resistance and then see if Squat manifests when that point is reached. The indicator determines one of the high probability patterns of DiNapoli. It does not re

The indicator monitors the MACD trend in multiple timeframes for a specific market. No more shifting in between charts to check the trend direction while trading.
Key Features Indicator can be used for all markets Monitors every timeframe, from M1 to MN Able to move display label on chart by single click
Indicator Usage The dashboard appears to the left and upper part of the chart when attached. The shell encapsulating a timeframe goes red on a down trend, green on an up trend. If the default

The indicator monitors the Dinapoli MACD trend in multiple timeframes for the all markets filtered and shows the results on Dashboard.
Key Features Indicator can be used for all markets Monitors every timeframe, from 1 Min to Monthly
Parameters
UseMarketWatch: Set true to copy all symbols available in market watch MarketWatchCount : Set the number of symbols that you want to copy from the market watch list. CustomSymbols: Enter the custom symbols that you want to be available in dashboard. Ti

The indicator scans for Dinapoli thrust pattern in multiple timeframes for the all markets filtered and shows the results on Dashboard. Key Features Dashboard can be used for all markets It can scan for thrust pattern on MN1, W1, D1, H4, H1, M30, M15 ,M5, M1 timeframes Ability to choose number of bars required above/below displaced moving average to define thrust Parameters
UseMarketWatch: Set true to copy all symbols available in market watch MarketWatchCount : Set the number of symbols that

This indicator Super XT indicator.Indicator displays trend movement. Indicator calculates automatically line. Features
FiltPer - displays indicator period. Window - displays indicator trend (true/false).
Trend - displays indicator trend (true/false).
X - move the trend left and right. Y - move the trend up and down.
How to understand the status: If the Trend color is green, trend is up.
If the Trend color is red, trend is down.
////////////////////////////////////////////////////////

The indicator allows you to trade binary options. The recommended time frame is М5 and the expiration time is 5 minutes. The indicator suitable for auto and manual trading. A possible signal is specified as a arrows above/under a candle. You should wait until the candle closes and entry the trade at new candle Arrows are not re-painted Trade sessions: Any Currency pairs: ( recommended) EUR/NZD Working time frame: M5 Expiration time: 5,10,15 minute Up buffer: 1, down buffer: 0 *** Use with b

This type of arrow indicator works without redrawing signals. The signal on the indicator is shown as arrows (in the direction of movement). It is very simple and effective to use in the Forex market. Type of trading: "Scalping" It is applicable and performs well in intraday trading, as well as long-term trading. Сигнал на индикаторе показан в виде стрелок ( по направлению движения).
Очень прост и эффективен в применении на рынке Форекс.
Вид торговли: " Скальпинг"
Применим и хорошо себя по

TorN ( Trend or Not ) has been made from ADX problem on fixed level. Only fixed level is hard to find trending or not. Now I find the better method to analyze ADX with MA . You can use this signal to confirm your trending strategy. (Or use it to find Sideway)
The best signal is signal line get higher than MA line and fixed level. ( Recommend to use level value same as ADX period or higher ) If signal line lower than MA line on Any level is mean weakening trend.
Please be aware that thi
MetaTrader市场提供了一个方便,安全的购买MetaTrader平台应用程序的场所。直接从您的程序端免费下载EA交易和指标的试用版在测试策略中进行测试。
在不同模式下测试应用程序来监视性能和为您想要使用MQL5.community支付系统的产品进行付款。
