适用于MetaTrader 4的新技术指标 - 41

The TickCounter indicator counts up and down ticks on each new bar.
The calculation starts from the moment the indicator is placed on the chart.
Histogram bars represent: Yellow bars - total number of ticks; Blue bars - ticks UP; Red bars - ticks DOWN. If the blue bar is not visible, then there are more down ticks and the red bar is displayed on top of the blue one (the red layer is above the blue one). MT5 version: https://www.mql5.com/en/market/product/82625
Each reinitialization of th

Our team has finally achieved the expected result.
We have created artificial intelligence for binary options trading. Don't believe? Many users have already rated it positively. The results will surprise you too. This indicator broadcasts signals for a binary option through a telegram channel. All signals are reliable and of high quality.
Read more !!! ATTENTION !!!
You didn't dream !!! HOW TO EARN RIGHT NOW? The most successful signal channel for binary options Students,
FREE

40% off. Original price: $50 Ichimoku Trend Finder is a multi symbol multi timeframe trend dashboard that helps traders to monitor and identify potential market trends from one chart. This panel scans the Ichimoku Kinko Hyo indicator in 28 configurable instruments and 9 timeframes for classic Ichimoku trend signals with a deep scan feature to scan all market watch symbols (up to 1000 instruments!).
Download Demo here (Scans only M1 and M5) Settings description here MT5 version here
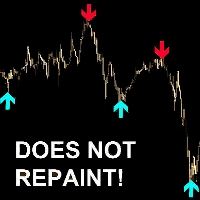
"Avadhut sathe" is an indicator for scalping. Shows the trader with arrows on the chart the price reversal points. Best of all "Avadhut sathe" trades on M1, M5, M15 timeframes. Recommended currency pairs: GBPUSD, EURUSD, GOLD, SILVER, BTCUSD, AUDUSD, USDJPY, EURJPY, USDCHF, USDCAD, EURCHF. The "Avadhut sathe" indicator has many modes of operation, on which the accuracy of the signals depends. In most modes, the "Avadhut sathe" indicator does not redraw its signals. The "Avadhut sathe" indicator

Master Point is an indicator set that includes the most powerful and necessary tools for a trader, giving that very edge in the markets to be successful. An indicator that has an elegant and complete system that works very well in all markets (Forex, Crypto, Stocks, Indices) helps to find the best reversal points. It has tools such as trend reversal detection, pivot points, divergences, currency strength and 'candle strength'. All this makes the indicator a complete tool that does not require a

Trading Indicator Lab’s Trend Navigator for MT4 is an indicator that can help you reveal the underlying trends in any chart on any timeframe. Determining Trends It only takes a minute or two to analyze the indicator with its simple yet insightful methods of representing bullish, bearish and ranging price action across the chart. It forms a single line that runs in 3 directions: Upward direction – represents a significant bullish price action Horizontal direction – represents ranging price action

Indicator MT4 : RSI MA is Moving average of strength index
Objective : Find entry price for the good trade
How to set up indicators RSI MA : 1. RSI period 14. 2. MA you can set calculate price and method price. 3. MA period 9. 4. Arrow setting : 6 types. 5. Alert setting : Next bar or Instant bar. 6. Choose display for 1 or 2 calculation by formula.
How to trade for success : Entry point : Buy / Long position 1. When arrow up direction show 2. TP : RSI OVB
Entry point : Sell / Short posi

Market Meter is designed for explore various trends in current trading symbol. with Market Meter you can get a clear idea about the trends running on different time frames of current symbol. This indicator uses separate window to display its data. Every time when a new trend occurred, Indicator shows it with displaying an arrow on related text area. It's very important to identify the trends of higher time frames when you trading lower time frames. Let the Market Meter to do the work for you.

Inficator MT4 : HiLo Objective : Find Support and Resistance zone
How to set up Indicator HiLo : 1. Indicators type multi time frame are MN1 W1 D1 H4. 2. Customize for use MN1 only or W1 only or D1 only or H4 only or open all. 3. We use MN1 and W1 for set to Key level. 4. For Close price or Open price to high price set for Resistance zone. 5. For Close price or Open price to Low price set for Support zone.
How to trade for success : Entry point : Buy / Long position 1. Price bid hit the
MOVING AVERAGE ON OFF BUTTON as the name suggest you can disappear and reappear up to 5 moving average with a single click. This can save a lot of time and energy for the traders. you can change the color, period and shift of the moving average as you wish you can move the on off button where ever you want you can also change to simple moving average, exponential moving average and much more types of moving averages to know more about the the indicator and how to use it watch the video linked b

Anchored Volume Weighted Average Price (AVWAP, or Anchored VWAP). Tells you who is in control, the buyers or the sellers. Better than all other moving averages because it adds weight to the traded volume. This technique was made popular by Brian Shannon of Alphatrends. It is calculated by multiplying typical price by volume, and the dividing by total volume. It is very simple to use. 1. Press a number from 1 to 9 on the keyboard, then click the chart where you want to anchor the VWAP. 3. Hold C
Индикатор Free Pro Level предназначен для автоматического построения уровней поддержки и сопротивления. Преимущества индикатора: подходит как для опытных трейдеров, так и для новичков; простота в использовании; уровни не перерисовываются; вероятность реакции цены при касании уровня более 80%; бесплатный. Индикатор Free Pro Level имеет всего 5 пунктов входных параметров: Минимальная длина свечи в пунктах по 5 знаку - основной параметр, на основании которого происходит анализ и поиск уровней по
FREE
SL Curruncy impulse flow of this intraday Asian London New York Sessions strength.SL Curruncy impulse indicator best for intraday scalper. market powerful move time you can catch best symbol. because you'll know which currencies are best to trade at that moment. Buy strong currencies and sell weak currencies Suggested timeframes to trading : M1 - M5 - M15 - M30 -H1 You can however just change SL Curruncy impulse to check in the settings. Bear in mind that scanning very low timeframes. How d

Trading Indicator Lab’s Candle Volume Heatmap for MT4 merges volume with price by applying gradient-colored dots on the bars. It can also detect bars that have the most volume and the least volume. Gradient Coloring When applied to a chart, the Candle Volume Heatmap indicator applies colored dots to each bar which may vary according to its volume. The chart becomes a heatmap where you can easily spot which parts of the bar history are “hottest” or the bars that had the greatest number of volume

Trading Indicator Lab's Volume by Price is a volume-based indicator for MT4 that reveals price levels with the most and least volume for each bar within a given period. How It Works You can think of the indicator as a running volume profile that displays the most voluminous price level and the price level that has the least volume. For each bar, the indicator calculates the volume vertically in the price axis. As this is calculated, the indicator creates 2 signals: (1) a large red dot which repr

Pullback Viewer is designed to show valid pullback points in a bearish or bullish trend.
What is considered a valid pullback?
A valid pullback needs to have a body close outside the previous candle high (in a bearish trend ) or previous candle low (in a bullish trend ). If the candle wicks out the previous candle, it's not a valid pullback.
Pullback must liquidate the previous candle with a clean candle body close.
When is this indicator useful?
It's useful to under
FREE
Easily track how the price moves in a separate indicator window with this trend indicator. Great for scalping or long-term trading. Helps you find best entry points for your trades after reaching a certain level, and easily identify where you can exit your trades. This indicator can be used on all time frames and pairs. Features alert function.
No need to set up the indicator.
How to use: Simply attach to any chart. NB : Look to the extreme zones (oversold/overbought) when looking for new tra

CFF Pro Trader
CFF Pro Trader is the best trading system you will ever find when you want to follow the right & the real direction of the market, It’s providing marvelous trading signals based on such and amazing algorithm.
*** 2 Copies left for next price $4100 ***
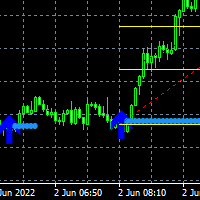
Here is the Double Arrow ArrZZx2 indicator that works best on 5 minutes time frame with Alerts. Good for pairs like NAS100, US30, GER30 and XAUUSD Your buy entry or Sell entry is on the second arrow of the Arr zzz You can confirm your second arrow with Fibonacci retracement levels the 50% level and the 61.8% which is the golden zone The double is good on strong trending markets look for the breakout on the second arrow Look at the screenshots for examples.

''Trendlines'' is an Indicator, that every Trader need and shows Trendline and Support and resistance levels in all Timeframe's. Also In 1-hour, 4-hour and daily time frames and Current timeframes, support, and resistance levels are specified and trend lines are drawn so that the trader can see all levels on a chart. In Properties it is possible to turn off unnecessary Lines.
In ' Tendency indicator '' , as full package of Predictions that every Trader need, there is also the Predic
The Price Elevator indicator is developed to help you figure out the general long-term trend of the market. If the price is above the Green separator line, this is a clear indication the bulls are in control. Similarly, the bears are in control if the price continues to trend below the red separator line. Download Price Elevator MT5
Trend Re-entry In this case you would plan your buy entries above the green dotted box (make sure to set the Buy / Sell Retracement Floor=30). The SL should be

IGRIDCOIN.COM PRESENT SIGNALS FROM THE OUTER LIMITS! IgridCoin Space Signals is a unique 4 in 1 reversal trend indentation bot 100% non-repainting multi-timeframe indicator that can be used on all symbols/instruments: forex, commodities, cryptocurrencies, indices, stocks. “Igrid space signals” it will determine the current trend and at what point a reverse will happen at its early stages, gathering information and data from up to 4 special indicators, which are: Average Directional Movement Ind

The Chop Exploder indicator is a custom indicator that has a long run, tight chop, short chop, and band colour. This indicator has MT4 alert notification,mobile notification, and email notification. The default indexing of all arrays and indicator buffers is left to right. The index of the first element is always equal to zero. Thus, the very first element of an array or indicator buffer with index 0 is by default on the extreme left position, while the last element is on the extreme right posit
The R[2] Forex Indicator is a complete Forex Trading System working on major forex pairs on 15 Minutes time frame, and it draws: Low Dot / High Dot to spot potential turning points Buy Arrows and Sell Arrows to help you enter the trades with the perfect timing A two colors dotted line to show the trend in action and the target for reversal signals
I invite you to watch my Videos on YouTube where I show the R[2] Strategy and how I personally trade with it, and a
The R[2] Gold Indicator is a complete Trading System working on GOLD (XAUUSD) on 5 Minutes time frame, and it draws: Low Dot / High Dot to spot potential turning points Buy Arrows and Sell Arrows to help you enter the trades with the perfect timing A two colors dotted line to show the trend in action and the target for reversal signals
I invite you to watch my Videos on YouTube where I show the R[2] Strategy and how I personally trade with it, and also to join m


MetaBands使用强大且独特的算法绘制通道并检测趋势,以便为交易者提供进出交易的潜在点。它是一个通道指标和强大的趋势指标。它包括不同类型的通道,可以通过使用输入参数简单地合并以创建新通道。MetaBands使用所有类型的警报通知用户市场事件。 功能 支持大多数通道算法 强大的趋势检测算法 能够合并不同类型的通道 多时间帧和多货币(信号矩阵) 所有类型的警报功能(声音、屏幕闪烁、推送通知、电子邮件、弹出窗口、箭头) 它永远不会重绘
趋势检测 MetaBands使用在通道内振荡的蓝色线来检测趋势。当该线遇到通道的上界时,表明开始下跌趋势,当它遇到下界时,表明开始上涨趋势。如果蓝线接近中线,则市场处于整理期。 该指标使用独特的方法来检测趋势。一开始可能看起来有些复杂,但如果您观看视频教程,您就会意识到它是多么强大且易于使用。
入场和出场信号 当趋势变化或价格穿过上下通道时,MetaBands会立即通过不同的方法提醒交易者,这些方法可以在指标设置中启用。
信号矩阵 要监视来自不同时间框架的多个符号并在一个地方查看信号,请单击右上角按钮或按键盘上的M键以打开信号矩阵。该矩阵可以
该指标使用价格序列的局部高点和低点。突出极值后,对它们的值进行平滑处理。因此,建立了两个通道 - 外部和内部。如果价格走势严格遵循线性趋势,则内部通道显示限制。外部通道以对数趋势显示价格变动的边界。 在计算通道后,该指标分析实际价格走势并提供开仓和平仓建议。蓝点 - 建立买入头寸,红色点 - 建立卖出头寸。相应的交叉盘建议关闭某些头寸,如果有的话。应该记住,并非所有信号都具有相同的强度和准确性。在某些情况下,正确方向的价格变动会很快结束,因此不可能获得大笔利润。在某些情况下,信号会导致损失(最后一张图片显示了此类信号的示例)。鉴于这些特点,我们可以推荐以下方法 - 使用浮动止盈,其值可以根据当前市场情况进行更改。还需要选择一个止损值,以便在出现关闭它们的信号之前关闭无利可图的头寸。 指标设置使用以下参数进行: iChannel - 调整通道的宽度。狭窄的通道会提供更多的信号,但也会增加误报的风险。 iSignal - 允许您配置信号的显示。默认情况下,仅显示最佳进入和退出信号。 iPeriod - 指标周期。该参数越大,通道宽度越大。因此,它也会影响信号的数量。 iFactor -

市场结构反转警报指标检测趋势或价格走势何时达到其生命周期的终点并即将反转。它会在市场结构发生变化时向您发出警告,这通常发生在可能发生逆转或大幅下滑时。 当在可能的耗尽点附近形成新的高点或低点时,该指标会检测到突破和价格动能。当根据当前趋势建立新的高概率交易时,该指标会绘制直方图。价格减弱到收盘价高于或低于矩形,表明潜在的转变。 要了解指标的工作原理,请查看下面的视频! 特征 在关键的消耗时间通知您潜在的市场结构变化。 随着价格达到枯竭水平,它会自动吸引短期市场结构。 支持所有符号和时间范围。 非常适合趋势交易者并在更大的时间范围内确定趋势方向和条目。 在较低的时间框架图表上,从较高的时间信号中寻找方向偏差箭头。
Apollo Binary Options Indicator 这是二元期权交易的信号指标。该信号在当前蜡烛的开盘时出现,并且在它关闭之前一直有效。信号伴随着箭头以及图表上的信号消息。推荐的期权到期时间是一根蜡烛。也就是说,如果图表是 H1,那么到期时间将是 1 小时。如果图表为 M5,则期权到期时间为 5 分钟。但事实上,您可以随意使用信号,如果您愿意,您可以自由地遵循自己的交易规则。 我建议将此指标与我的其他用作过滤器的指标结合使用。我将完全免费向所有买家提供第二个指标。我还将与您分享有关如何使用该指标来获得最佳结果的建议。该系统适用于二元期权交易者和外汇交易者。 购买后联系我!我将免费向您发送一个额外的指标!我还将与您分享使用该系统进行交易的建议。

40% off. Original price: $50 Moving Average Trend Scanner is a multi symbol multi timeframe triple MA crossover dashboard that helps traders to monitor, and identify potential market trends from one chart. This panel scans 3 moving averages in up to 28 configurable instruments and 9 timeframes for triple moving average alignment and moving average crossover with a deep scan feature to scan all market watch symbols (up to 1000 instruments!).
Download Demo here (Scans only M1 and M5) Settings

" Scalping saham " is a unique, turnkey scalping trading system. It shows the trader when and where to open and close trades. Scalping trading is one of the most effective, but at the same time, the most complex trading systems. Therefore, if you don’t have your own strategy yet, you’d better take a ready-made scalping strategy and work with it. The scalping strategy of this indicator is to determine the direction of the trend with high accuracy, then determine the price reversal points and giv

Cyclical indicator for trading and predicting the direction of the market. Shows the cyclical behavior of the price in the form of an oscillator.
Gives signals for opening deals when rebounding from the upper and lower boundaries of the oscillator. In the form of a histogram, it shows the smoothed strength of the trend.
Will complement any trading strategy, from scalping to intraday. The indicator does not redraw. Suitable for use on all symbols/instruments. Suitable time frames for short-term

Horizontal tick volumes (HTV) Horizontal tick volumes - an easy and convenient indicator of a horizontal market profile in a user-selected time. Produces a visual image of strong trading levels by maximum peaks past volumes and trading direction by color (sell or buy), and also allows you to detect smaller trading levels by differentiating past volumes. In the "Optimal" mode, when displayed on chart periods up to and including "M30", the data of one-minute bars are used, on H1 and H4 - five-minu

Middle Men. Please Note: The latest update (V2.00) supports all symbols and multi Timef rame view.
How To Use
Suppo rt and Resistance lines will update eve ry week p r oviding relevant tradable levels Vertical line change represents weekly change and update of levels This is not a repainting indicato r the refo re even if certain levels are not respected, the lines will not move Use along with you r analysis Next level may be used as a take profit target. You may need to be cautious
Great indicator for binary options!
Try what he can do!
Alert is arranged in it so that you are not late with the signal!
You can also customize the periods that suit you! (it is configured for currency pairs)
If you want more, you can always reconfigure and use more!
arrow indicator that works on several indicators, in the settings you can change the color of the arrows and the period! (repeat)
Test it and see it in action!

This indicator has as many dots as a Rollex watch..
Also in the kit we have 3 built-in indicators that are combined and configured in such a way that would give you a profit of 75% and that's not all
for your convenience, you can reconfigure it! Initially, it is configured for currency pairs, but if necessary, we can reconfigure it for cryptocurrency and also raw gold, whatever you want!
Not just an arrow indicator, but an Alligator in the world of the Market, then you will like how it sh

PROFITABLE TRADER is an interesting name for this indicator... And all because it is for a true trader who values his time. It has a built-in Alert and parameters that will make your work easier. Open settings will allow you to set the indicator to any cryptocurrency or just currency. It's better to test and then draw a conclusion .. screenshots will show everything.. good bidding my friend.

This indicator is named so for a reason, because it will show the reverse side of the market.
It has several math indicators built in that are tuned to show the best signals for currency pairs!
Ideally proved to be in work on the M5-M15 no more and no less!
Only at the same time it shows up to 86.5% of correct signals!
The settings include the colors of the arrows, the alert, and the same parameters so that you can reconfigure the indicator and trade on cryptocurrency and raw materials!

An excellent indicator for those who like fast binary options trading!
It works great on m1-m5 timeframes!
The periods are customizable, so you can even set up for cryptocurrency, and trade on weekends!
You can also customize the color of the arrows!
Works on all timeframes!
But as stated above, it's better on m1 - m5!
Whatever you forget about the signal, it has an alert!
Test and try this indicator! If I have questions write, I will gladly listen to suggestions and errors!

By TFT Professional - One of our best MT4 products
which does not draw or change the positions of the arrows.
an arrow appears on the current candle.
periods are customizable as well as the color of the arrows.
with this indicator you will feel what you need from the market,
This is the stability and openness of the market.
Multi-timeframe and multi-currency indicator!
Test and try it in action!
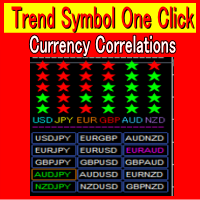
Currency Strength Meter 1:Correctly identifying trends in foreign exchange investments is critical. 2:TrendSymbolOneClick quickly detects and displays trends that have just begun and those that have already been in place for an extended period of time. 3:There is also a USD JPY EUR GBP AUD NZD strength function. 4:Volatility allows you to know exactly when there is a major market move. 5:You can save time in your market analysis by using Trend Symbol One Click. 6:Analysis available from 1 minut

40% off. Original price: $50 Advanced Bollinger Bands Scanner is a multi symbol multi timeframe Bollinger bands dashboard that monitors and analyzes the Bollinger Bands indicator from one chart. This panel monitors the Bollinger bands indicator in up to 28 configurable instruments and 9 timeframes for price overbought/oversold, price consolidation (Bollinger bands squeeze), and consolidation breakout (squeeze break) with a deep scan feature to scan all market watch symbols (up to 1000 instrume

It is a very simple and useful micro indicator. Shows the current ask price, and the maximum relative ask price up to the current moment, on the chart, in the first N candles. It facilitates quick decision making by offering a visual reference. Likewise, when we position ourselves with the cursor over it, it shows us the maximum spread since the indicator is applied, until the current moment. It is perfect for scalping . By default, the parameter N has the value 4.
Especially recommended ind
FREE

Pipsurfer Tide Meter is a Momentum Indicator that is designed to help trades know which way the "Tide" is turning. This indicator is a great supporting indicator to the pipsurfer main indicator that is listed in MQL5 under "Pipsurfer Indicator"
The Strategy Behind the Tide Meter is that youll see the blue bars and the red bars. Blue bars are for bullish momentum Red bars are for bearish momentum Use price action to find a trading zone then wait for the tide meter to change color then you en
FREE

Overview: With so much noise and distraction in the markets I wanted to create clarity for traders to have a simple, efficient, and fun trading experience. This is why I created Pipsurfer. Pipsurfer is an trend following indicator that visually shows you important Institutional Smart Money levels in the market and helps you to trace Market Structure in the markets. Most traders find it difficult to visually see trading elements such as trend, structure and momentum which are key for understandin

Всем привет. Представляю Вашему вниманию Индикатор TRUE ATR для mt4 Так же есть данный индикатор для mt5 https://www.mql5.com/ru/market/product/82319 Данный индикатор работает на всех рынках. TRUE ATR высчитывает среднестатистическое движение инструмента за 1 день и показывает сколько в инструменте осталось энергии внутри дня. В отличие от классического индикатора АТР которые без разбора учитывает все бары(свечи), TRUE ATR при расчете среднестатистического движения инструмента исполь

Pipsurfer Dashboard is a multi-currency multi-timeframe dashboard designed to alert you to where the action is happening in the forex markets. The software trades a trend based price action and market structure strategy. Assets Supported: All Forex Metals Indices Major Crypto
Major Input Settings: Timeframe Filters - Choose which timeframe you want the Pipsurfer Dashboard to signal you on. Pair Selection - Choose To Follow All Major Pairs And Crosses or have a custom list of your choice Aler

指示器显示针杆烛台图案. 阴影,身体和大小的比例很容易调整使用系数设置。 可以通过趋势(2个移动平均线)和反转(RSI和布林带)进行过滤。 这是最流行的价格行为模式。 多币种仪表板可用。 有了它,您可以轻松地在图表之间切换。
交易模式: 按趋势重新测试 。 假故障 。 其他 。
EURUSD, GBPUSD, XAUUSD,... M15, M30, H1 。
输入参数 。
主要的 。 Bars Count – 指标将工作的历史柱数 。 Min Candles Shadows / Body Ratio – 阴影与蜡烛主体的最小比率。 如果阴影小于指定值,则忽略这样的蜡烛。 式(HL-OC)/OC 。 Min Shadows UP/DN Ratio – 是来自蜡烛不同侧面的阴影的最小比率。 如果两边的阴影长度相同,那么它们的比例是1.0,我们在设置中设置了最少1.5,所以这样的蜡烛将被忽略。 如果您需要更多信号,则将比率设置为1.0 。 Calc HL Candles – 我们数多少支蜡烛来确定平均蜡烛的大小 。 Min PinBar HL Ratio - pinbar
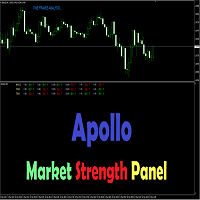
阿波罗市场强度面板是一个多时间框架指标,对外汇和二元期权交易者有帮助。该面板代表了从 M1 到 H4 的几个时间范围内的市场状况。该指标提供有关三个重要市场方面的信息。它们是趋势、力量和冲动。如果所有这 3 个组件都对齐,则该指标将根据市场方向为您提供买入或卖出信号。该指标在您的图表上绘制信号。您可以选择它应该生成信号的时间范围。当所有时间框架都对齐时,它也可以给你一个信号。该指标为您进行市场分析。你准备好应用信号了。该面板可以用作独立系统或作为您现有交易系统的一部分。 无论您喜欢在什么时间范围内交易,该指标都会对您有所帮助。即使您是黄牛或长期交易者,您也可以使用此工具。顺便说一句,即使您使用 D1 图表,您仍然可以使用此工具。我可以教您如何在您想要交易的任何时间范围内使用该工具。 购买后请联系我以获得我的个人交易建议和一个很棒的奖金指标!

RSI divergence indicator finds divergences between price chart and RSI indicator and informs you with alerts (popup, mobile notification or email). Its main use is to find trend reversals in the chart. Always use the divergence indicators with other technical assets like support resistance zones, candlestick patterns and price action to have a higher possibility to find trend reversals. Three confirmation type for RSI divergences: RSI line cross 50 level Price returns to previous H/L Creat
FREE

A professional trading indicator with double-entry options. Valuable Smooth Channel Lines on the separated window, Trend Lines both on the main window, and separated window and entry arrows. Good for trading scalping in the lower timeframes. Even also it can work and provide signals in the higher timeframes for longer-term trading periods. INDICATOR SETTINGS: 1. Signal Mode. There are 2 options: Default and Compact. If Default, it will provide 3 different arrow codes on the main window. This o
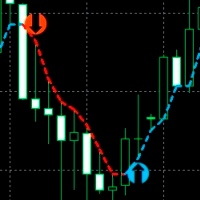
An indicator for accurately determining price reversal points on all timeframes and all currency pairs. With the help of technical analysis of the market and mathematical diagnostic models, this indicator determines the price reversal points and the current trend direction with great efficiency. The indicator displays this information on the chart in the form of arrows and lines. The arrows show the trend reversal points and the lines show the current trend direction. INDICATOR trades in real ti

Price pivot point indicator. The indicator shows with points on the chart the places where the price can turn in the opposite direction. When the indicator draws a red dot, it means that the price can turn its movement down. When the indicator draws a blue dot, then the price can turn its move up. This indicator can be used for both manual trading and automated trading by integrating it into your robot. To do this, the indicator has data exchange buffers.
Recommended currency pairs: XAUUSD EU

The Market Sessions Indicator for MT5 helps you predict market turnarounds by detecting major supply and demand areas. These pivot points tend to occur after a new session has started and the previous one is still open. It is also used to gauge how many points or pips the market moves on average during a session. This helps us to place better our take profits and stop losses. The indicator works on all forex pairs, gold, silver, commodities, stocks, indices and any other instrument that your
The Breakeven levels indicator is an indicator that, according to its algorithm of work, determines the number of open orders on a certain instrument finds the level at which all orders go from loss to profit. Separately, for sell and buy orders, the general level of the beginning of profit is found. In the lower left or right corner, information is displayed on three buttons to choose from. When you press the button, a horizontal line of a certain level is displayed on the screen. On the right

Resistance and Support is an easy to use indicator to apply horizontal lines of resistance and support. There are two windows for adding levels. When you press the button, a line appears on the price chart. It is possible to double-click this line with the mouse to activate and move it, thereby changing the indicator readings. In the indicator menu there is a choice of possible alerts - no alert, alert on touching the level an alert for closing the candle after the level.
FREE

50% off. Original price: $60 Support and Resistance zones indicator for MT4 is a multi-timeframe panel and alert that finds support and resistance zones and pivot points for all timeframes of MetaTrader 4 and gives alert when price has interaction with them. Download demo version (works on GBPUSD, EURJPY and NZDUSD symbols) Read the full description of scanner parameters in the blog page . Many unique features in one indicator:
Integrating support and resistance zones and pivot points in one
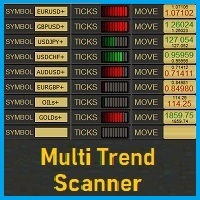
MultiTrend_Scanner is an indicator for the MT4 platform that is used to review trends on multiple symbols. We turn it on on any symbol, on any TF and we have a preview of the entire market. The current symbol is permanently assigned in the first segment of scanner. When adding another segment, you can manually enter any symbol. The quantity of added segments is unlimited. In each segment of a given symbol displayed are trends on different TFs. To calculate the strength of these trends are used
This indicator is based on the same famous fractal indicator with a slight difference:
MetaTrader version 5 click here
Advantages:
Works on all instruments and time series,
Does not redraw its results,
Comparison depth is adjustable,
Works well with any popular strategy,
Adjust the power of fractals
Input settings:
Number of comparisons - The number of candles that each side selects for comparison.
Marker distance from the candlestick
This indicator is based on ParabolicSAR. This indicator does not change the trend easily and does not change the trend until it receives a clause and approval. This indicator can be used for trail stop or trend detection.
MT5 Version
benefits:
Works on all instruments and time series,
Does not redraw its results,
Comparison depth is adjustable,
Works well with any popular strategy,
The power of the areas is adjustable,
We assure you that we we
The Market Sessions Indicator for MT5 helps you predict market turnarounds by detecting major supply and demand areas. These pivot points tend to occur after a new session has started and the previous one is still open. It is also used to gauge how many points or pips the market moves on average during a session. This helps us to place better our take profits and stop losses. The indicator works on all forex pairs, gold, silver, commodities, stocks, indices and any other instrument that yo
MT5 Version A versatile tool
You do not need any other tools with this tool.
You can enable or disable all indicators.
Their values are adjustable.
In the first line you will see a summary of your account status.
p: The amount of your profit or loss
BP: The amount of your daily profit based on the balance
EP: Equity daily earnings
WP: Your weekly profit
MP: Your monthly profit
The next line shows each of the time frames you selected.
Chikou: The Chikou process
KT: The trend of t
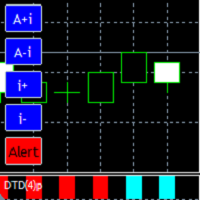
It is a very comfortable and easy to use indicator, as well as very powerful and precise. It is a digitalization of the Oscillometer indicator. Detects and visually shows us the beginning of a new trend . The way to present it, is by means of a two-color bar graph , one for the start of the uptrend, and one for the start of the downtrend . The parameter with which the indicator is built, is the maximum allowed amplitude of price oscillation. The indicator will follow the price checking its

NOTE!: The trend vote and the buy sell option shall match to the same direction before you put a trade!!
Indicator that uses Kalman filters (same as used on autonomous vehicles for data fusion between different sensors / technologies such as RADAR, LIDAR and Camera with Artificial Intelligence for object detection) by using the high and low price in order to identify buy and sell signals as indicated on the graph.
This indicator can be used on any timeframe with any currency or symbol.
Thi
FREE

Indicator MT4 : DXMA(Direction index moving average)
Objective: To track price trends and price reversals.
How to set up Indicator DXMA : 1. The standard value is EMA 12 and EMA 26, you can set it as you like. 2. UTBx 14 is Universal Trend Boundary Index, standard value 14. 3. UTBx Method is a method for calculating the standard value is Exponential.
Meaning of symbols in indicators : 1. The line of the green group means the trend is up. 2. The line of the red group represents a down trend
The Stochastic Dashboard is multi currencies and multi timeframes dashboards. It shows the Stochastic direction for the chosen pairs/timeframes. For the Stochastic lovers and manual trader this indicator is a most indicator which can be used to determine the market direction for the pair(s) you are trading. Set it to one chart only and monitor from one place all the charts you want.
PAX Simple Trend Signals for MT4
Самый простой и лёгкий в работе индикатор для торговли по сигналам разворота тренда. Зелёными и красными линиями на ценовом графике отображаются направления тренда — растущий и падающий соответственно. Стрелка вначале линии тренда сигнализирует о развороте тренда.
Если на трендовой линии появилась стрелка такого же цвета — это сигнал на открытие нового ордера. Если на трендовой линии появилась стрелка противоположного цвета — это сигнал на закрытия всех орде

该指标根据波动率自动搜索并显示图表上的大阴影。 阴影被波的大小额外过滤. 该算法通过指定范围内的阴影分析分形分解并显示水平。 在设置中,您可以启用多币种仪表板。 警报在当前计划或整个仪表板工作表之间进行选择。 大阴影和那些已经突破分形水平的信号可以单独打开。 Blog-Link - Retest and Fake Breakout with UPD1 。
交易模式: +按趋势重新测试 +假故障 +其他
EURUSD, GBPUSD, XAUUSD, ... M15, M30, H1 。
输入参数 。
主要 。 Bars Count – 要显示的条数 。 ATR Period - 计算波动性的烛台数量 。 ATR Coeff Shadow (0 - Off) – 阴影大小系数(相对于平均波动蜡烛) 。 ATR Coeff Impulse (0 - Off) – 波大小系数(仅在超过指定系数的波中搜索的阴影的滤波器,其中1是平均计算波) 。 Max Line Length - 以酒吧为单位的最大水平长度 。 Min Line Length - 以酒吧为单位的最小水平长
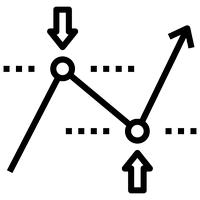
该指标显示最佳止盈和止损水平。这些水平是根据历史数据计算的。在第一次开始时,指标是根据历史训练的。之后,他评估价格在未来克服这个或那个水平的可能性,并选择最优化的选项来放置止损单。例如,选择止盈值以使利润最大并且价格达到其水平的概率尽可能高。止损水平应该是最小的,但达到它的可能性应该是最小的。这导致了具有最高可能获胜数学期望的级别。 此外,该指标可以以支撑位和阻力位的形式使用。为此,您可以组合不同的预测长度和偏移量。 指标参数: 长度 - 预测长度。此参数表示未来柱线交易的预期持续时间。 Shift - 在小节中移动。由于此参数,您可以查看过去的指标读数。 宽度 - 线宽。 ClrBuy - 买入头寸的线条颜色。 ClrSell - 卖出头寸的线条颜色。 StyleTP - 获利线样式。 StyleSL - 止损线样式。 信息 - 启用此选项时,止损和止盈值将显示在终端的“专家”选项卡中。
MetaTrader市场是 出售自动交易和技术指标的最好地方。
您只需要以一个有吸引力的设计和良好的描述为MetaTrader平台开发应用程序。我们将为您解释如何在市场发布您的产品将它提供给数以百万计的MetaTrader用户。
您错过了交易机会:
- 免费交易应用程序
- 8,000+信号可供复制
- 探索金融市场的经济新闻
注册
登录