VolumeSR MT4

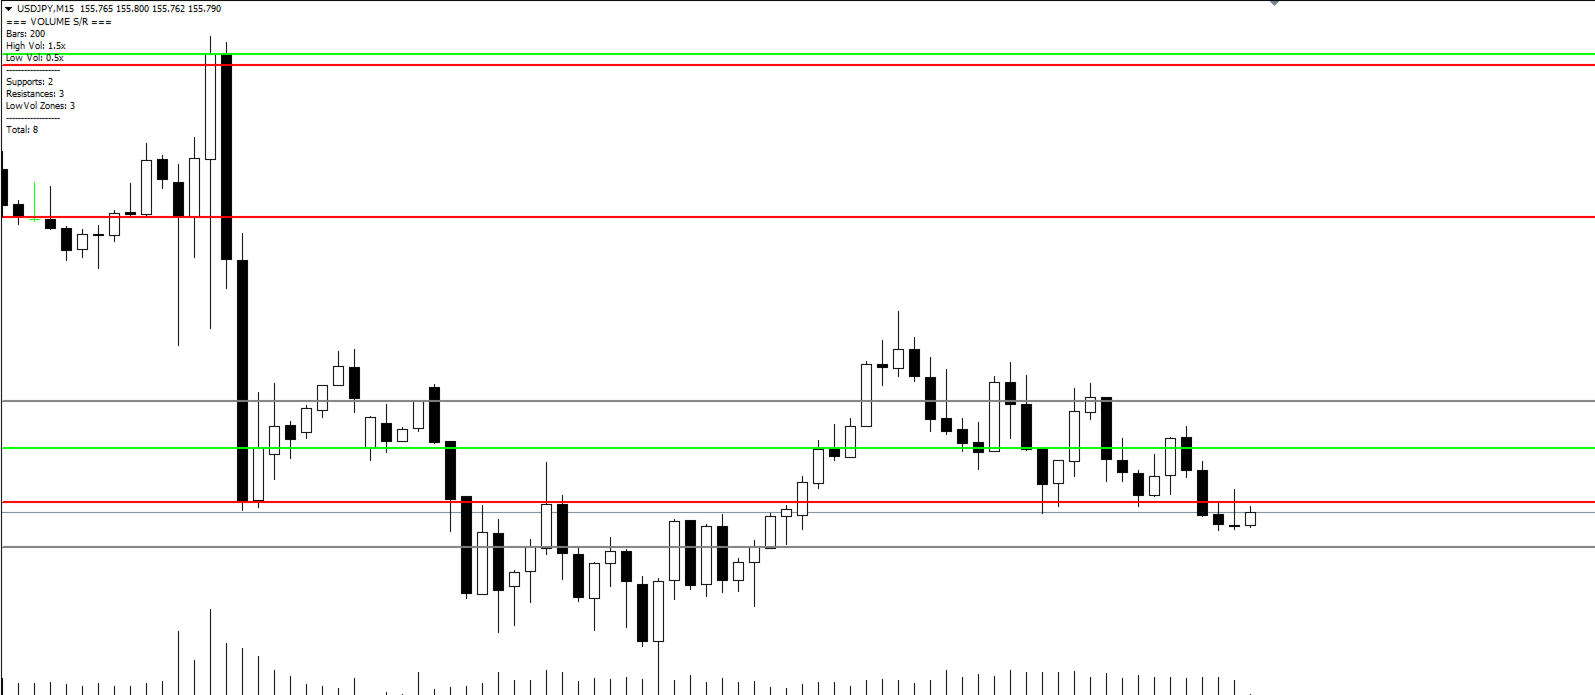
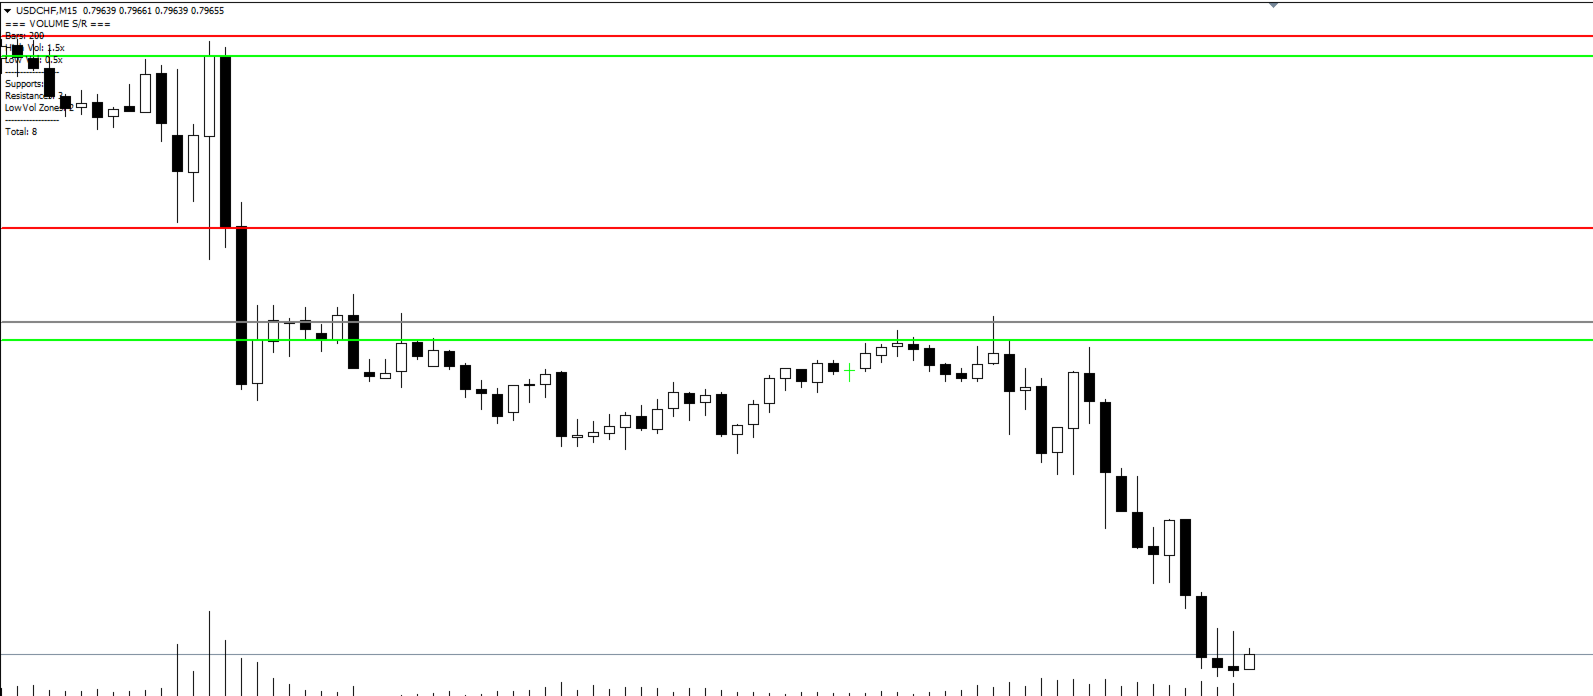
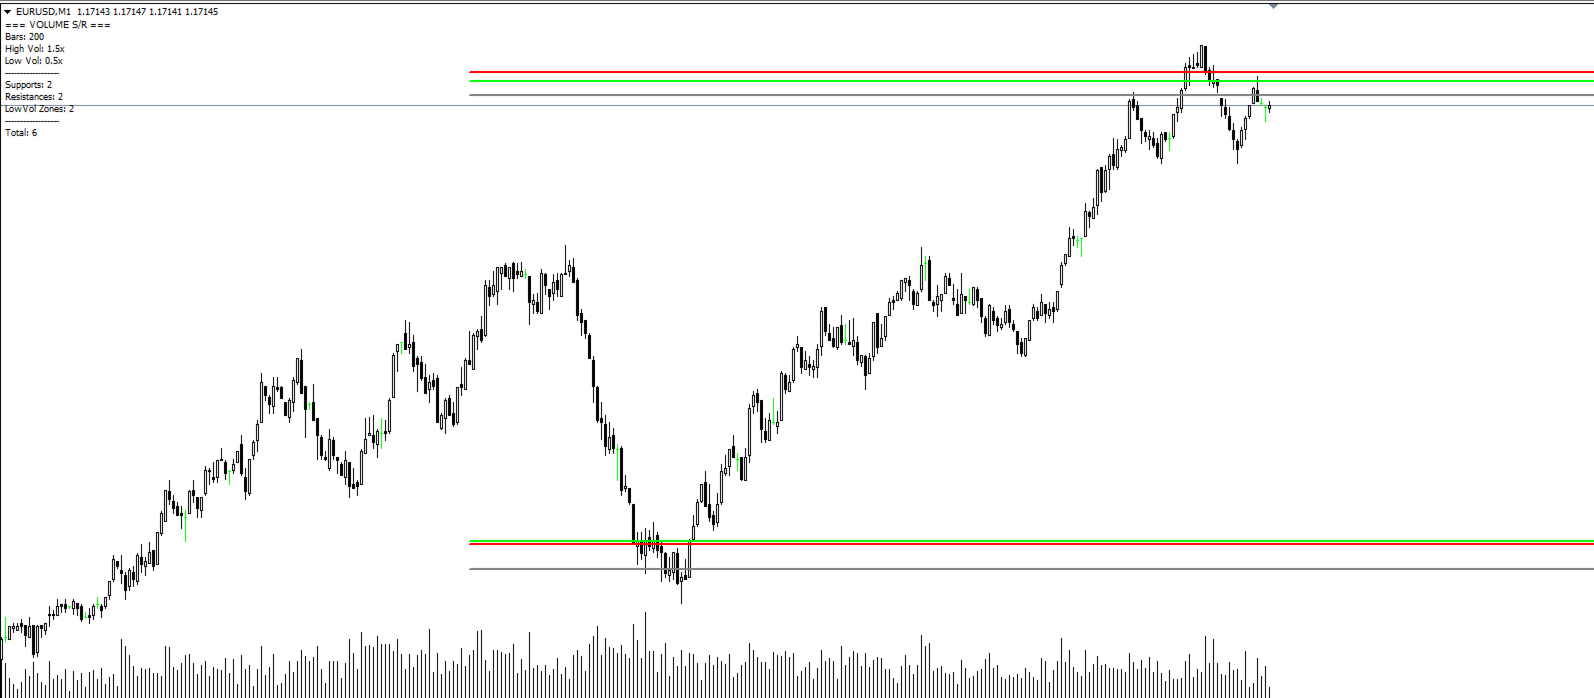
his indicator automatically identifies key support and resistance levels by analyzing volume patterns. Unlike traditional S/R tools that rely only on price, Volume S/R finds levels where the market truly reacted.
 
DETECTION LOGIC:
- High Volume Zones: Price levels where strong buying/selling occurred
- Low Volume Zones: Areas of weak interest - potential breakout or reversal zones
 
SMART FILTERING:
- Nearby levels are automatically merged to avoid chart clutter
- Maximum levels limit keeps your chart clean
- Distance filter prevents overlapping lines
 
COLOR CODING:
- GREEN: Support levels (high volume bullish reaction)
- RED: Resistance levels (high volume bearish reaction)
- GRAY: Low volume zones (potential breakout areas)
 
FULLY CUSTOMIZABLE:
- Lookback period (default 200 bars)
- Volume thresholds (high/low sensitivity)
- Minimum distance between levels
- Line colors, width and style
- Optional labels
 
 FEATURES:
- Auto-updates on each new bar
- Clean, non-repainting display
- Low CPU usage
- Works on all timeframes and instruments
 
Perfect for: Scalping, Day Trading, Swing Trading
Best on: Forex, Gold, Indices, Crypto

Prodotti consigliati
BE auto
Muhammad Ridzuan Mohd Radzali
5 (2)
Indicator automatically draw bullish and bearish engulfing without any rules. Bearish and Bullish engulf is well known area for supply and demand area marking. This indicator can be used in any strategy that required supply demand zone. Show Last Engulf : Enable this option to show unfresh engulfing  Candle to calculate : set 0 will load all history bar and can use up more memory Bearish Engulfing Colour : Pick any colour that suit Bearish Engulfing Colour  : Pick any colour that suit -Use this
FREE
The Auto Fibonacci Indicator is a professional technical analysis tool that automatically draws Fibonacci retracement levels based on the most recent closed Daily (D1) or 4-Hour (H4) candle. These levels are widely used by traders to identify key support , resistance , and trend reversal zones . This version is designed for manual trading and supports a powerful trading strategy using Fibonacci levels combined with a 50-period EMA (Exponential Moving Average) , which you can easily add from MT4
FREE
Three Bar Reversal
Yury Emeliyanov
3 (2)
Three Bar Reversal (MT4) — free indicator Three Bar Reversal is a simple and effective MetaTrader 4 indicator that detects the classic three-bar reversal candlestick pattern with additional filtering based on ATR and candle body sizes. Arrows are displayed on the last closed candle of the pattern, and push notifications are also sent. An automated trading robot Three Bar Reversal EA has been developed based on this indicator. The indicator works on all currency pairs and timeframes but pe
FREE
WH DrawFib Pro MT4
Wissam Hussein
5 (7)
Sei stanco di disegnare manualmente i livelli di Fibonacci sui tuoi grafici? Stai cercando un modo conveniente ed efficiente per identificare i principali livelli di supporto e resistenza nel tuo trading? Non guardare oltre!   Ti presentiamo DrawFib Pro, l'ultimo indicatore MetaTrader 4 che fa   i livelli   di fibonacci   automatici       attingendo ai tuoi grafici e fornisce avvisi tempestivi quando questi livelli vengono superati. Con DrawFib Pro puoi migliorare le tue strategie di trading, ri
FREE
This indicator allows to analyze a chart using the rule of supple and demand. You will see zones of sales and purchases and determine the most profitable points to open positions. The indicator is based on the principle of market fractality. Chart zones show places where a strong buyer or seller has made the price reverse and change its direction. The indicator has several types of zones calculation. Color and type of zones displaying are set as desired. The zone width can be displayed in pips.
FREE
MQLTA Support Resistance Lines is an indicator that calculates the historical levels of Support and Resistance and display them as Lines on chart. It will also Alert you if the price is in a Safe or Dangerous zone to trade and show you the distance to the next level. The indicator is ideal to be used in other Expert Advisor through the iCustom function. This DEMO only works with AUDNZD, the full product can be found at https://www.mql5.com/en/market/product/26328 How does it work? The indicator
FREE
Extremum Reverse Bar
Yurij Izyumov
2.8 (5)
This indicator has been created for finding the probable reversal points of the symbol price. A small candlestick reversal pattern is used it its operation in conjunction with a filter of extremums. The indicator is not redrawn! If the extremum filter is disabled, the indicator shows all points that have a pattern. If the extremum filter is enabled, the condition works – if the history Previous bars 1 candles back contains higher candles and they are farther than the Previous bars 2 candle, such
FREE
This indicator scans for you up to 30 trading instruments and up to 8 timeframes for occurrences of the high probability reversal patterns: Double Tops/Bottoms with fake breakouts . Please read also the blog post " Professional Trading With Double Tops/Bottoms And Divergences! " which explains the concepts behind the ULTIMATE Double Top/Bottom indicator and how you can use a professional top-down approach. This FREE Version of the Scanner scans only EURUSD and GBPUSD. The full version of the sca
FREE
Candle GAP
Thushara Dissanayake
3 (1)
L'indicatore   Candle GAP   è uno strumento essenziale per i trader che utilizzano   le strategie di Gap Trading   in quanto identifica automaticamente i gap delle candele per ogni giorno della settimana. Un gap si riferisce a una differenza di livello di prezzo tra la chiusura e l'apertura di due giorni consecutivi. Questo indicatore riconosce quattro tipi di modelli di gap: comune, fuga, continuazione ed esaurimento. Incorporando questo indicatore in qualsiasi grafico, i trader possono convali
FREE
The Support & Resistance Breakout Indicator with Smart Alerts a utomatically identifies key support and resistance levels using fractal detection, and receive instant breakout signals enhanced by RSI/CCI confirmation filters. This versatile tool includes   push notifications, email alerts, pop-up alerts, and sound alerts  so you never miss a trading opportunity. Key Features: Dynamic Level Detection  – Draws real-time support and resistance based on market fractals. Breakout Arrows  – Clear vis
FREE
.....................................hi....................... ................for showing high s and low s and support and resistanses .....................we have a lot of ways............................... it can be helpful for finding trends , higher highs , higher lows , lower highs , lower lows .......................today i write on of thems.......................... ........................you can enter the number of last support and resistanses .........................and it will dra
FREE
Basic Harmonic Pattern
Mehran Sepah Mansoor
4.58 (59)
Questo indicatore identifica i pattern armonici più popolari che predicono i punti di inversione del mercato. Questi modelli armonici sono formazioni di prezzo che si ripetono costantemente nel mercato forex e suggeriscono possibili movimenti di prezzo futuri / Versione MT5 gratuita Inoltre, questo indicatore è dotato di un segnale di entrata nel mercato e di vari take profit e stop loss. Va notato che, sebbene l'indicatore di pattern armonico possa fornire segnali di acquisto/vendita da solo,
FREE
This indicator shows the latest untouched support and resistance as horizontal lines. The indicator can show support/resistance from higher timeframes. With this indicator you can e.g. easily see the support/resistance of the timeframes H4, D1 and W1 on a H1 chart, which can be a big advantage while time your entry on H1. This is the FREE version of the indicator: Support Resistance Multi Time Frame The free version works only on EURUSD and GBPUSD! Parameters referenceTF: the timeframe from whi
FREE
Railway Tracks Pattern — Reversal Pattern Indicator Railway Tracks Pattern is an indicator that automatically detects a powerful two-candle reversal pattern on the chart. It looks for two candles with opposite directions (bullish and bearish), similar in size, and with minimal wicks — a clear sign of momentum shift. How it works: The first candle is strong and directional. The second candle moves in the opposite direction and is of similar size. Both candles have small shadows (wicks). The
FREE
PZ Fibonacci
PZ TRADING SLU
4.8 (10)
Are you tired of plotting fibonacci retracements or extensions manually? This indicator displays fibonacci retracements or extensions automatically, calculated from two different price points, without human intervention or manual object anchoring.  [ Installation Guide | Update Guide | Troubleshooting | FAQ | All Products  |  Get Help ] Easy to use Manual anchoring is not needed Perfect for price confluence studies The indicator evaluates if retracements or extensions are needed Once drawn, yo
FREE
MQLTA Support Resistance Lines
MQL4 Trading Automation
4.33 (12)
MQLTA Support Resistance Lines is an indicator that calculates the historical levels of Support and Resistance and display them as Lines on chart. It will also Alert you if the price is in a Safe or Dangerous zone to trade and show you the distance to the next level. The indicator is ideal to be used in other Expert Advisor through the iCustom function. This indicator can be tested LIVE on AUDNZD with the following DEMO https://www.mql5.com/en/market/product/26572 How does it work? The indicato
FREE
Benvenuti nel nostro   modello di ondata di prezzo   MT4 --(modello ABCD)--     Il modello ABCD è un modello di trading potente e ampiamente utilizzato nel mondo dell'analisi tecnica. È un modello di prezzo armonico che i trader utilizzano per identificare potenziali opportunità di acquisto e vendita sul mercato. Con il modello ABCD, i trader possono anticipare potenziali movimenti di prezzo e prendere decisioni informate su quando entrare e uscire dalle negoziazioni. Versione EA:   Price Wave
FREE
Predictor PRO MT4
Evgenii Aksenov
5 (2)
A new generation PROgressive indicator from INFINITY. Predictor PRO uses its own entry and exit calculation strategy. Indicator without redrawing signals! This is very important for real trading. The indicator can be used for any currency pairs, metals, cryptocurrencies or indices. The best time of the H1 chart. Unlike other indicators, Predictor PRO shows shows the Buy/Sell entry point and the Close exit point. Calculating the profit of all signals in points on the panel helps to choose the
FREE
Pivot Point Fibo RSJ è un indicatore che traccia le linee di supporto e resistenza del giorno utilizzando i tassi di Fibonacci. Questo spettacolare indicatore crea fino a 7 livelli di supporto e resistenza tramite Pivot Point utilizzando i tassi di Fibonacci. È fantastico come i prezzi rispettino ogni livello di questo supporto e resistenza, dove è possibile percepire possibili punti di entrata/uscita di un'operazione. Caratteristiche Fino a 7 livelli di supporto e 7 livelli di resistenza Im
FREE
I pattern armonici sono ideali per prevedere i punti di inversione del mercato. Offrono un'elevata percentuale di successo e numerose opportunità di trading in un singolo giorno. Il nostro indicatore identifica i pattern armonici più popolari basandosi sui principi della letteratura sul trading armonico. NOTE IMPORTANTI: L'indicatore non ridisegna, non è in ritardo (rileva un pattern nel punto D) e non ridisegna (il pattern è valido o annullato). COME UTILIZZARE: Trascina e rilascia l'indicatore
FREE
PZ Chart Overlay
PZ TRADING SLU
5 (1)
Master the market: harness the power of statistical arbitrage This indicator showcases the price action of multiple instruments on a single chart, enabling you to compare the fluctuations of different assets and seamlessly implement statistical arbitrage strategies. Its main usage is to find correlated symbols which are temporarily out of whack. [ Installation Guide | Update Guide | Troubleshooting | FAQ | All Products  |  Get Help ] Find overbought or oversold currency pairs easily Plot up
FREE
PPR and Engulfing
Yury Emeliyanov
5 (2)
PPR e Engulfing è un indicatore tecnico unico progettato per identificare i pattern "PPR" e "Engulfing" sui grafici delle valute nella piattaforma di trading MetaTrader 4 (MT4). Questi pattern possono indicare potenziali inversioni o continuazioni di tendenza, fornendo ai trader segnali preziosi per entrare e uscire dal mercato. Caratteristiche principali: Rilevamento automatico dei pattern : L'indicatore identifica e segna automaticamente i pattern PPR e Engulfing con frecce sul grafico. Segnal
FREE
Free automatic Fibonacci is an indicator that automatically plots a Fibonacci retracement based on the number of bars you select on the BarsToScan setting in the indicator. The Fibonacci is automatically updated in real time as new highest and lowest values appears amongst the selected bars. You can select which level values to be displayed in the indicator settings. You can also select the color of the levels thus enabling the trader to be able to attach the indicator several times with differe
FREE
Follow The Line
Oliver Gideon Amofa Appiah
3.94 (16)
FOLLOW THE LINE GET THE FULL VERSION HERE: https://www.mql5.com/en/market/product/36024 This indicator obeys the popular maxim that: "THE TREND IS YOUR FRIEND" It paints a GREEN line for BUY and also paints a RED line for SELL.  It gives alarms and alerts of all kinds. IT DOES NOT REPAINT and can be used for all currency pairs and timeframes. Yes, as easy and simple as that. Even a newbie can use it to make great and reliable trades. NB: For best results, get my other premium indicators for more
FREE
Candle Pattern Finder Candle Pattern Finder is a powerful MT4 indicator designed to help traders easily detect key candlestick patterns in real-time. Whether you're trading trends, reversals, or consolidations, this tool highlights important price action signals directly on the chart — helping you make faster and more confident trading decisions. Detects popular candlestick patterns: Bullish/Bearish Engulfing Hammer & Inverted Hammer Shooting Star & Hanging Man Three White Soldiers Three Black
FREE
The indicator allows you to trade binary options. The recommended time frame is М1 and the expiration time is 1,2,3 minutes. The indicator suitable for auto and manual trading. A possible signal is specified as a arrows above/under a candle. You should wait until the candle closes! Arrows are not re-painted Trade sessions: TOKYO section (Half-end) Currency pairs: USD/JPY Working time frame: M1 Expiration time: 1,2,3 minutes. The indicator also shows good results when using the martingale strateg
FREE
UPD1 D Levels
Vitaliy Kuznetsov
5 (3)
L'indicatore dei livelli si basa sui dati del giorno precedente. La formula matematica determina i livelli di entrata e di uscita.  Raccomandazioni di trading. I livelli vengono negoziati all'inizio della sessione europea, quando appare la volatilità. In caso di volatilità insufficiente, utilizzare metà del take profit per uscire. Se il prezzo si è invertito a metà del take profit, allora sull'inversione cercate un target anche al livello di metà del take profit. Se il prezzo rimbalza dal live
FREE
Ppr PA
Yury Emeliyanov
4.67 (3)
"Ppr PA" is a unique technical indicator created to identify "PPR" patterns on the currency charts of the MT4 trading platform. These patterns can indicate possible reversals or continuation of the trend, providing traders with valuable signals to enter the market. Features: Automatic PPR Detection:   The indicator automatically identifies and marks PPR patterns with arrows on the chart. Visual Signals:   Green and red arrows indicate the optimal points for buying and selling, respectively. Ar
FREE
Aroon Classic
Etsushi Ishizuka
Panoramica dell’indicatore Aroon Classic L’indicatore Aroon Classic è uno strumento tecnico che identifica quantitativamente l’insorgere e la persistenza dei trend su un grafico. Utilizza due linee — “Aroon Up” e “Aroon Down” — per mostrare la forza del trend e i punti di inversione nell’intervallo da 0 a 100. Un valore elevato di Aroon Up indica un forte trend rialzista, mentre un valore elevato di Aroon Down indica un forte trend ribassista. Caratteristiche principali Distinzione visiva tra in
FREE
PZ Pivot Points
PZ TRADING SLU
4.6 (10)
This indicator displays pivot points in the chart, including historical vales, and supports many calculation modes for Pivot Points and S/R levels. [ Installation Guide | Update Guide | Troubleshooting | FAQ | All Products  |  Get Help ] It plots historical levels for backtesting purposes It allows you to select the reference timeframe It implements different Pivot Point calculation modes It implements different SR calculation modes It implements customizable colors and sizes Calculation Mode
FREE
Gli utenti di questo prodotto hanno anche acquistato
Gann Made Easy
Oleg Rodin
4.83 (160)
Gann Made Easy è un sistema di trading Forex professionale e facile da usare che si basa sui migliori principi del trading utilizzando la teoria di mr. WD Gann. L'indicatore fornisce segnali ACQUISTA e VENDI accurati, inclusi i livelli di Stop Loss e Take Profit. Puoi fare trading anche in movimento utilizzando le notifiche PUSH. CONTATTAMI DOPO L'ACQUISTO PER RICEVERE GRATUITAMENTE LE ISTRUZIONI DI TRADING E OTTIMI INDICATORI EXTRA! Probabilmente hai già sentito parlare molte volte dei metodi d
M1 Sniper
Oleg Rodin
5 (21)
M1 SNIPER è un sistema di indicatori di trading facile da usare. Si tratta di un indicatore a freccia progettato per l'intervallo temporale M1. L'indicatore può essere utilizzato come sistema autonomo per lo scalping sull'intervallo temporale M1 e come parte del tuo sistema di trading esistente. Sebbene questo sistema di trading sia stato progettato specificamente per il trading sull'intervallo temporale M1, può comunque essere utilizzato anche con altri intervalli temporali. Inizialmente ho pro
Scalper Inside PRO
Alexey Minkov
4.74 (69)
Scalper Inside PRO – Since 2020. An exclusive indicator that utilizes an innovative algorithm to swiftly and accurately determine the market trend. The indicator automatically calculates opening, closing, and profit levels, providing detailed trading statistics. With these features, you can choose the most appropriate trading instrument for the current market conditions. Additionally, you can easily integrate your own arrow indicators into Scalper Inside Pro to quickly evaluate their statistics
Market Makers
Mohamed Hassan
5 (3)
After purchase, contact me privately to receive 1 month of free testing with EA Forex Proton! This advanced MT4 trading robot automatically executes signals from any MT4 indicator, including Market Makers. The latest version also includes AI integration, allowing each trade signal to be analyzed using Artificial Intelligence. Live Signal with EA Forex Proton: Click here Market Makers is a powerful price action trading system designed to identify high-probability Buy and Sell opportunities based
Innanzitutto, vale la pena sottolineare che questo Strumento di Trading è un Indicatore Non-Ridipingente, Non-Ridisegnante e Non-Laggante, il che lo rende ideale per il trading professionale. Corso online, manuale utente e demo. L'Indicatore Smart Price Action Concepts è uno strumento molto potente sia per i nuovi che per i trader esperti. Racchiude più di 20 utili indicatori in uno solo, combinando idee di trading avanzate come l'Analisi del Trader del Circolo Interno e le Strategie di Trading
Ultimate Sniper Dashboard
Hispraise Chinedum Abraham
4.82 (22)
Scontato a 299 dollari! I prezzi potrebbero aumentare in futuro! Leggi la descrizione qui sotto! Il miglior sistema di ingresso per la plancia Ultimate Sniper: LIVELLI DINAMICI FINALI. (Si prega di controllare i miei prodotti) L'Ultimate Sniper Dashboard funziona SOLO sui mercati live a causa dei limiti di test della MT4 multicurrency. Vi presentiamo l'Ultimate Sniper Dashboard! Il nostro migliore che contiene sia HA-Sniper, MA-Sniper e molte modalità speciali. Il cruscotto Ultimate Sniper è
Trend Screener
STE S.S.COMPANY
4.79 (95)
Indicatore di tendenza, soluzione unica rivoluzionaria per il trading di tendenze e il filtraggio con tutte le importanti funzionalità di tendenza integrate in un unico strumento! È un indicatore multi-timeframe e multi-valuta al 100% non ridipingibile che può essere utilizzato su tutti i simboli/strumenti: forex, materie prime, criptovalute, indici e azioni. OFFERTA A TEMPO LIMITATO: l'indicatore di screening di supporto e resistenza è disponibile a soli 50$ e a vita. (Prezzo originale 250$) (o
L'indicatore " Dynamic Scalper System " è progettato per il metodo di scalping, ovvero per il trading all'interno di onde di trend. Testato sulle principali coppie di valute e sull'oro, è compatibile con altri strumenti di trading. Fornisce segnali per l'apertura di posizioni a breve termine lungo il trend, con ulteriore supporto al movimento dei prezzi. Il principio dell'indicatore. Le frecce grandi determinano la direzione del trend. Un algoritmo per generare segnali per lo scalping sotto fo
Atomic Analyst
Issam Kassas
5 (5)
Innanzitutto, vale la pena sottolineare che questo indicatore di trading non è repaint, non è ridisegno e non presenta ritardi, il che lo rende ideale sia per il trading manuale che per quello automatico. Manuale utente: impostazioni, input e strategia. L'Analista Atomico è un indicatore di azione del prezzo PA che utilizza la forza e il momentum del prezzo per trovare un miglior vantaggio sul mercato. Dotato di filtri avanzati che aiutano a rimuovere rumori e segnali falsi, e aumentare il pote
Ultimate Dynamic Levels
Hispraise Chinedum Abraham
4.7 (10)
Attualmente in sconto per le vacanze a 399 dollari! I prezzi potrebbero aumentare in futuro. Leggete la descrizione qui sotto!  Vi presentiamo Ultimate Dynamic Levels - il MIGLIORE indicatore di entrata per l'Ultimate Sniper Dashboard! Entrate tempestive a bassissimo rischio e alto RR!!! Trovate l'Ultimate Sniper Dashboard QUI. L'abilità più importante sia per i trader principianti che per quelli professionisti è quella di capire esattamente dove e quando un mercato è più probabile che si tras
Super Signal – Skyblade Edition Sistema professionale di segnali di tendenza senza repaint / senza ritardo con tasso di vincita eccezionale | Per MT4 / MT5 Funziona meglio su timeframe più bassi, come 1 minuto, 5 minuti e 15 minuti. Caratteristiche principali: Super Signal – Skyblade Edition è un sistema intelligente di segnali progettato specificamente per il trading di tendenza. Utilizza una logica di filtraggio multilivello per identificare esclusivamente i movimenti direzionali forti, supp
Vi presentiamo ON Trade Waves Patterns Harmonic Elliot Wolfe, un indicatore avanzato progettato per rilevare vari tipi di pattern sul mercato utilizzando metodi sia manuali che automatici. Ecco come funziona: Pattern Armonici: Questo indicatore è in grado di individuare pattern armonici che appaiono sul vostro grafico. Questi pattern sono fondamentali per i trader che praticano la teoria del trading armonico, come descritta nel libro di Scott Carney "Harmonic Trading vol 1 & 2". Che li disegniat
Currency Strength Exotics
Bernhard Schweigert
4.88 (33)
ATTUALMENTE SCONTATO DEL 20%! La soluzione migliore per qualsiasi principiante o trader esperto! Questo indicatore è specializzato nel mostrare la forza della valuta per qualsiasi simbolo come coppie esotiche, materie prime, indici o futures. È il primo nel suo genere, qualsiasi simbolo può essere aggiunto alla nona riga per mostrare la vera forza della valuta di Oro, Argento, Petrolio, DAX, US30, MXN, TRY, CNH ecc. Si tratta di uno strumento di trading unico, di alta qualità e conveniente pe
Currency Strength Wizard è un indicatore molto potente che ti fornisce una soluzione all-in-one per un trading di successo. L'indicatore calcola la potenza di questa o quella coppia forex utilizzando i dati di tutte le valute su più intervalli di tempo. Questi dati sono rappresentati in una forma di indice di valuta facile da usare e linee elettriche di valuta che puoi utilizzare per vedere il potere di questa o quella valuta. Tutto ciò di cui hai bisogno è collegare l'indicatore al grafico che
TPSpro RFI Levels
Roman Podpora
4.86 (28)
ISTRUZIONI RUS  /  ISTRUZIONI   ENG  /  Versione MT5 Funzioni principali: Visualizza le zone attive di venditori e acquirenti! L'indicatore mostra tutti i livelli/zone di primo impulso corretti per acquisti e vendite. Quando questi livelli/zone vengono attivati, ovvero dove inizia la ricerca dei punti di ingresso, i livelli cambiano colore e vengono riempiti con colori specifici. Vengono visualizzate anche delle frecce per una percezione più intuitiva della situazione. LOGIC AI - Visualizzazion
BTMM State Engine Pro is a MetaTrader 4 indicator for traders who use the Beat The Market Maker approach: Asian session context, kill zone timing, level progression, peak formation detection, and a multi-pair scanner from a single chart. It combines cycle state logic with a built-in scanner dashboard so you do not need the same tool on many charts at once. What it does Draws the Asian session range; session times can follow broker server offset or be set in inputs. Tracks level progression (L
Linear Trend Predictor : indicatore di tendenza che combina punti di ingresso e linee di supporto direzionale. Funziona secondo il principio di rottura del canale dei prezzi alto/basso. L'algoritmo dell'indicatore filtra il rumore di mercato, tiene conto della volatilità e delle dinamiche di mercato. Capacità dell'indicatore Utilizzando metodi di smoothing, mostra l'andamento del mercato e i punti di ingresso per l'apertura di ordini di ACQUISTO o VENDITA. Adatto per determinare i movimenti d
ATTUALMENTE SCONTATO DEL 40% La soluzione migliore per ogni principiante o trader esperto! Questo indicatore è uno strumento di trading unico, di alta qualità e conveniente perché abbiamo incorporato una serie di caratteristiche proprietarie e una nuova formula. Con un solo grafico è possibile leggere la forza delle valute per 28 coppie Forex! Immaginate come migliorerà il vostro trading perché sarete in grado di individuare l'esatto punto di innesco di una nuova tendenza o di un'opportunità
Easy Breakout
Mohamed Hassan
4.71 (14)
After your purchase, feel free to contact me for more details on how to receive a bonus indicator called VFI, which pairs perfectly with Easy Breakout for enhanced confluence!    Easy Breakout is a powerful price action trading system built on one of the most popular and widely trusted strategies among traders: the Breakout strategy ! This indicator delivers crystal-clear Buy and Sell signals based on breakouts from key support and resistance zones. Unlike typical breakout indicators, it levera
Trend indicator AI
Ramil Minniakhmetov
4.53 (83)
Trend Ai indicator è un ottimo strumento che migliorerà l'analisi di mercato di un trader combinando l'identificazione della tendenza con punti di ingresso utilizzabili e avvisi di inversione. Questo indicatore consente agli utenti di navigare nelle complessità del mercato forex con fiducia e precisione Oltre ai segnali primari, l'indicatore Ai di tendenza identifica i punti di ingresso secondari che si presentano durante i pullback o i ritracciamenti, consentendo ai trader di capitalizzare le
Volatility Trend System - un sistema di trading che fornisce segnali per le voci. Il sistema di volatilità fornisce segnali lineari e puntuali nella direzione del trend, nonché segnali per uscirne, senza ridisegnare e ritardi. L'indicatore di tendenza monitora la direzione della tendenza a medio termine, mostra la direzione e il suo cambiamento. L'indicatore di segnale si basa sui cambiamenti della volatilità e mostra gli ingressi nel mercato. L'indicatore è dotato di diversi tipi di avvisi. Pu
Trend Lines PRO
Roman Podpora
5 (1)
LINEE DI TENDENZA PRO       Aiuta a capire dove il mercato sta realmente cambiando direzione. L'indicatore mostra reali inversioni di tendenza e punti in cui i principali attori rientrano. Vedi  Linee BOS   Cambiamenti di tendenza e livelli chiave su timeframe più ampi, senza impostazioni complesse o rumore inutile. I segnali non vengono ridisegnati e rimangono sul grafico dopo la chiusura della barra. VERSIONE MT 5     -      Svela il suo massimo potenziale se abbinato all'indicatore   RFI LEVE
Order Block Hunter
Noha Mohamed Fathy Younes Badr
5 (10)
Order block hunter indicator is the best indicator for  hunt the order blocks that area where there has been a large concentration of limit orders waiting to be executed Order blocks are identified on a chart by observing previous price action and looking for areas where the price experienced significant movement or sudden changes in direction .This indicator does that for you by using very complicated codes and helps you to take the best areas To buy and sell because it make marks at the best a
GOLD Impulse with Alert
Bernhard Schweigert
4.67 (12)
Questo indicatore è una super combinazione dei nostri 2 prodotti Advanced Currency IMPULSE with ALERT  +   Currency Strength Exotics . Funziona per tutti i time frame e mostra graficamente l'impulso di forza o debolezza per le 8 valute principali più un simbolo! Questo indicatore è specializzato nel mostrare l'accelerazione della forza delle valute per qualsiasi simbolo come oro, coppie esotiche, materie prime, indici o futures. Primo nel suo genere, qualsiasi simbolo può essere aggiunto all
Apollo SR Master è un indicatore di Supporto/Resistenza con caratteristiche speciali che rendono il trading con le zone di Supporto/Resistenza più semplice e affidabile. L'indicatore calcola le zone di Supporto/Resistenza in tempo reale senza alcun ritardo, rilevando i massimi e i minimi dei prezzi locali. Quindi, per confermare la nuova area SR formata, l'indicatore mostra un segnale speciale che segnala che la zona SR può essere presa in considerazione e utilizzata come un vero e proprio segna
KT Gaussian Trend Filter MT4
KEENBASE SOFTWARE SOLUTIONS
KT Gaussian Trend Filter combina il filtraggio gaussiano con la regressione lineare per offrire un’analisi di tendenza chiara e precisa. Genera segnali di acquisto e vendita facili da interpretare, mettendo in evidenza la direzione di lungo periodo del mercato. Caratteristiche Filtro gaussiano completamente personalizzabile: Regola lunghezza e poli per perfezionare il livello di smoothing e migliorare la leggibilità del trend. Regressione lineare avanzata: Raffina ulteriormente il filtraggio ga
Advanced Supply Demand
Bernhard Schweigert
4.91 (299)
Speciale Trading- SCONTO DEL 40% La soluzione migliore per qualsiasi trader principiante o esperto! Questo indicatore è uno strumento di trading unico, di alta qualità e conveniente, perché abbiamo incorporato una serie di funzionalità proprietarie e una nuova formula. Con questo aggiornamento, potrai visualizzare doppie zone di timeframe. Non solo potrai visualizzare un TF più alto, ma anche entrambi, il TF del grafico e il TF più alto: MOSTRA ZONE ANNIDATE. Tutti i trader che operano con Of
Route Lines Prices - è un indicatore progettato per individuare le direzioni di prezzo. La sua interfaccia semplice contiene diversi algoritmi per il calcolo del comportamento dei prezzi e della direzione futura. Questi algoritmi includono il calcolo della volatilità e lo smussamento dei prezzi in base ai timeframe utilizzati. L'indicatore ha un singolo parametro per modificare il valore di " Calculating price values ". Il valore predefinito di 1 fornisce un calcolo automatico bilanciato, che p
PRO Renko System
Oleg Rodin
5 (30)
PRO Renko System è un sistema di trading altamente accurato appositamente progettato per il trading di grafici RENKO. Questo è un sistema universale che può essere applicato a vari strumenti di trading. Il sistema neutralizza efficacemente il cosiddetto rumore di mercato che consente di accedere a segnali di inversione accurati. L'indicatore è molto facile da usare e ha un solo parametro responsabile della generazione del segnale. Puoi facilmente adattare lo strumento a qualsiasi strumento di
Easy Reversal is designed to help traders spot turning points in the market with clear buy and sell signals. The indicator is based on the Keltner Channel but improved with a custom calculation that uses ATR and EMA confirmation. This makes it more reliable and less noisy than standard reversal tools.  The signals from Easy Reversal appear directly from peak candlestick behavior, showing you when price action is reaching exhaustion. A buy signal is generated when a candlestick forms a strong r
Altri dall’autore
Volume Profile Density V2.40 Mostra la distribuzione del volume per livello di prezzo, evidenziando le zone di interesse istituzionale. A differenza del volume tradizionale (nel tempo), indica dove il volume si è realmente concentrato. Principi base: Barre orizzontali = volume scambiato a ciascun prezzo Barra più lunga → volume maggiore Zone rosse = principali supporti/resistenze Utilizzi principali: Identificare supporti e resistenze reali Determinare il POC (Point of Control) Definire la Value
FREE
Iceblock Volume
Vincent Jose Proenca
5 (1)
Frase breve: Iceblock — indicatore MT4 che identifica cluster di alto volume con limitato movimento di prezzo (comportamento simile a iceberg). TF: Funziona su tutti i timeframe (M1–D1). Coppie: Compatibile con Forex, indici, oro e CFD. Impostazioni: VolumeLookback – numero di candele per la media del volume VolumeThreshold – moltiplicatore per considerare il volume anormale ClusterSize – numero di candele vicine per confermare un cluster RangeComparisonPeriod – periodo per la media degli int
FREE
CustomBreakout
Vincent Jose Proenca
Range Breakout EA – Simple Description Concept An automated trading robot for MetaTrader 5 that exploits range breakouts with two key periods: Features Automatic market hours management Customizable Stop Loss and Take Profit Smart Trailing Stop Built-in testing mode for simulation Detailed logs for monitoring How It Works Records extreme prices at the start of the day Waits for a breakout of the secondary range Opens a position in the breakout direction Automatically manages the trade (SL/TP/Tr
FREE
Pivot PDHL Levels
Vincent Jose Proenca
AutoPivot – Indicatore automatico dei punti pivot Indicatore MT4 che mostra i punti pivot (PP, R1/R2/R3, S1/S2/S3) e i livelli del giorno precedente (PDH/PDL). Caratteristiche principali: Adattamento automatico al timeframe del grafico (H4/D1/W1) Zone tra PDH/PDL e il livello di supporto/resistenza più vicino 8 temi di colore preconfigurati Personalizzazione completa di colori, stili di linea e opacità delle zone Etichette compatte con visualizzazione opzionale del prezzo Aggiornamenti automatic
PDHL – simply displays the highs and lows of previous days directly on your chart, providing a quick and visual reference of past key levels. The indicator is lightweight and easily customizable , allowing you to adjust the number of days displayed, the colors, as well as the style and thickness of the lines to suit your preferences. It is designed to be simple and practical, but may not work on all instruments or platforms . Only teste Tested only with CFDs
FREE
VWAP Personnal Custom
Vincent Jose Proenca
VWAP_PC_MQL5 — a simple home-built VWAP indicator showing real-time volume-weighted price levels directly on your MT5 chart. TF: Works on all timeframes. Pair: Compatible with all symbols — Forex, indices, commodities, and stocks. Settings: Applied Price – price type used for VWAP calculation (Close, Typical, Weighted, etc.) Line Color / Width / Style – customize VWAP line appearance Session Reset – optional reset per day or continuous mode How it works (VWAP principle): VWAP (Volume Weighted
FREE
Custom Box CFDs
Vincent Jose Proenca
Range Box Indicator for Trading Sessions This indicator allows traders to visualize and analyze specific time ranges directly on their chart by drawing rectangular boxes for each trading session. Key Features: Customizable session interval: set your own session start and end times. Number of days displayed: choose how many past sessions are visible. Default color and special color for Monday: easily highlight weekly patterns. Adjustable border width: customize the appearance of the rectangles to
FREE
Dynamic Pivot Zones
Vincent Jose Proenca
Dynamic Pivot Zones – Your Level Assistant on the Chart This indicator is a bit like a GPS for your trading . It shows you where the price likes to hang out, where it gets nervous, and where it flies through. No more calculating pivots by hand or guessing support and resistance levels. What it does: Automatically plots H1, H4, and D1 pivots . Shows support and resistance zones : R1, R2, S1, S2. Lines are colored and easy to read , so you can instantly see what’s hot or cold. Why you’ll love it:
FREE
VMS Oscillator
Vincent Jose Proenca
Volume & Move Strength (VMS) Indicator for MT5 The VMS Indicator displays the relationship between trading volume and price movement strength, helping traders assess how well market activity supports price action. How It Works: Measures tick volume as trading activity. Calculates move strength using a normalized True Range (%). Both values can be smoothed (default: 5) and optionally normalized (0–100) for consistency across markets. Plots two lines in a separate window: Blue (Volume) – trading a
FREE
Volume-to-Price Movement Oscillator (VP Oscillator) for MT5 The VP Oscillator highlights the balance (or imbalance) between trading volume and price movement, helping traders spot hidden accumulation, distribution, or weakening trends. How It Works: Calculates each bar’s price range (High–Low) and tick volume. Normalizes both values over a set period (default: 14). Plots the absolute difference between them ×100 — showing how closely price action aligns with trading activity. Interpretation: Hig
FREE
STRUCTURAL TREND LINES - MT4/MT5 Indicator Simple indicator that automatically draws trend lines based on market structure. Features: - 3 degrees of structure detection (short, medium, long term) - Configurable swing strength for each degree - Single color per degree for clean visualization - Adjustable number of lines per degree - Customizable colors and line widths How it works: The indicator identifies swing highs and lows based on the strength parameter, then connects these points to crea
FREE
This indicator allows you to number bars within a trading session for CFDs. It works on GER40, UK100, US30, US100, and US500 and is fully customizable to fit your trading style and chart preferences. Key Features & Parameters: Customizable session interval: define your own session start and end times Option to hide even numbers for a cleaner chart Adjust number distance to position the bar numbers as you prefer Font size and color: choose the size and color that suit your chart Number of days di
FREE
Daily Bar Number CFD
Vincent Jose Proenca
indicator that numbers the bars (candles) in a custom trading session. The indicator allows: Defining the session start time (StartHour and StartMinute) Displaying numbers only on odd bars (if AfficherUniquementImpairs is true) Displaying numbers on the last N days (NbJours) Customizing the color and font size of the text The indicator will loop through the bars of the last N days and, for each day, start counting from the session start time. It will display the bar number (starting at 1) belo
FREE
Adaptive Flow MAs
Vincent Jose Proenca
Adaptive Flow MAs is a moving average indicator designed to naturally adjust to market movements. Unlike traditional averages, it dynamically adapts its periods based on recent volatility and the current trend. The EMA closely follows rapid price swings to capture every impulse, while the SMA remains smoother, providing a stable and reliable reference. With a clean display showing the current adaptive periods, this tool helps traders feel the “flow” of the market without visual clutter. It’s cr
FREE
Better Moving Average
Vincent Jose Proenca
STRUCTURAL TREND LINES - MT4 Indicator Simple indicator that automatically draws trend lines based on market structure. Features: - 3 degrees of structure detection (short, medium, long term) - Configurable swing strength for each degree - Single color per degree for clean visualization - Adjustable number of lines per degree - Customizable colors and line widths How it works: The indicator identifies swing highs and lows based on the strength parameter, then connects these points to create t
FREE
The Candle Activity Visualizer turns your chart into a dynamic heatmap, giving you a clear view of buying and selling pressure. In-Depth Market Insight: Active Zone Detection: The algorithm highlights areas where high volume builds up within a narrow price range, revealing key pressure zones. Real-Time Intensity: Colors adjust in real time, shifting smoothly from cool tones to warmer shades as activity increases. Visual Customization: 5 Color Palettes: Choose from five professionally designed th
Rainbow Price Visualizer v1.21 See where the market really breathes. Turns your MT4 chart into an ultra-precise heatmap that highlights price zones favored by big players. Why it matters 300 price levels at 0.2‑pip resolution — microscopic detail. 8 visual themes (Rainbow, Fire, Ocean…) for instant readibility. Smart opacity: low noise fades, real zones pop. Lightweight rendering with automatic cleanup. Fully customizable: saturation, opacity, resolution, history depth. Bands project into the f
Indicatore a Bolle — Rallentamento del Prezzo + Picco di Volume Uno strumento visivo semplice che mostra quadrati colorati sul grafico quando il prezzo rallenta improvvisamente accompagnato da un picco di volume. (Funzione di riempimento con effetto bolle concentriche) Aiuta a individuare i momenti chiave in cui il mercato si prepara a muoversi. Cosa fa l’indicatore: Rileva i momenti in cui il mercato “esita” prima di muoversi Mostra dove entra grande volume senza variazioni significative di pre
Institutional Flow Indicator A smart volume-based tool that detects institutional activity zones through direct order flow patterns. It reveals where large institutions operate. An advanced volume indicator that filters out noise to identify probable institutional patterns. Key Features Smart cluster detection Automatic identification Signal classification: Violet / Yellow – Institutional Zone – Strong, sustained institutional activity Red / Green – Strong Signal – Significant buying/selling pre
AMD Adaptive MA MT4
Vincent Jose Proenca
5 (1)
Media Mobile Adattiva AMD (AAMA) AAMA è un indicatore di media mobile adattiva per MetaTrader 4 che regola automaticamente la sua reattività in base alle condizioni di mercato. Caratteristiche principali: Media mobile adattiva basata sul Rapporto di Efficienza di Kaufman – reagisce rapidamente durante i trend e filtra il rumore nelle fasi laterali Rilevamento automatico delle 4 fasi di mercato AMD: Accumulazione, Markup (rialzo), Distribuzione, Markdown (ribasso) Adattamento alla volatilità tra
STRUCTURAL TREND LINES - MT4 Indicator Simple indicator that automatically draws trend lines based on market structure. Features: - 3 degrees of structure detection (short, medium, long term) - Configurable swing strength for each degree - Single color per degree for clean visualization - Adjustable number of lines per degree - Customizable colors and line widths How it works: The indicator identifies swing highs and lows based on the strength parameter, then connects these points to create t
Volume Profil MT4
Vincent Jose Proenca
Volume Profile Rectangle – Descrizione del Prodotto Sommario Indicatore interattivo del profilo di volume che mostra un’analisi orizzontale del volume scambiato a ciascun livello di prezzo all’interno di un’area selezionata. Crea automaticamente un rettangolo mobile e visualizza barre colorate che rappresentano la distribuzione del volume rialzista e ribassista. Cosa fa: Mostra il volume orizzontale : Visualizza la distribuzione del volume a ciascun livello di prezzo tramite barre orizzontali An
Proxy OrderFlow MT4
Vincent Jose Proenca
5 (1)
Indicatore basato sul disequilibrio del tick-spread. TF: Funziona su tutti i timeframe (da M1 a D1). Coppie: Compatibile con Forex, indici, oro e CFD (regolazione automatica per JPY, Oro e CFD). Impostazioni: TickWindow (200) – finestra di osservazione dei tick SpreadWeight (1.5) – peso dello spread NormalizationPeriod (20) – periodo di normalizzazione (z-score) Overbought / Oversold (±3.0) – soglie di allerta AlertCooldown (300s) – tempo di raffreddamento tra gli avvisi Conclusione: Proxy Or
Nexus Signal System
Vincent Jose Proenca
DESCRIZIONE TECNICA Nexus Signal System è un indicatore MT4 che combina 12 criteri tecnici per generare segnali di trading. Il sistema analizza la congiunzione di più fattori (trend, momentum, volume, zone di supporto/resistenza) prima di confermare un segnale, riducendo il numero di falsi segnali rispetto agli indicatori che utilizzano un solo criterio. CRITERI DI ANALISI (Punteggio 0–15): Rilevamento pattern (pin bar, engulfing) Analisi Multi-Timeframe (conferma del trend su timeframe superior
NexusSignal Scalping
Vincent Jose Proenca
DESCRIZIONE TECNICA Nexus Signal System è un indicatore MT4 che combina 12 criteri tecnici per generare segnali di trading. Il sistema analizza la congiunzione di più fattori (trend, momentum, volume, zone di supporto/resistenza) prima di confermare un segnale, riducendo il numero di falsi segnali rispetto agli indicatori che utilizzano un solo criterio. CRITERI DI ANALISI (Punteggio 0–15): Rilevamento pattern (pin bar, engulfing) Analisi Multi-Timeframe (conferma del trend su timeframe superior
VR Signal
Vincent Jose Proenca
VolumeRejectionSignals v5.0 Indicatore avanzato di analisi del volume Descrizione generale VolumeRejectionSignals v5.0 è un indicatore tecnico avanzato progettato per identificare con precisione movimenti significativi dei prezzi attraverso un’analisi approfondita dei rifiuti di volume. Combinando la dinamica del flusso di ordini e la struttura del mercato, rileva le zone in cui la pressione di acquisto o vendita diminuisce, permettendo di anticipare inversioni o accelerazioni di tendenza. Sist
Liquidity Compression MT4
Vincent Jose Proenca
5 (1)
Indicatore Istituzionale di Compressione della Liquidità L’indicatore misura in tempo reale il restringimento della liquidità utilizzando la larghezza normalizzata delle Bande di Bollinger, il volume e lo spread medio, per individuare le fasi di compressione prima dei breakout di prezzo. Visualizzazione: Finestra separata in stile professionale, con istogramma “Compression Score” e linea di soglia (“Threshold”). Caratteristiche Principali Rilevamento precoce: Identifica le zone di contrazione p
Mean Reversion Probability – Indicatore di Reversione Statistica Descrizione breve Indicatore istituzionale che calcola la probabilità statistica di un ritorno alla media mobile 200, basato sull’analisi delle sovra-estensioni storiche. Identifica con precisione quantitativa le zone di affaticamento del mercato. Caratteristiche principali Analisi statistica avanzata – Costruisce un database di oltre 500 estensioni storiche per calcolare probabilità reali Punteggio di probabilità 0–99% – Quantif
WBP Chart Signals
Vincent Jose Proenca
Italiano – WBP Chart Signals – Indicatore di pressione di acquisto/vendita multi-timeframe Descrizione: WBP Chart Signals è un indicatore avanzato che misura la pressione del mercato attraverso l’analisi di volume, spread e price action. Ideale per i trader che desiderano segnali precisi con conferma multi-timeframe e analisi in stile istituzionale. Caratteristiche principali: Weighted Buy Pressure (WBP): Algoritmo proprietario che combina VWAP, MA200, forza del volume, liquidità e momentum Ana
ARB è un indicatore progettato per identificare opportunità di breakout ad alta probabilità, grazie a un sistema di canali ATR adattivi e a un modello di punteggio multifattoriale preciso (0–100). Combina volatilità, volume, momentum e tendenza multi–timeframe per offrire segnali filtrati, visivi e utilizzabili in tempo reale. PRINCIPI DI FUNZIONAMENTO L’indicatore si basa sul concetto di Adaptive Range Breakout (ARB) , un approccio moderno al trading di rotture che regola automaticamente le sog
Filtro:
Nessuna recensione
Rispondi alla recensione