PZ Harmonacci Patterns
- Göstergeler
- Sürüm: 12.0
- Güncellendi: 16 Temmuz 2024
- Etkinleştirmeler: 20

Trade smarter, not harder: Empower your trading with Harmonacci Patterns
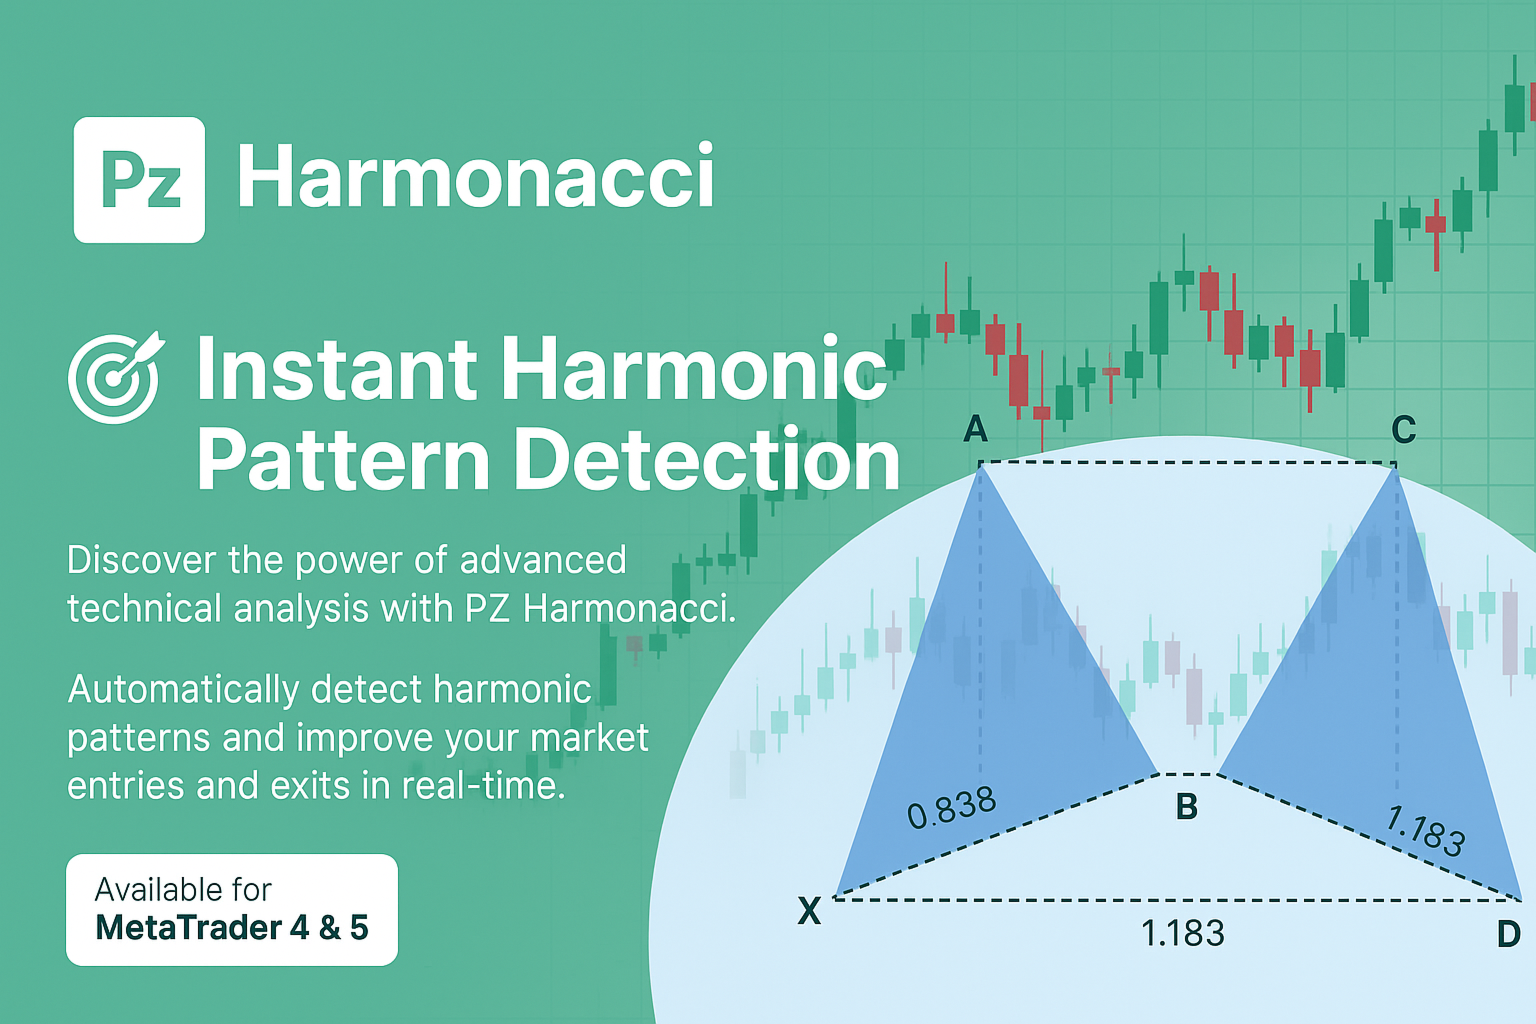
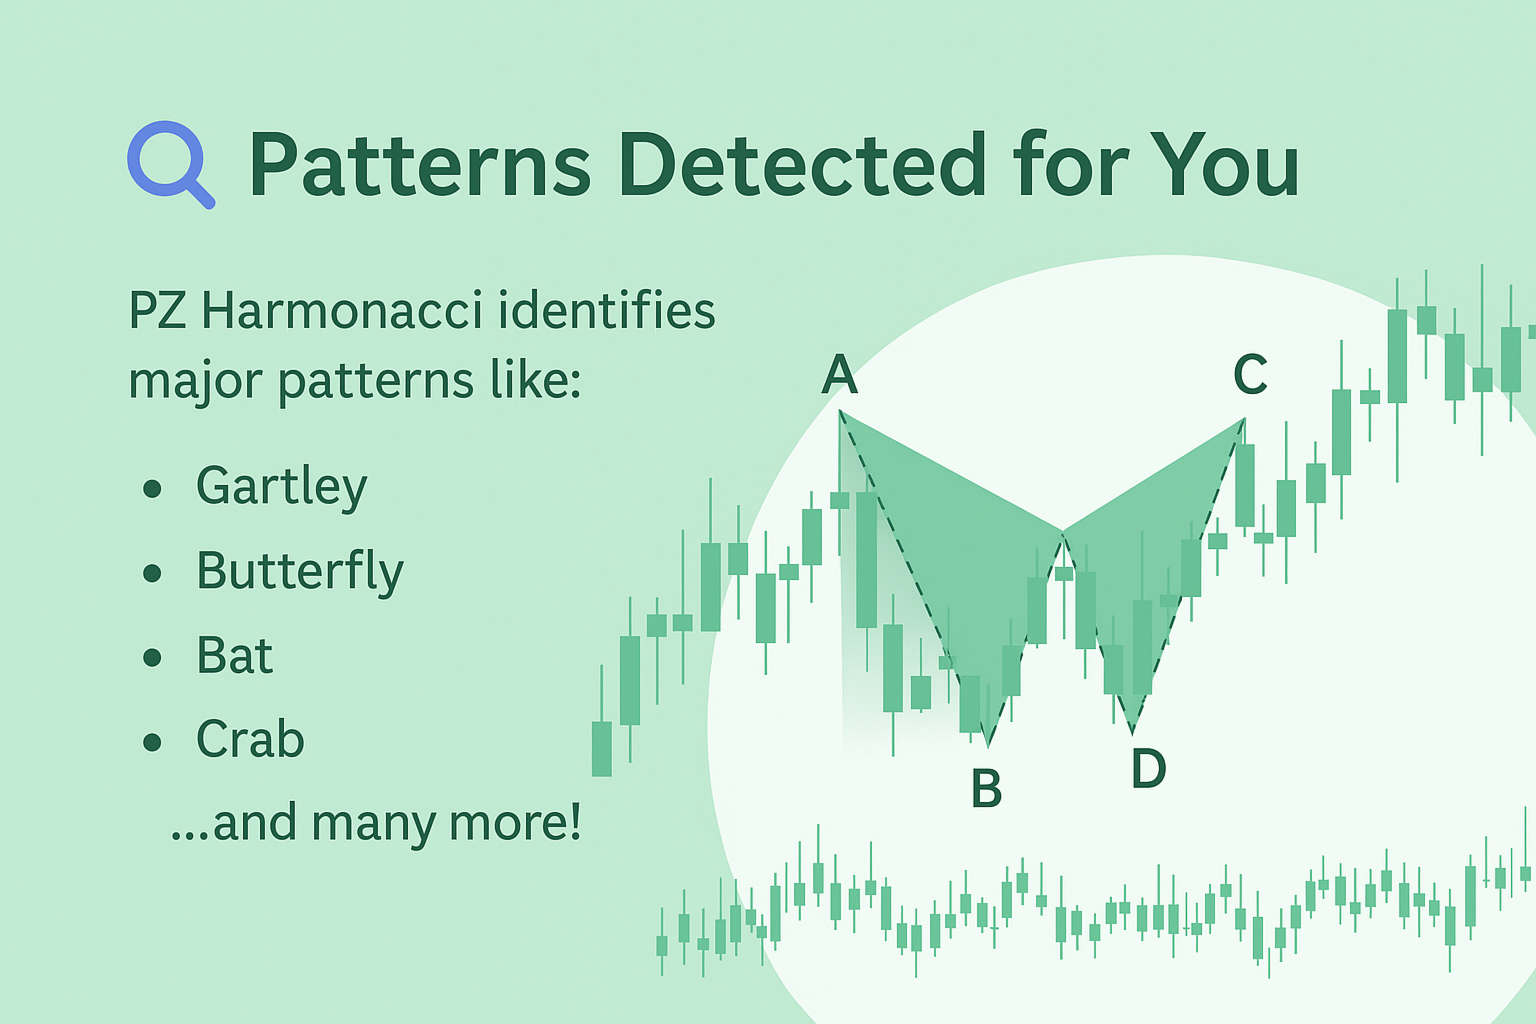
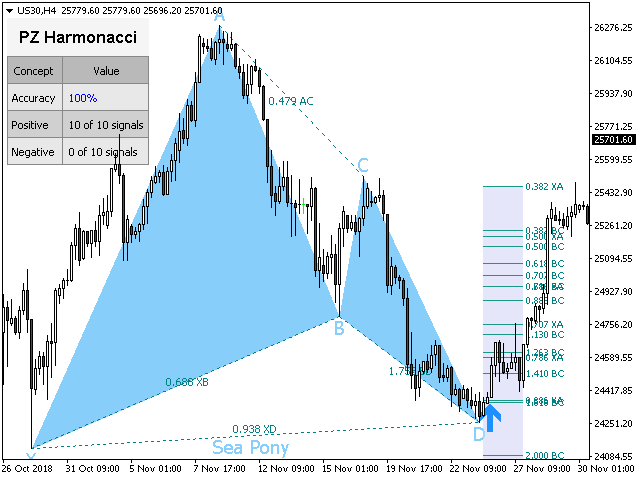
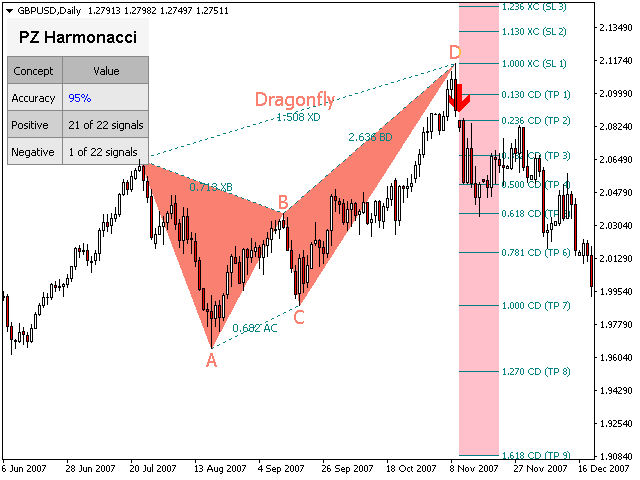
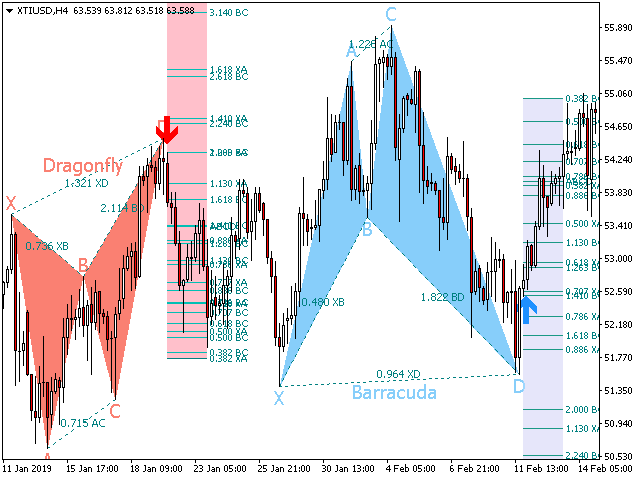
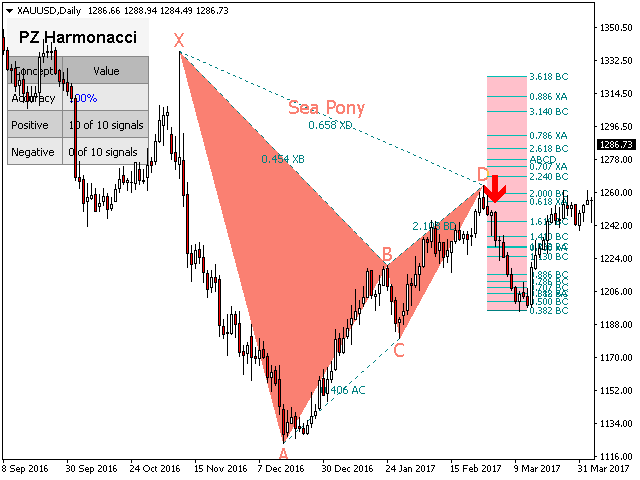
This is arguably the most complete harmonic price formation auto-recognition indicator you can find for the MetaTrader Platform. It detects 19 different patterns, takes fibonacci projections as seriously as you do, displays the Potential Reversal Zone (PRZ) and finds suitable stop-loss and take-profit levels.
[ Installation Guide | Update Guide | Troubleshooting | FAQ | All Products ]
- It detects 19 different harmonic price formations
- It plots primary, derived and complementary Fibonacci projections (PRZ)
- It evaluates past price action and displays every past pattern
- The indicator analyzes its own quality and performance
- It displays suitable stop-loss and take-profit levels
- It uses breakouts to signal suitable trades
- It plots all the pattern ratios on the chart
- It implements email/sound/visual alerts
Inspired by Scott M. Carney's book, this indicator has been designed to fulfill the needs of the most purist and exigent traders. However, it implements a twist to make it easier to trade: it waits for a Donchian breakout in the right direction before signaling the trade, making its signals very reliable.
- Fibonacci projections are vector-independent
- It implements email/sound/push alerts
- It plots the ABCD projection
Important: Some pattern names have been renamed to self-explanatory alternatives to comply with a trademark complaint from Mr. Scott M. Carney, who owns the following trademarks in the USA: Harmonics, Harmonic Trading, Bat Pattern, Butterfly Pattern, Shark Pattern, Crab Pattern and Five-O Pattern.
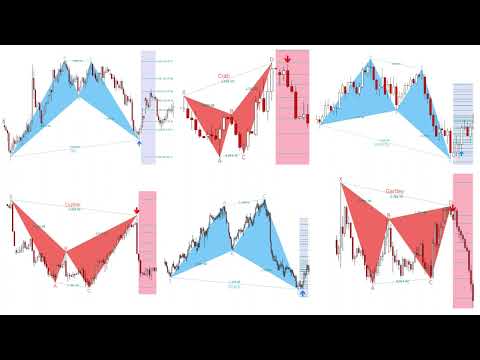
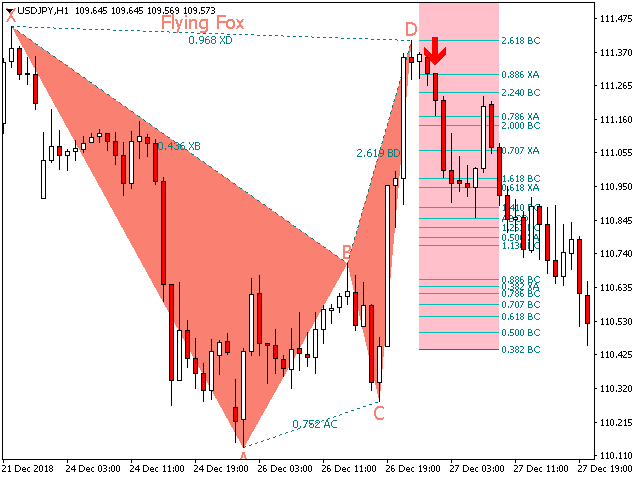
Supported Harmonic Price Formations
| Name | Min XB | Max XB | Min AC | Max AC | Min DB | Max BD | Min XD | Max XD |
|---|---|---|---|---|---|---|---|---|
| Flying Fox | 0.382 | 0.5 | 0.382 | 0.886 | 1.618 | 2.618 | 0.886 | 0.886 |
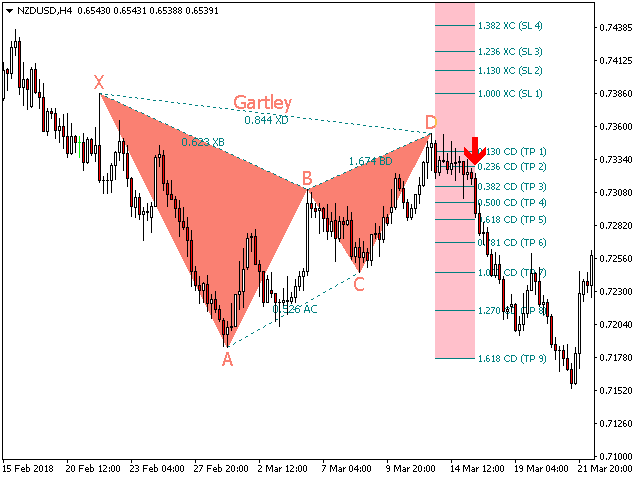
| Gartley | 0.618 | 0.618 | 0.382 | 0.886 | 1.272 | 1.618 | 0.786 | 0.786 |
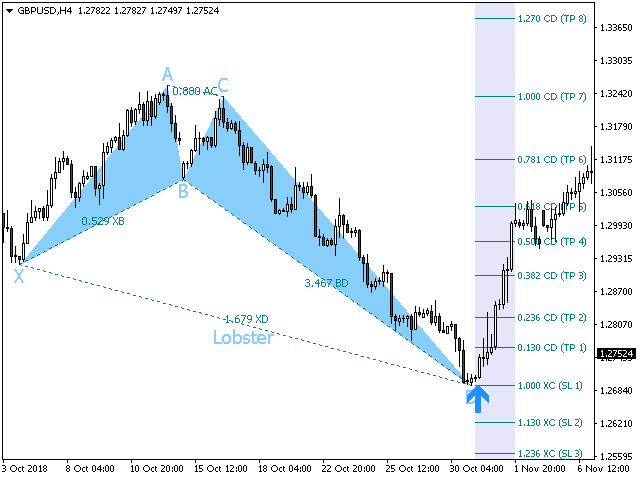
| Lobster | 0.382 | 0.618 | 0.382 | 0.886 | 2.24 | 3.618 | 1.618 | 1.618 |
| Dragonfly | 0.718 | 0.718 | 0.382 | 0.886 | 1.618 | 2.618 | 1.272 | 1.618 |
| Cypher | 0.382 | 0.618 | 1.13 | 1.414 | 1.272 | 2.0 | 0.786 | 0.786 |
| Barracuda | - | - | 1.13 | 1.618 | 1.618 | 2.24 | 0.886 | 1.13 |
| Alt Flying Fox | 0.382 | 0.382 | 0.382 | 0.886 | 2.0 | 3.618 | 1.13 | 1.13 |
| Deep Lobster | 0.886 | 0.886 | 0.382 | 0.886 | 2.618 | 3.618 | 1.618 | 1.618 |
| White Swan | 1.382 | 2.618 | 0.236 | 0.5 | 1.128 | 2.0 | 1.126 | 2.618 |
| Black Swan | 0.382 | 0.724 | 2.0 | 4.237 | 0.5 | 0.886 | 0.382 | 0.886 |
| Max Bat | 0.382 | 0.618 | 0.382 | 0.886 | 1.272 | 2.618 | 0.886 | 0.886 |
| Max Gartley | 0.382 | 0.618 | 0.382 | 0.886 | 1.128 | 2.236 | 0.618 | 0.786 |
| Max Dragonfly | 0.618 | 0.886 | 0.382 | 0.886 | 1.272 | 2.618 | 1.272 | 1.618 |
| Alt Barracuda | 0.446 | 0.618 | 0.618 | 0.886 | 1.618 | 2.618 | 1.128 | 1.128 |
| A Lobster | 0.276 | 0.446 | 1.128 | 2.618 | 1.618 | 2.618 | 0.618 | 0.618 |
| A Dragonfly | 0.382 | 0.618 | 1.128 | 2.618 | 1.272 | 1.272 | 0.618 | 0.786 |
| A Flying Fox | 0.382 | 0.618 | 1.128 | 2.618 | 2 | 2.618 | 1.128 | 1.128 |
| A Gartley | 0.618 | 0.786 | 1.128 | 2.618 | 1.618 | 1.618 | 1.272 | 1.272 |
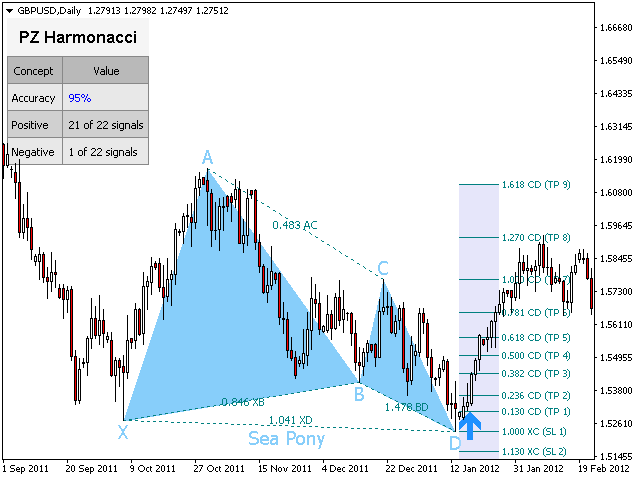
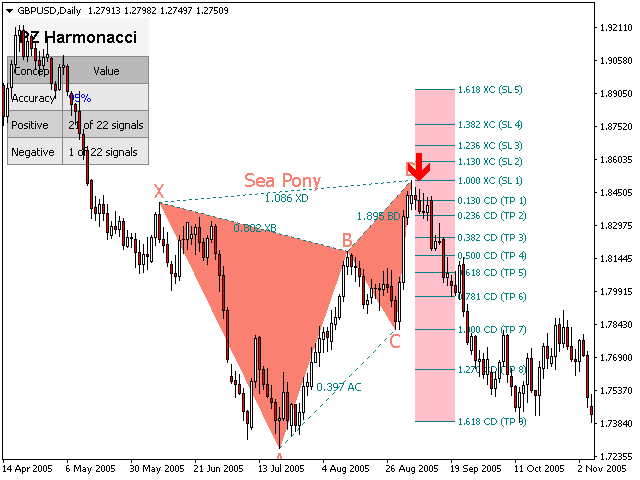
| Sea Pony | 0.128 | 3.618 | 0.382 | 0.5 | 1.618 | 2.618 | 0.618 | 3.618 |
Input Parameters
- Amplitude - This parameter controls the size of the patterns to be found in the chart.
- Deviation - Algorithmic wiggle room for pattern recognition. Increase it to find more patterns.
- Breakout Period - Donchian breakout period for the trading signals.
- Max History Bars - Amount of history bars to evaluate when the indicator loads.
- Display Stats - Enable or disable performance screen stats.
- Display Points - Display price point labels (X, A, B, C, D labels).
- Display Ratios - Display pattern ratios.
- Display Projections - Display the Potential Reversal Zone (PRZ)
- Display SL/TP Levels - Display suitable stop-loss and take-profit levels.
- Pattern Settings - Choose what patterns to scan for: disable all those you do not use.
- Drawing Settings - Configure the colors of bullish and bearish patterns, as well as font sizes.
- Ratios - Enable or disable ratios and choose your own ratio colors.
- Projections - Display or hide the Fibonacci projections on the chart.
- Breakouts - Enable or disable breakouts, and set your desired arrow sizes and colors.
- Alerts - Enable display/email/push/sound alerts for breakouts, patterns or both
Author
Arturo López Pérez, private investor and speculator, software engineer and founder of PZ Trading.


I just bought this indicator last night, harmonics looks very promising. I put two trades in and checked them the morning after, won both by 40 pips. I will be writing a review further on detailing my progress, I know 299 credits is a lot to spend for people but so far so good.