Meravith

5

做市商工具。

Meravith 将:

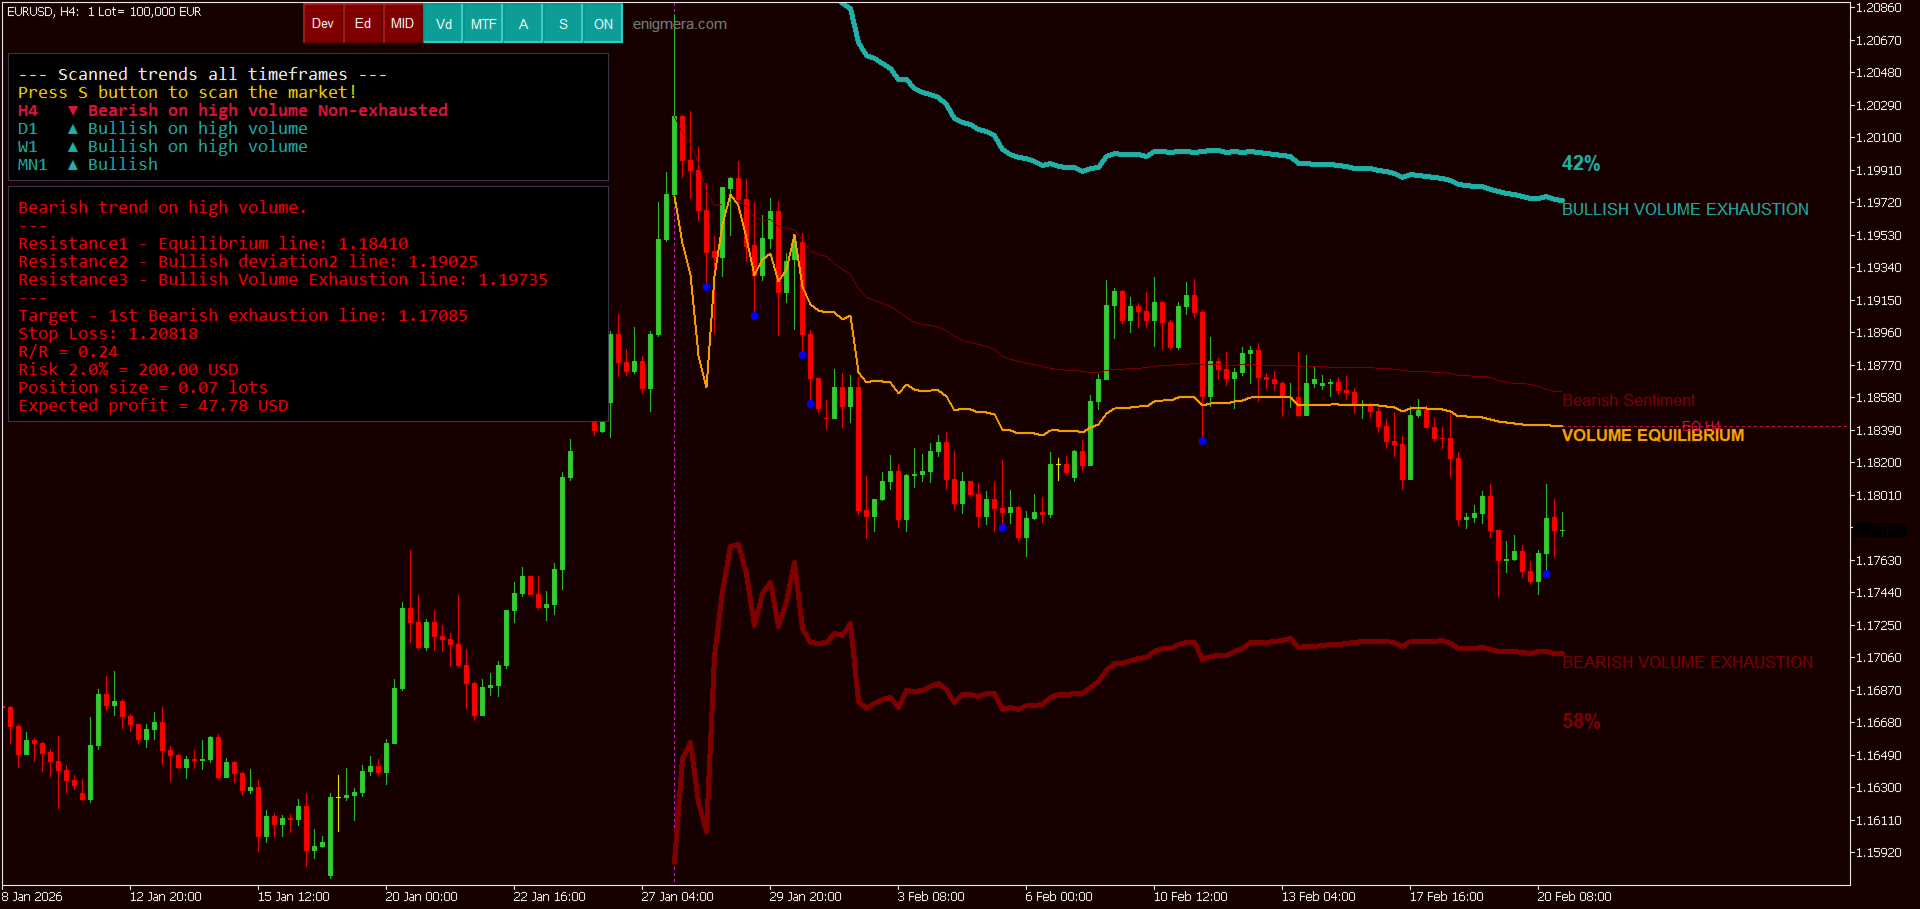
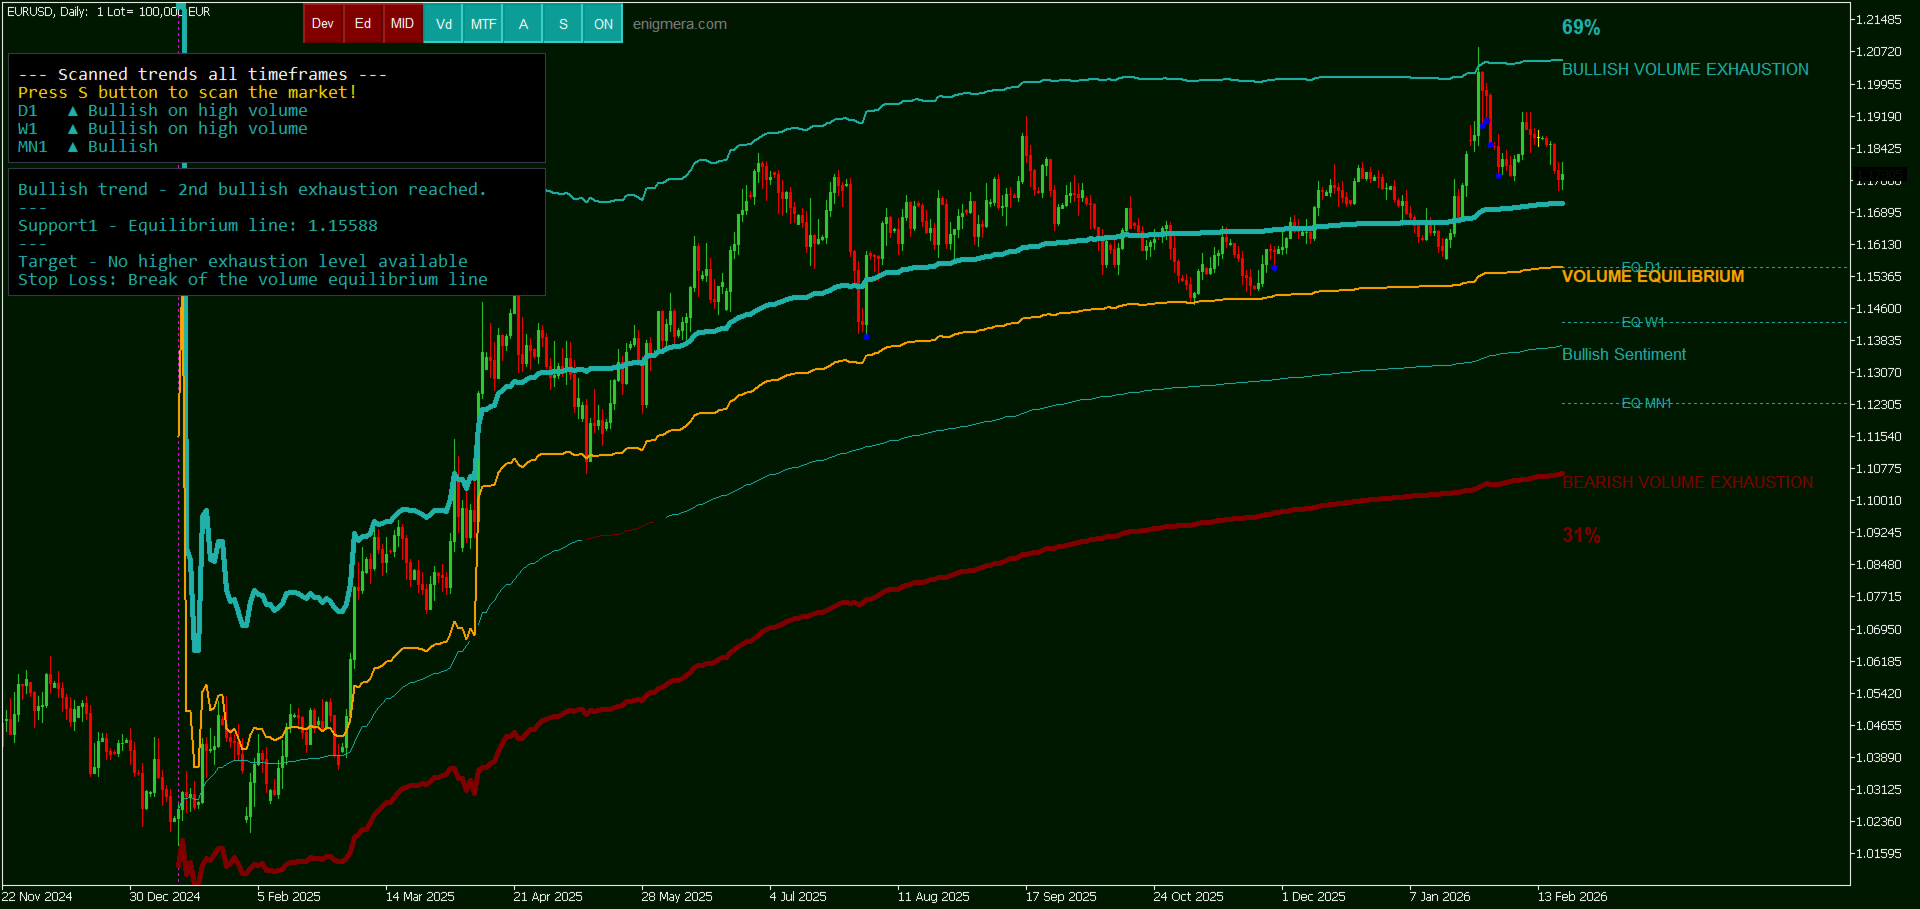
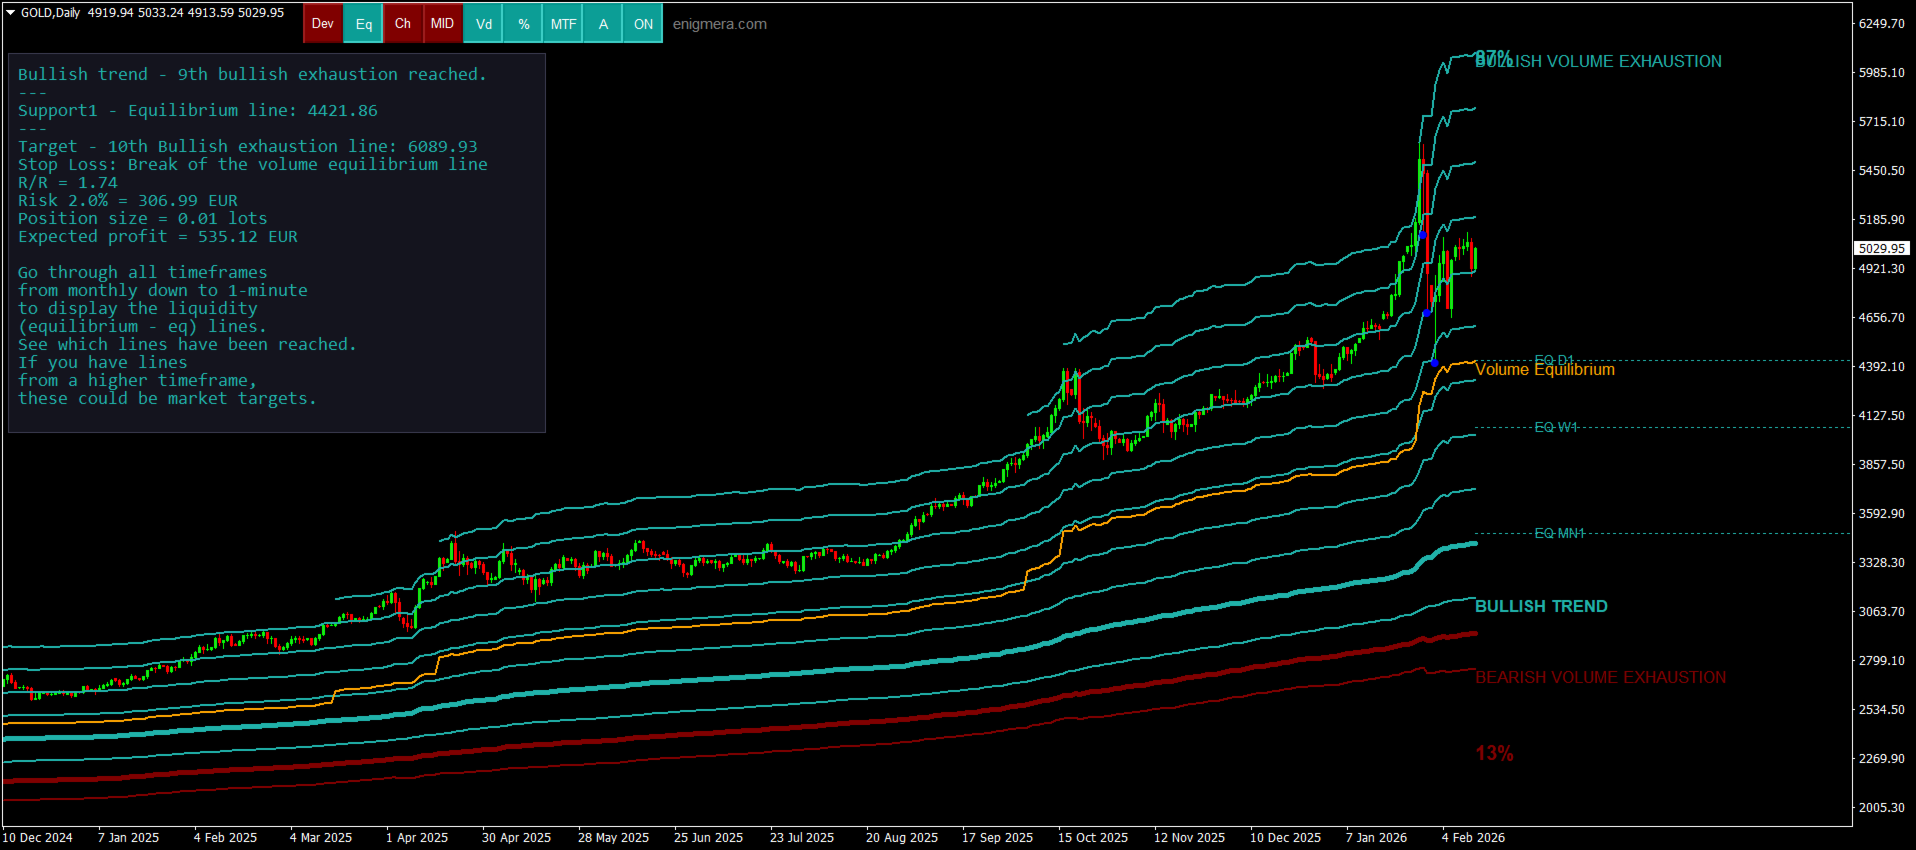
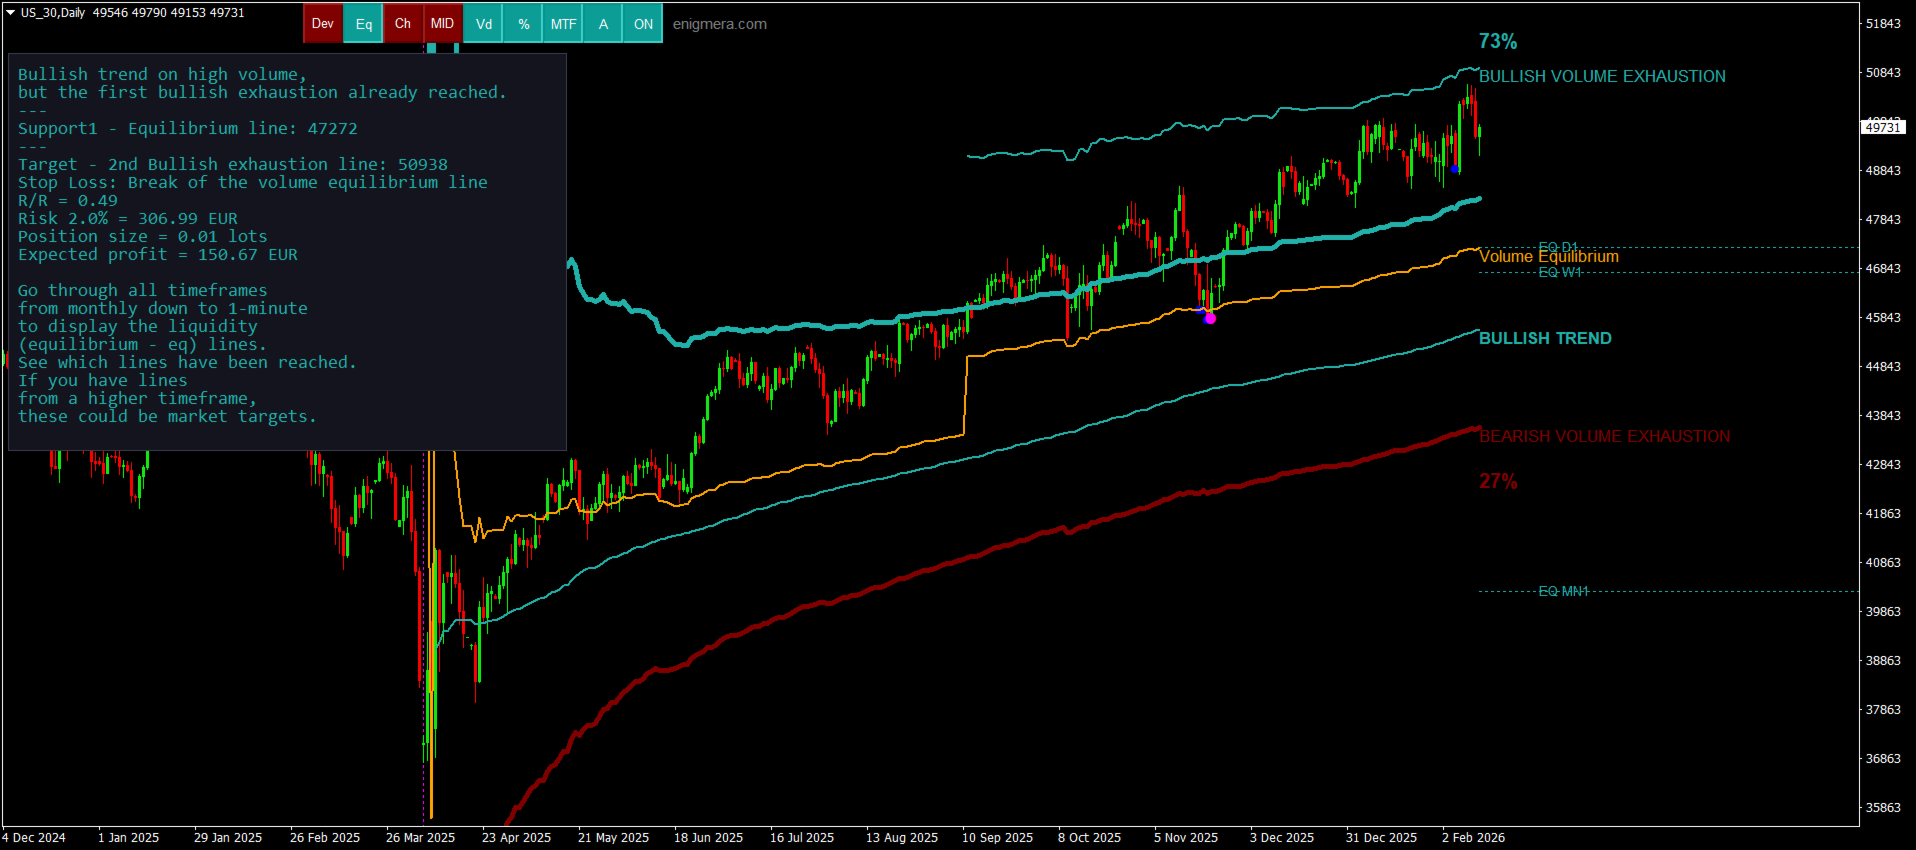
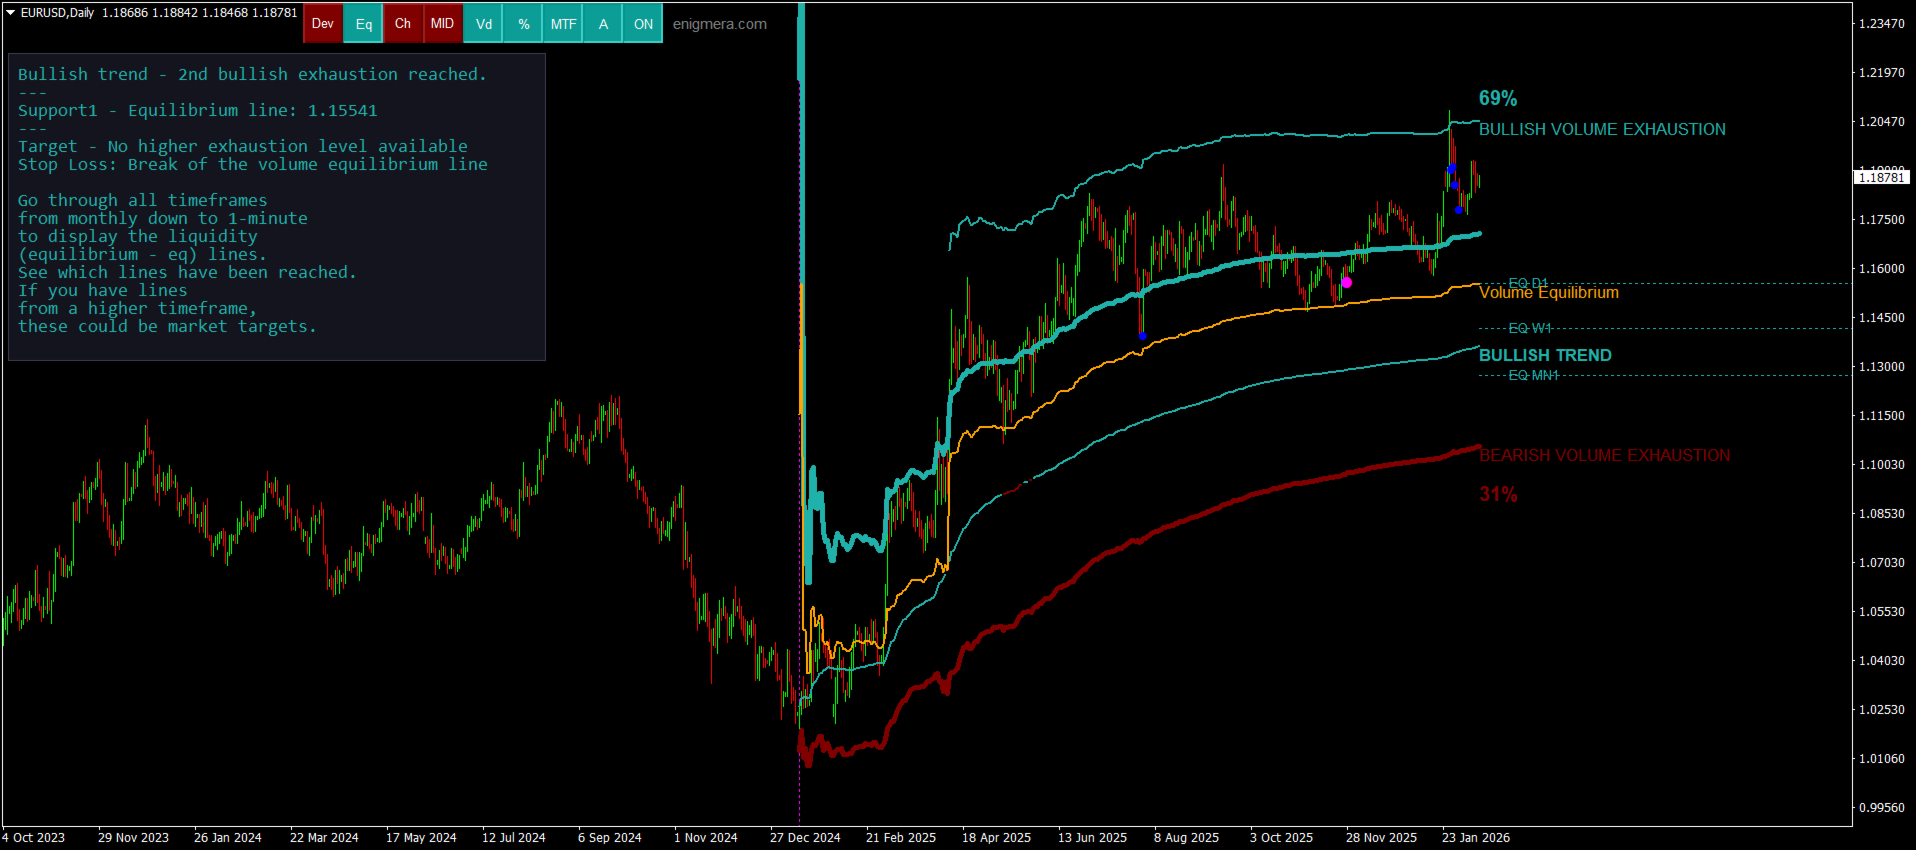
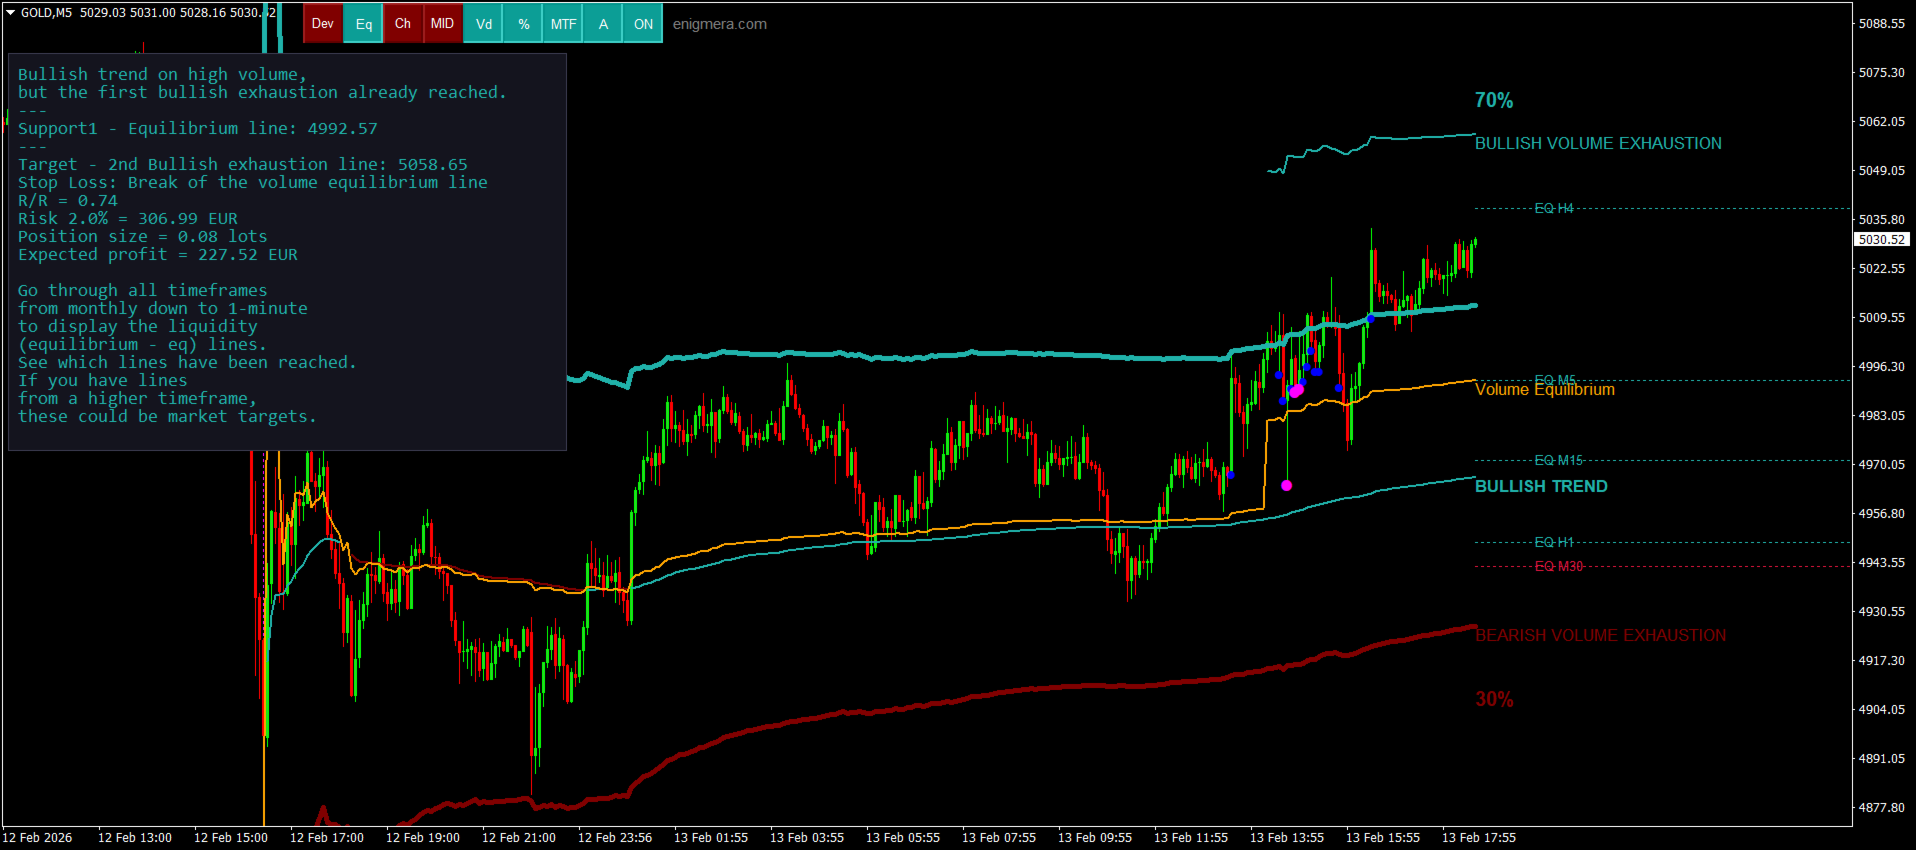
分析所有时间周期并显示当前正在运行的趋势。
标注流动性区域(成交量均衡区),即多头与空头成交量相等的位置。
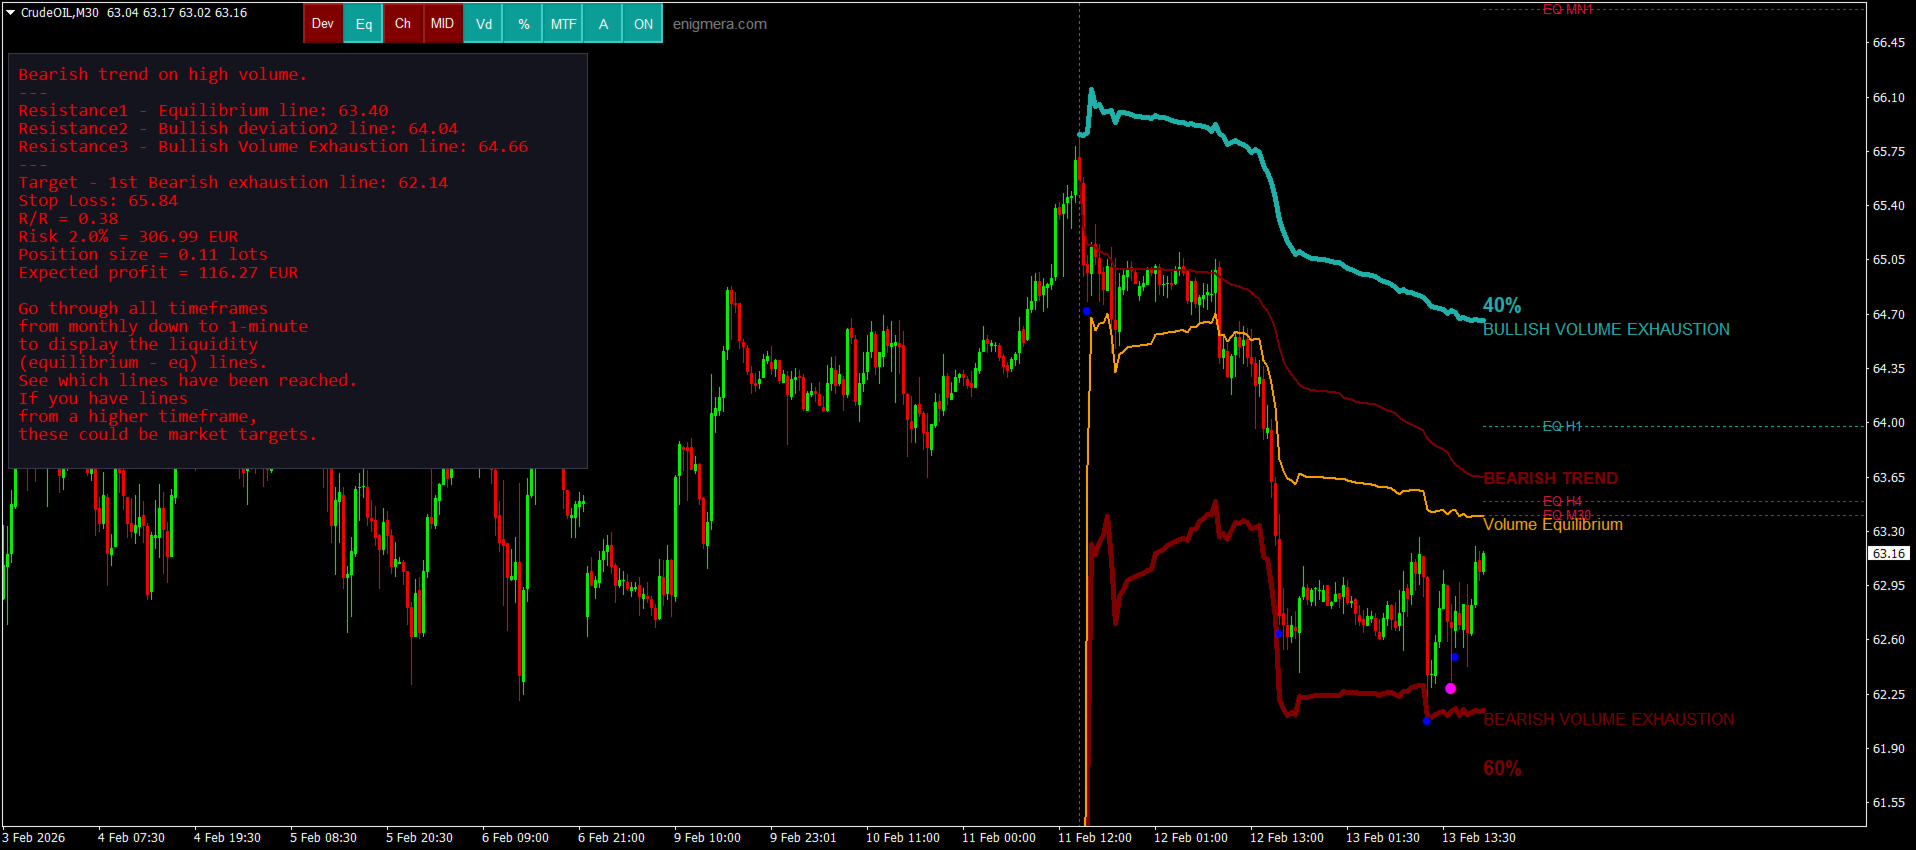
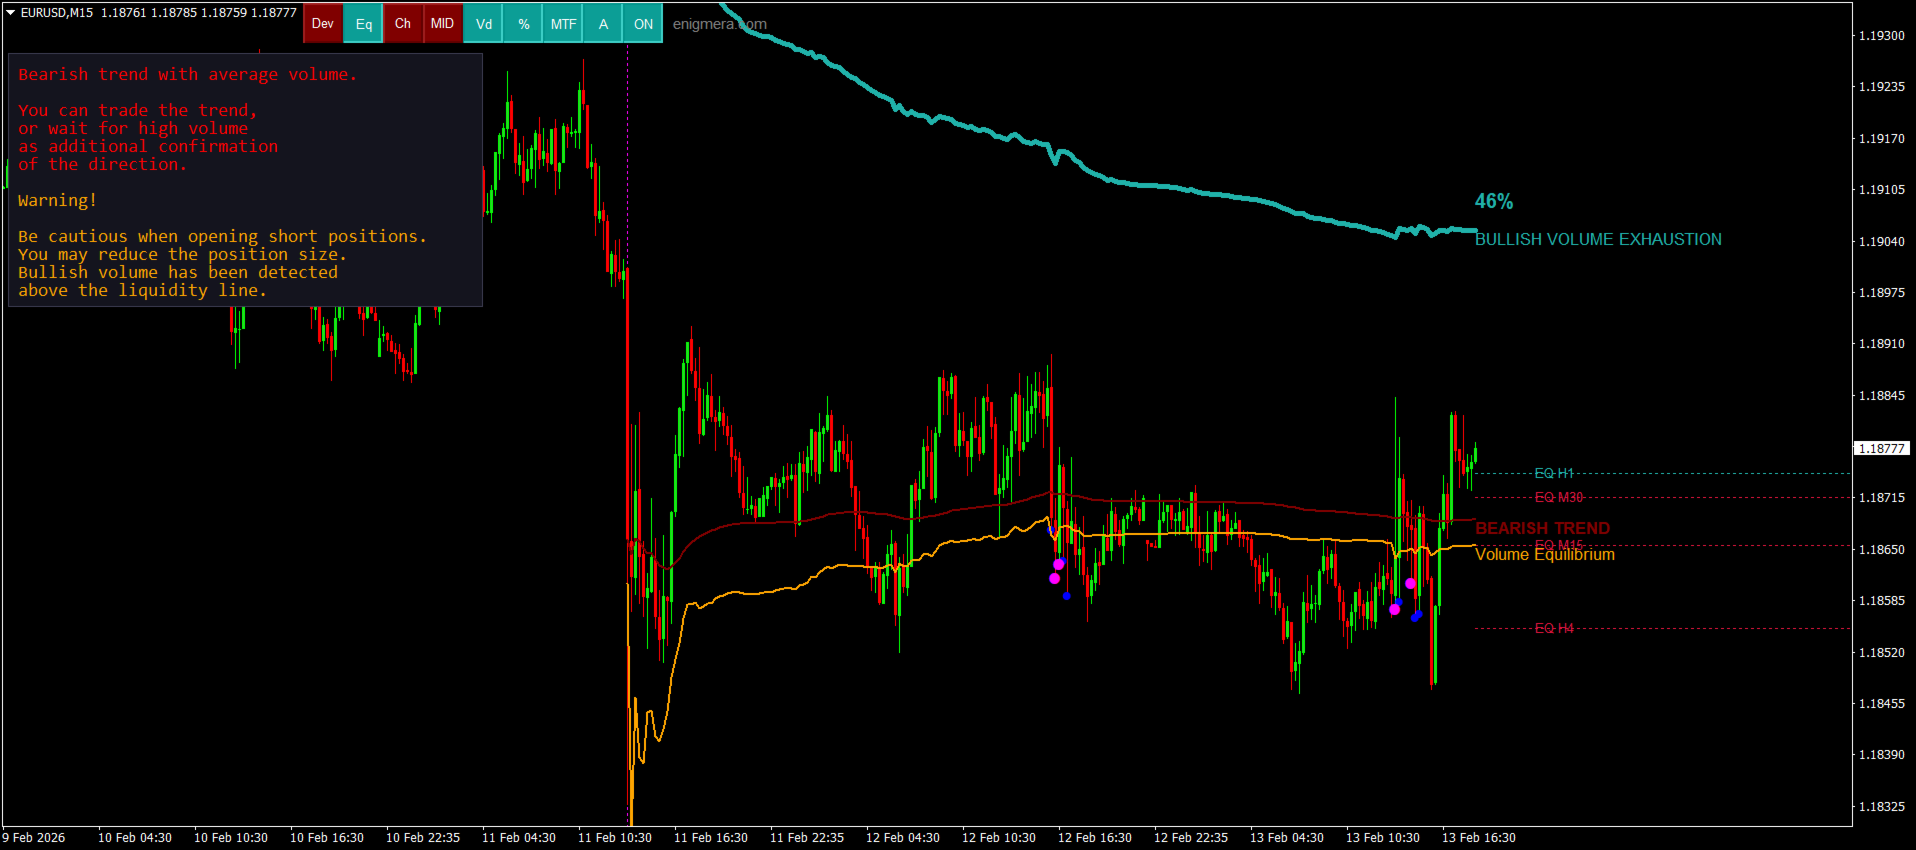
在您的图表上直接显示来自不同时间周期的所有流动性水平。
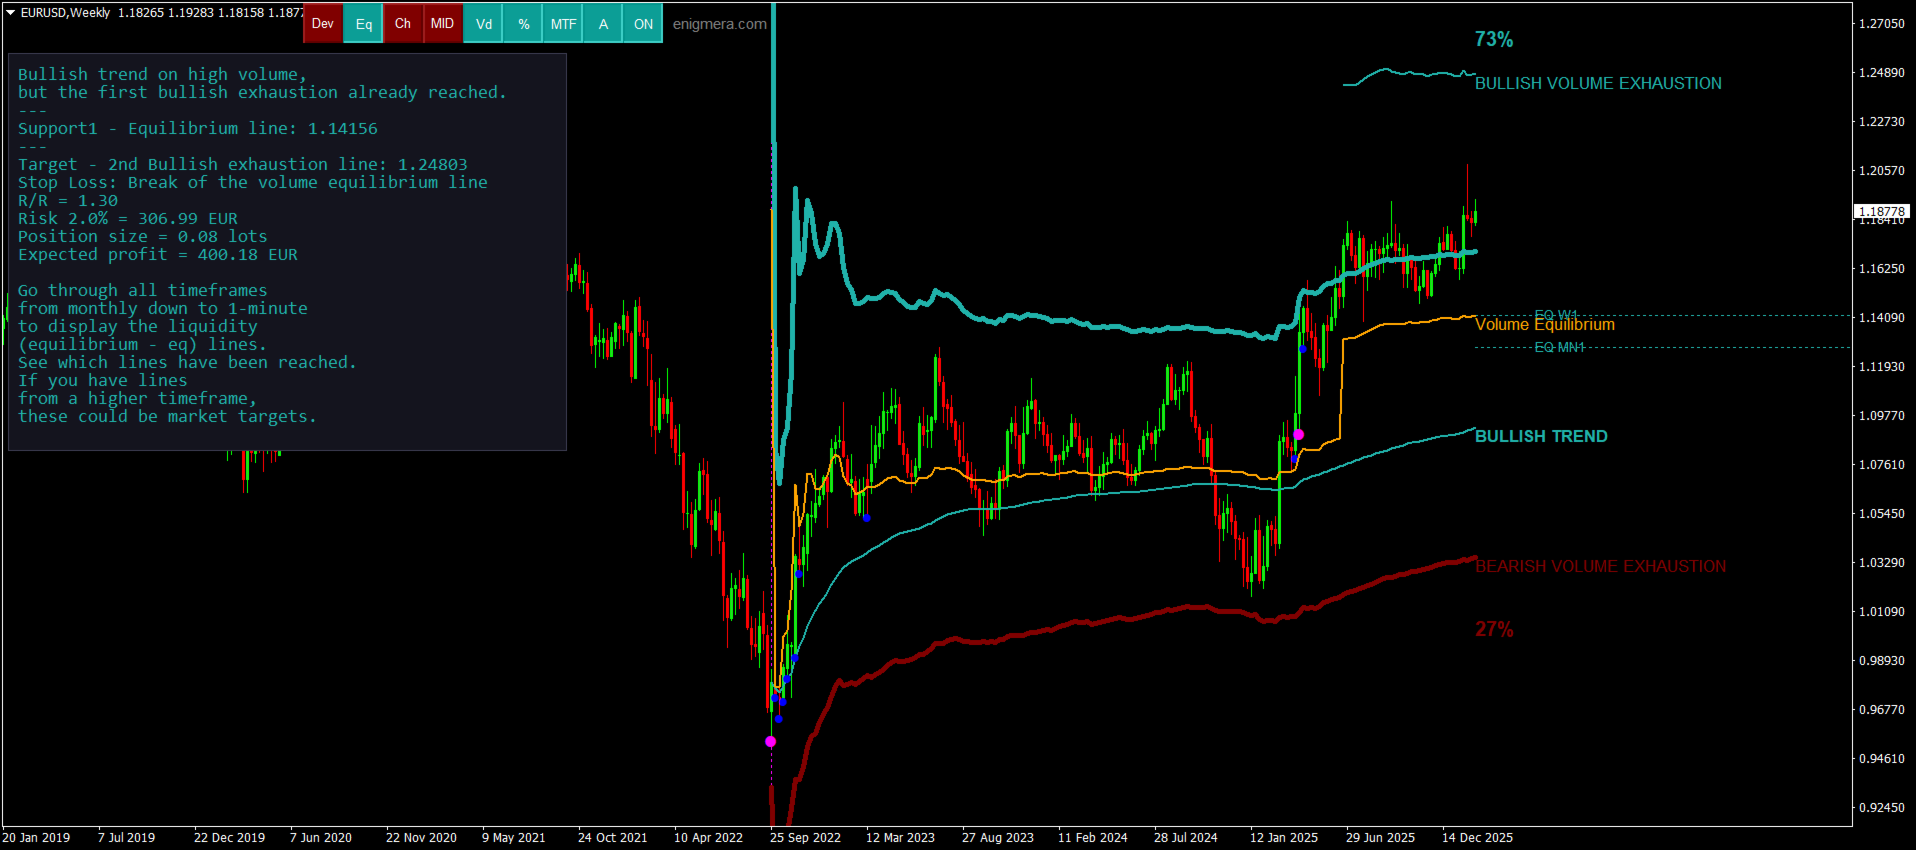
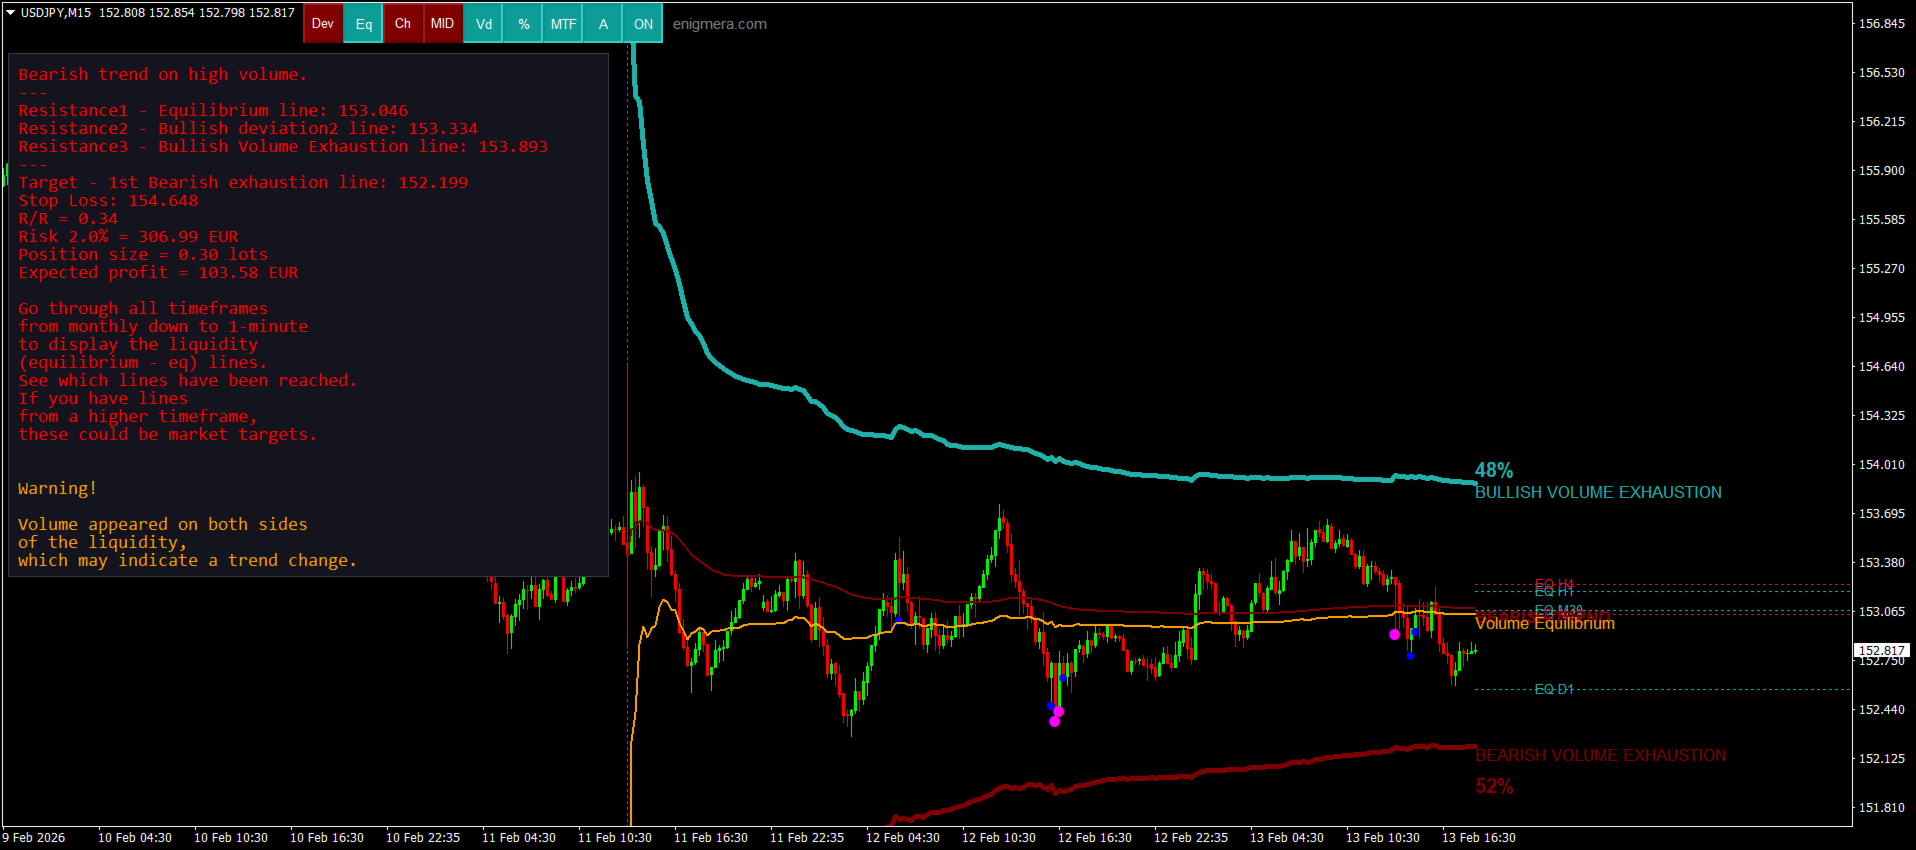
生成并展示基于文本的市场分析供您参考。
根据当前趋势计算目标位、支撑位和止损位。
计算交易的风险回报比。
根据您的账户余额计算仓位大小,并估算潜在利润。

在市场出现重大变化时,Meravith 还会发出警告。

指标的主要线条:

多头/空头成交量衰竭线 —— 作为目标位使用。
趋势线 —— 指示市场趋势方向。根据市场是多头还是空头而改变颜色,并作为趋势支撑。其颜色主要反映市场情绪。
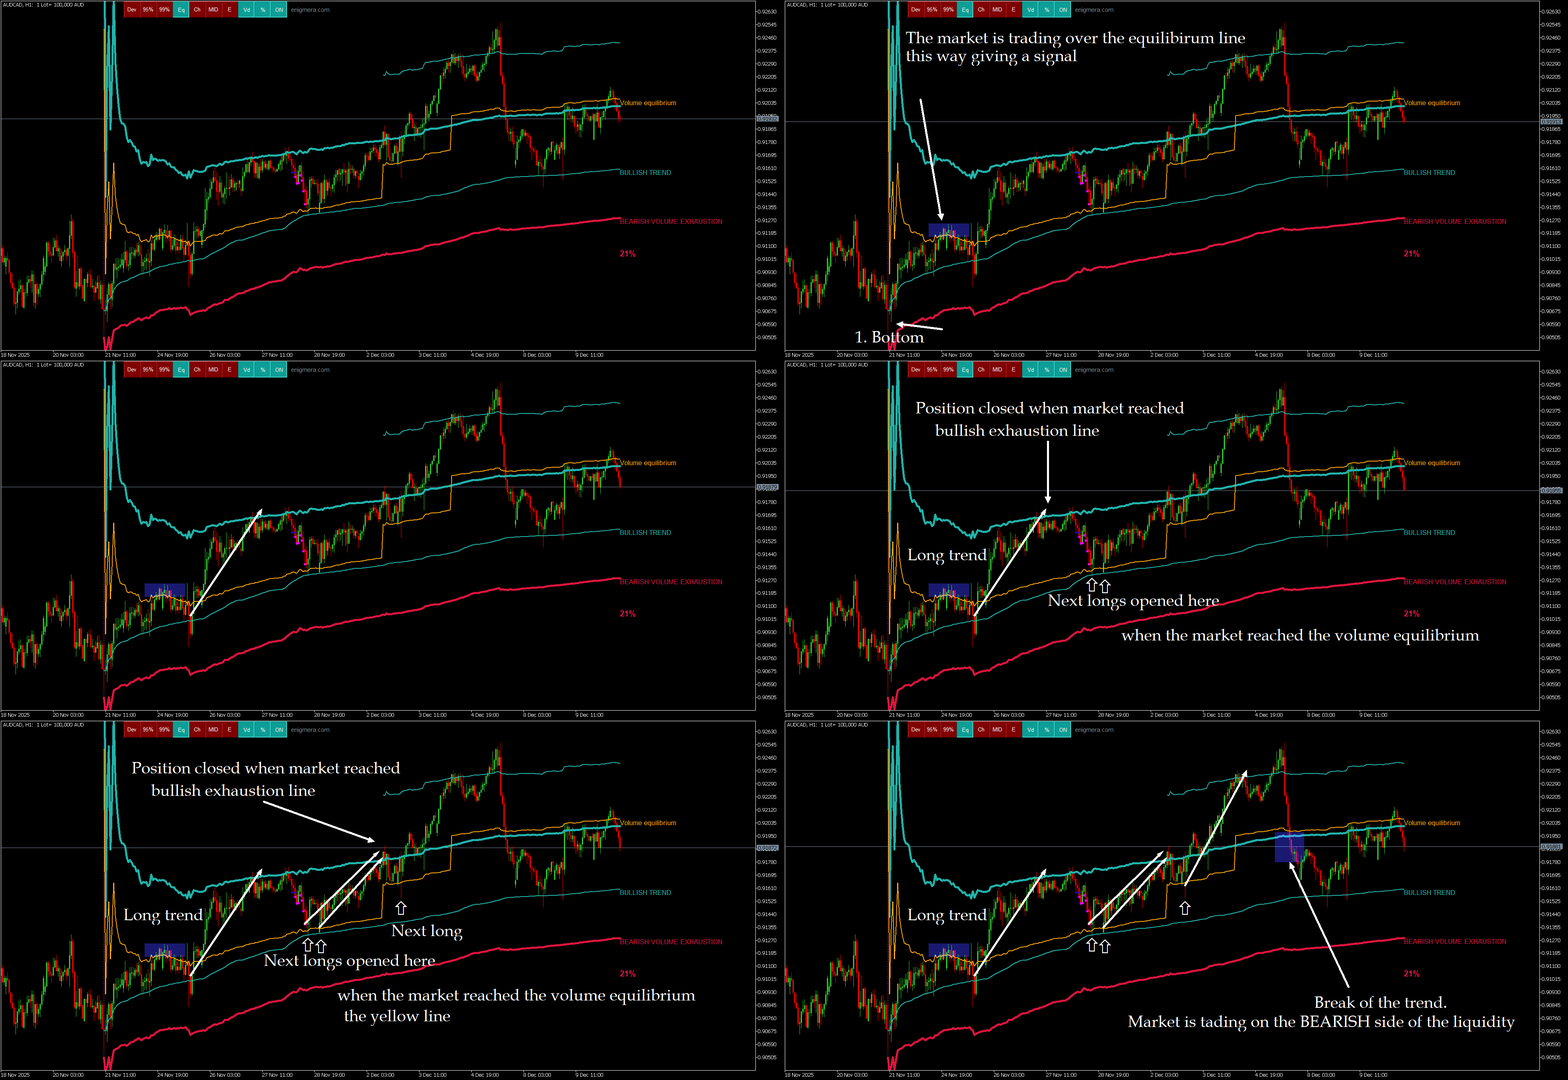
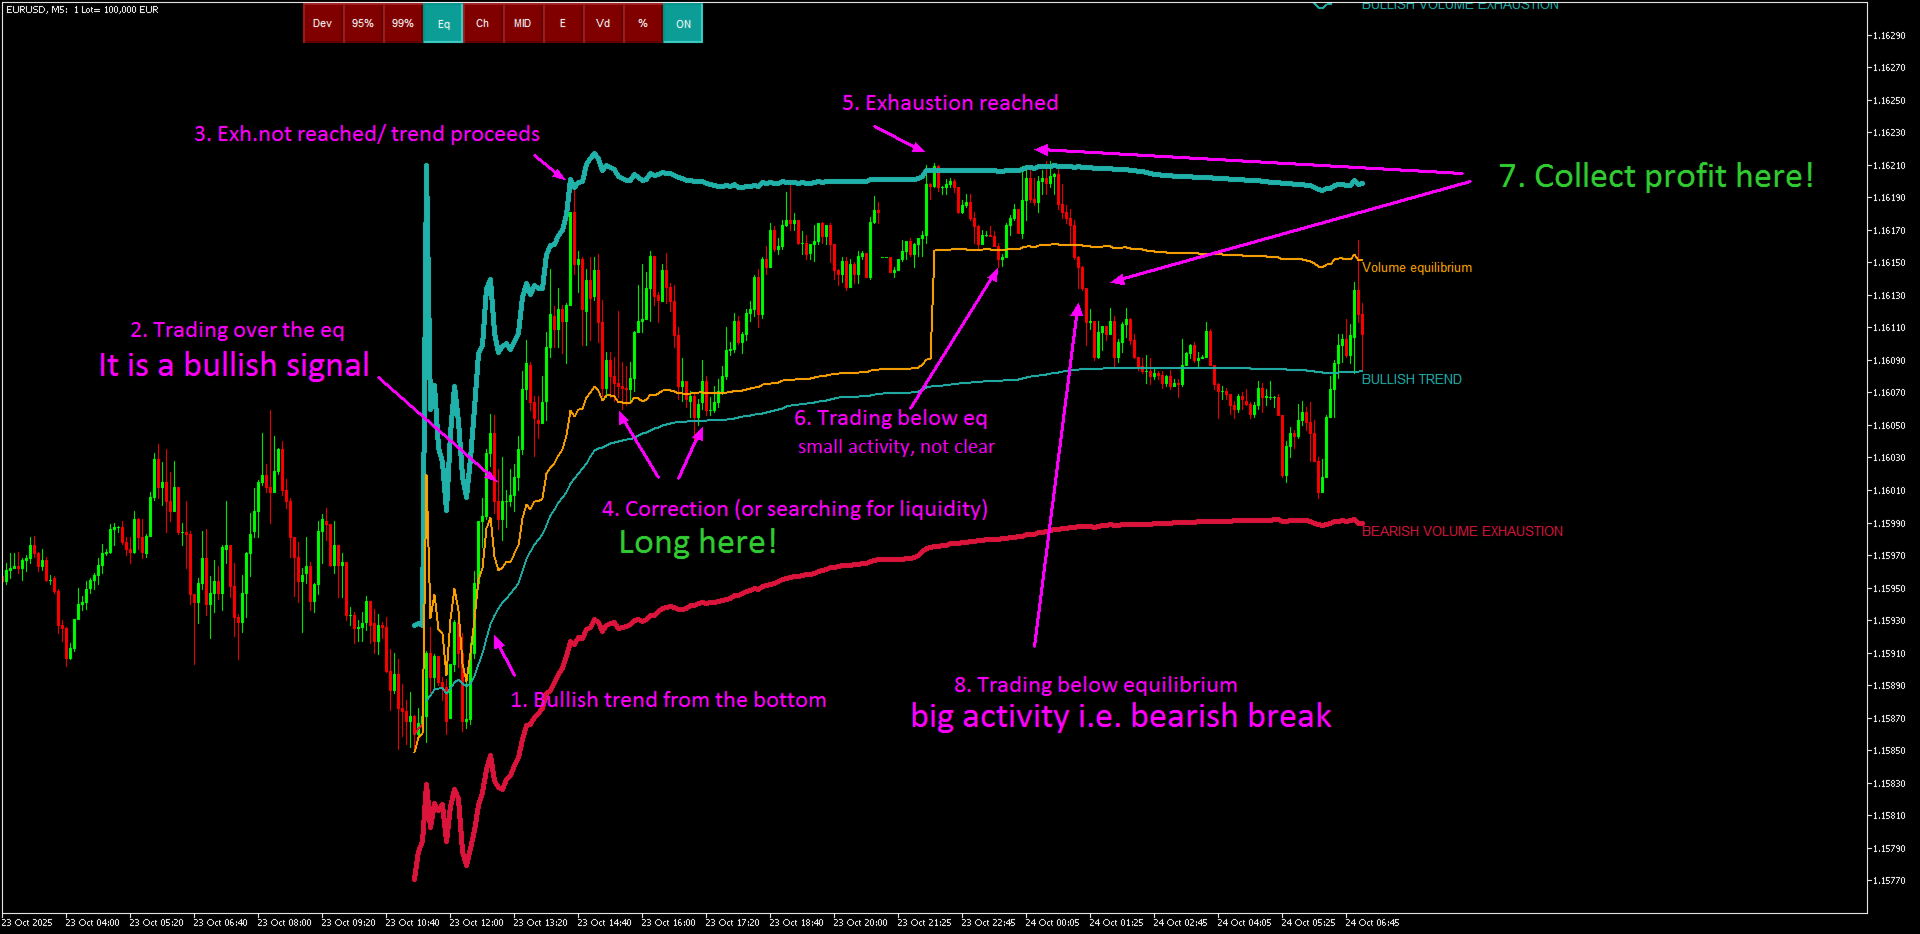
成交量均衡线(Eq)—— Eq(Volume Equilibrium)是系统的核心。它表示买卖双方成交量的平衡点,即市场流动性所在位置。向上突破 Eq 表示多头倾向,向下突破 Eq 表示空头倾向。突破后,应等待回调——当价格回到相反趋势的偏离线或衰竭线附近时。

使用方法:只需将其添加到图表中。

Meravith 可以分析一切——趋势和回调。

趋势线与某条成交量衰竭线之间的距离越大,说明该方向的成交量越高。
趋势线可用于开仓,衰竭线可用于止盈。

Meravith 在图表上内置按钮,使操作更加快捷高效——所有核心功能都可以直接在图表上开启或关闭。各按钮功能如下:

DEV – 显示支撑线的双重偏离,当趋势内部成交量较高时,可作为额外支撑位。
Eq – 成交量均衡线。即市场流动性线,多头成交量等于空头成交量。
CH – 显示完整的支撑通道,以便更清晰地观察结构。
MID – 标记整个走势的中点(50%),以及 0% 和 100% 水平。
Vd – 标示与平均值相比成交量偏离异常高的K线。
% – 以百分比形式比较多头和空头通道。
MFT – 按下此按钮(多时间周期),然后切换查看所有时间周期。指标将自动计算所有流动性水平,并在所选时间周期上显示。每个时间周期都会显示其自身的流动性水平以及更高时间周期的水平,不显示更低时间周期的水平。该按钮可用于显示或隐藏这些水平。
A – 分析。此按钮用于显示或隐藏指标生成的市场文本分析。
ON / OFF – 完全开启或关闭指标。

适用于 MT4、MT5 和 TradingView。

建议:

货币对:所有货币对,所有市场
时间周期:所有时间周期
最低入金:无最低要求
账户类型:无限制
经纪商:无限制

购买前:

请在 MetaTrader 测试器中进行测试。如有任何问题,请通过我的 MQL5 个人资料向我发送消息。
购买后提供完整支持及附加资料。

评分 3
igivaka
93
igivaka 2026.02.20 16:58 
 

A deep understanding of forex, the philosophy of forex and life, translated into an understandable, easily applicable, profitable, and underpriced Meravith indicator (in fact, a complete system). On top of that, you get a dedicated, friendly, knowledgeable, and always available author ready to help.

zeke21t2
767
zeke21t2 2026.02.14 18:32 
 

The Meravith and the Transaction Speed ​​are two of the three best indicators I know. They integrate three perspectives: ΔP (price change), ΔV (trading volume change), and ΔT (time change), accurately analyze the market, and are designed to be intuitively applicable to actual trading. It's fascinating to watch the price move exactly as the indicators suggest. Despite their intuitive interface, both indicators are incredibly deep, and your research can make them even more useful. Winning EAs are great, but winning through discretionary trading is even better, right? If that sounds like you, I highly recommend them. The author is a very honest and kind person, and I admire his dedication to market research.

Mase
1799
Mase 2025.10.24 05:51 
 

one of the best tools i have ever used, highly recommend it. Ivan spends a lot time improving it consistently and is highly supportive!

推荐产品
History Pattern Search
Yevhenii Levchenko
该指标建立当前报价,可以与历史报价进行比较,并在此基础上进行价格走势预测。指示器有一个文本字段,用于快速导航到所需日期。 选项: 符号 - 选择指标将显示的符号; SymbolPeriod - 选择指标从中获取数据的时段; IndicatorColor - 指示器颜色; HorisontalShift - 由指标绘制的报价移动指定的柱数; Inverse - true 反转引号,false - 原始视图; ChartVerticalShiftStep - 图表垂直移动(键盘上的向上/向下箭头); 接下来是文本字段的设置,您可以在其中输入日期,您可以通过按“回车”立即跳转到该日期。 接下来是文本字段的设置,您可以在其中输入日期,您可以通过按“回车”立即跳转到该日期。

Blahtech Market Profile
Blahtech Limited
4.53 (15)
Was: $249  Now: $99   Market Profile defines a number of day types that can help the trader to determine market behaviour. A key feature is the Value Area, representing the range of price action where 70% of trading took place. Understanding the Value Area can give traders valuable insight into market direction and establish the higher odds trade. It is an excellent addition to any system you may be using. Blahtech Limited presents their Market Profile indicator for the MetaTrader community. Ins
Liquidity Heatmap Mt4
Israr Hussain Shah
Here   our MT5 version more valuable tools SMC Trend Trading   ,  Easy SMC Trading  ,  Institutional SMC Architect Volume Analysis Tools  ,  Volume flow Profile  ,  Market volume profile  , FVG with Volume  , Liquidity Heatmap Profile  ,  Volume Spread Analysis 2. Key Features Dynamic Filtering : The core feature. As soon as the current price crosses a historical liquidity level, that level disappears. This reduces chart clutter and prevents you from trading off "dead" support/resistance. Liqui
BoxChart MT4
Evgeny Shevtsov
4.4 (5)
The market is unfair if only because 10% of participants manage 90% of funds. An ordinary trader has slim changes to stand against these "vultures". This problem can be solved. You just need to be among these 10%, learn to predict their intentions and move with them. Volume is the only preemptive factor that faultlessly works on any timeframe and symbol. First, the volume appears and is accumulated, and only then the price moves. The price moves from one volume to another. Areas of volume accumu
Volume Profile Sniper v11.1是一款全面的市场分析工具 专业的交易方法 Volume Profile Sniper v11.1在一个指标中结合了超过15个关键过滤器,根据对市场情况的全面评估提供清晰的信号。 主要特点 成交量不平衡分析-该算法计算每个蜡烛中买家和卖家的份额,表明其中一方的优势(可配置阈值从50%到90%)。 多级信号滤波-指标考虑到: 趋势指标(EMA9/21) Rsi不包括超买/超卖区域 蜡烛图案(针杆,吸收,锤子) 支持/阻力水平(自动检测) 音量峰值,以确定主要参与者的活动 经典和放大的RSI分歧 波动率评估的ATR 用于确定趋势强度的ADX 价格行动(内部和外部酒吧) 多时间帧确认 市场结构(高点/低点) 会话过滤器(亚洲,伦敦,纽约会话) 防止新闻排放 灵活的配置系统-MinFiltersRequired参数允许您设置生成信号所需的最小数量的滤波器。 这使得可以使指标适应任何交易策略,从激进到保守。 可视化设置-您可以通过将指示器集成到图形样式中来更改箭头的大小和颜色(ArrowSize,BuyArr
Master Volume profile
Israr Hussain Shah
Money Flow Profile MT5 HERE   Here   our more valuable tools SMC Trend Trading   ,  Easy SMC Trading  ,  Institutional SMC Architect Volume Analysis Tools  ,  Volume flow Profile  ,  Market volume profile  , FVG with Volume  , Liquidity Heatmap Profile  ,  Volume Spread Analysis This Master Edition is engineered for clarity and speed, featuring a unique Auto-Theme Sync system that instantly beautifies your chart layout upon loading. Key Features: True Money Flow Calculation: Goes beyond stand
Blahtech Supply Demand
Blahtech Limited
4.58 (36)
Was: $299  Now: $99   Supply Demand uses previous price action to identify potential imbalances between buyers and sellers. The key is to identify the better odds zones, not just the untouched ones. Blahtech Supply Demand indicator delivers functionality previously unavailable on any trading platform. This 4-in-1 indicator not only highlights the higher probability zones using a multi-criteria strength engine, but also combines it with multi-timeframe trend analysis, previously confirmed swings
Trend Scan Friend
Israr Hussain Shah
Here   our more valuable tools SMC Trend Trading   ,  Easy SMC Trading  ,  Institutional SMC Architect Volume Analysis Tools  ,  Volume flow Profile  ,  Market volume profile  , FVG with Volume  , Liquidity Heatmap Profile  ,  Volume Spread Analysis Trend Identification: Look for the color change. When candles turn Green , look for Buy opportunities. When they turn Red , look for Sell opportunities. Entry: Enter on the break of the trend line or on the pullback to the line. Stop Loss: Use the
TITAN AI Volume Profile PRO MT4 is an advanced technical indicator designed for professional market analysis, volume profile distribution, and graphical data visualization in MetaTrader 4. Key Features: - Dynamic Volume Profile calculation based on price action and tick volume. - Automatic High Value Area (VAH), Low Value Area (VAL), and Point of Control (POC) detection. - High Volume Nodes (HVN) and Low Volume Nodes (LVN) highlighting. - Integrated Economic Calendar with news alerts. - Built-
Paid release: Delta Volume Profile Zones MT4 is a paid MetaCoderStore indicator. Use the product comments for setup questions, feature requests, and feedback for future updates. Delta Volume Profile Zones is a compact volume-profile indicator for traders who want price-level context without turning the chart into a crowded footprint screen. It builds a rolling profile from recent candles and marks the key zones traders usually watch: Point of Control, Value Area High, Value Area Low, high-volume
A technical indicator that calculates its readings on trading volumes. In the form of a histogram, it shows the accumulation of the strength of the movement of the trading instrument. It has independent calculation systems for bullish and bearish directions. Works on any trading instruments and time frames. Can complement any trading system. The indicator does not redraw its values, the signals appear on the current candle. It is easy to use and does not load the chart, does not require addition
Market voleum profile
Israr Hussain Shah
Here   our more valuable tools SMC Trend Trading   ,  Easy SMC Trading  ,  Institutional SMC Architect Volume Analysis Tools  ,  Volume flow Profile  ,  Market volume profile  , FVG with Volume  , Liquidity Heatmap Profile  ,  Volume Spread Analysis The Market Profile & Volume Profile Indicator is a powerful technical analysis tool designed to visualize market activity and price distribution over specific timeframes. Unlike standard technical indicators that focus solely on price over time, th
Moving VVC mt4
Andriy Sydoruk
The   Visual Volatility Clustering   indicator clusters the market based on volatility. The indicator does not redraw and gives accurate data, does not use closing prices. Uses the opening prices or the highs or lows of the previous completed bar. Therefore, all information will be clear and unambiguous. The essence of the indicator is to divide the price market into certain areas according to a similar type of volatility. This can be done in any way. In this example, the indicator is configure
MarketProfile EForex
Veridiana Adorno Kendrick
Market Profile Shows where the price has spent more time, highlighting important levels that can be used in trading. It is a powerful tool which is designed to take the fundamental components which comprise every market; price/volume/time, and visually display their relationship in real-time as the market develops for a pre-determined time period. Very powerful tool!
The Magneto Volume Trigger indicator is designed for determining the volume confirmed by the candlestick pattern and predicting the trend tendency. Indicator setup and use The calculation of values is affected by two parameters - Period and Gate . The lower the value of Gate , the higher the sensitivity of the indicator. Period allows making a sample of data for the specified number of candles. The lower the value of Period , the more the indicator is adapted to the current market conditions. I
Volume Compair
Thiago Pereira Pinho
5 (1)
专业累计德尔塔与成交量中位线指标 通过这款强大的成交量分析工具,追踪 真实的买卖压力 。 成交量比较指标 (Volume Compare Indicator) 结合了 累计德尔塔 (Cumulative Delta) 和 成交量中位线 (Volume Medians) ,帮助您识别机构活动、失衡以及潜在的反转。  主要特点:  累计德尔塔直方图 – 实时可视化净买入成交量与净卖出成交量。  买入/卖出成交量中位线 – 显示平均买入和卖出成交量水平的水平线。  智能成交量分类 – 分隔: 强劲买入(绿色) – 看涨压力。 强劲卖出(红色) – 看跌压力。 买入成交量中位线(蓝色线) – 典型买入量的参考。 卖出成交量中位线(橙色线) – 典型卖出量的参考。  可自定义参数 – 调整 CDIPeriod 和 CDIRange 以设置敏感度。  EMA 平滑成交量 – 减少噪音,使信号更清晰。  如何帮助交易者: 发现机构活动 – 异常的成交量尖峰指示大玩家进场。 确认突破/反转 – 强烈的德尔塔背离警告假动作。 基于成交量的支撑/阻力 – 中位线充当动态参考水平。 日内交
Market Profile 3
Hussien Abdeltwab Hussien Ryad
3 (2)
Market Profile 3 MetaTrader 4 indicator  — is a classic Market Profile implementation that can show the price density over time, outlining the most important price levels, value area, and control value of a given trading session. This indicator can be attached to timeframes between M1 and D1 and will show the Market Profile for daily, weekly, monthly, or even intraday sessions. Lower timeframes offer higher precision. Higher timeframes are recommended for better visibility. It is also possible t
FREE
PZ Harmonacci Patterns
PZ TRADING SLU
3.17 (6)
可以说,这是您可以为MetaTrader平台找到的最完整的谐波价格形成自动识别指标。它检测19种不同的模式,像您一样认真对待斐波那契投影,显示潜在的反转区域(PRZ),并找到合适的止损和获利水平。 [ 安装指南 | 更新指南 | 故障排除 | 常见问题 | 所有产品 ] 它检测19种不同的谐波价格形态 它绘制了主要,衍生和互补的斐波那契投影(PRZ) 它评估过去的价格走势并显示每个过去的形态 该指标分析其自身的质量和性能 它显示合适的止损和获利水平 它使用突破来表明合适的交易 它在图表上绘制所有样式比率 它实现了电子邮件/声音/视觉警报 受斯科特·M·卡尼(Scott M. Carney)的书的启发,该指标旨在满足最纯粹和最熟练的交易者的需求。但是,它采取了一种使交易更容易的方式:在向交易发出信号之前,它会等待Donchian朝正确方向突破,从而使交易信号非常可靠。 斐波那契投影与向量无关 它实现了电子邮件/声音/推送警报 它绘制了ABCD投影 重要提示: 为了符合 Scott M. Carney先生 的商标申诉,某些图案名称已重命名为不言自明的替代方式, Scott M.
MR Volume Profile 4
Sergey Khramchenkov
The "MR Volume Profile 4" indicator is a charting tool that displays trading volume at different price levels rather than time intervals. A key concept in volume profile is the point of control (POC)—the price level with the highest volume traded during the session or time range. While tools like VWAP or OBV provide volume trends, the "MR Volume Profile 4" indicator offers granular detail about where the most market activity occurs at specific price levels. This makes it a more precise tool for
概述 Candle Timer Countdown Pro for MT4 是一款用于 MetaTrader 4 的K线收盘倒计时指标。它可以在图表上显示当前K线距离收盘还剩多少时间,并配合圆形进度弧,让交易者一眼就能判断当前K线所处的时间阶段。 相比普通倒计时指标只在新 tick 到来时刷新,本指标使用服务器时间锚定与本地时钟插值方式,在 tick 稀少时仍能保持稳定倒计时显示,减少冻结、跳动和时间漂移问题。 无论您是在 M1 图上进行短线交易,还是在 H1、H4、D1 图上观察趋势和K线形态,准确知道当前K线何时收盘,都有助于更好地把握入场时机、确认收盘形态,并避免过早做出交易判断。 为什么本计时器与众不同 很多 MT4 倒计时指标主要依赖 TimeCurrent() 。在 MetaTrader 4 中,服务器时间通常随市场报价更新;当市场波动较低、报价间隔变长,或者当前品种暂时没有新 tick 时,普通倒计时容易出现短暂停顿,然后突然跳动。 本指标通过在新 tick 到达时锚定服务器时间,并在两次 tick 之间使用本地时钟进行时间插值,使倒计时显示更加平滑、稳定。配合圆形进度弧
VR Grid
Vladimir Pastushak
5 (3)
VR 网格指示器 设计 用于创建具有用户定义设置的图形网格。与 标准网格 不同,VR 网格用于构建 圆形关卡 。根据用户的选择,轮次级别之间的步长可以是任意的。此外,与其他指标和实用程序不同,即使时间段发生变化或终端重新启动,VR Grid 也能保持网格的位置 。 设置、设置文件、演示版本、说明、问题解决,可以从以下位置获取 [博客] 您可以在以下位置阅读或撰写评论 [关联] 版本为 [MetaTrader 5] 垂直级别 基于实际时间间隔并 忽略缺失 或不存在的周期。因此,级别之间的步长严格对应于用户选择的值。 使用 VR 网格指标时,交易者 可以更改任何级别的垂直线和水平线的样式 、颜色和粗细。这使您可以控制金融工具的 回合水平 。 整数位是 以两个或多个零结尾 的价格(例如:1.23500、5.65900、1923.200)。人们相信,这样的水平 经常充当 作为支撑或阻力的强点。 Horizontal line settings Horizontal line step Horizontal line color Horizontal line style Horizonta
FREE
Apollo SR Master
Oleg Rodin
5 (3)
Apollo SR Master 是一款支撑/阻力指标,其特殊功能使利用支撑/阻力区域进行交易更加便捷可靠。该指标通过检测局部价格顶部和底部,实时计算支撑/阻力区域,没有任何时间延迟。为了确认新形成的支撑/阻力区域,该指标会显示特殊信号,表明该支撑/阻力区域可以作为实际的卖出或买入信号。在这种情况下,支撑/阻力区域的强度会增强,因此从该区域进行交易的成功率也会更高。这正是该指标的核心理念。 SR区域也使止损和止盈的操作更加便捷。根据信号方向,可以将SR区域上方或下方的空间用作止损位。此外,相对的SR区域也可以用作潜在的止盈区域。 我还免费向所有 Apollo SR Master 指标的用户提供我的“Apollo 价格行为系统”指标。这两个指标结合使用将帮助您找到更好的入场点。 购买后请联系我,即可免费获得交易指导和超棒的额外指标!
Advance Currency Meter is a currency meter that detects strong market trends. This indicator is good for scalping, intraday trading and swing trading. The indicator will detect short term to long term market trends. This will give you good insight which currencies are best to trade as of the moment. Note : Kindly contact me before you make any purchases. This won't work on your account without my permission. Note :   Works well with my MACD Currency Strength Meter
UPD1 Profile Levels
Vitaliy Kuznetsov
5 (7)
该指标在指定柱数的工作直方图上找到最大和最低价格量(市场概况)的水平。   复合型材 。 柱状图的高度是全自动的,并适应任何仪器和时间框架。 作者的算法被使用,并且不重复众所周知的类似物。 两个直方图的高度近似等于蜡烛的平均高度。 智能警报将帮助您了解有关交易量水平的价格。 概念Smart Money   。 Low Volume - Imbalance. 用于寻找良好的市场环境,确定市场结构并作为二元期权的过滤器。 它是价格的磁铁。 High Volume - Liquidity. 用于退出累积时的测试。 输入参数   。 基本   。 Bars Count - 要计数和显示的条数   。 Signal Fractal = 5 (对于颜色信号电平)。 水平将在以下条件下成为信号:顶部和底部有五个直方图不超过它   。 Min Candles For High Volume Level - 在水平蜡烛的最小数量,以便它可以成为一个信号   。 按钮设置   。 Visual Button - 按钮显示(启用/禁用)   。 Corner - 按钮的卡角   。 X inden
Indicator function Buy and sell according to the index color change It is best to use 1H for testing   About update questions In order to be more suitable for market fluctuations, the company regularly updates the indicators   Product cycle and trading time applicable to indicators Applicable mainstream currency pair EUR/USD GBP/USD NZD/USD AUD/USD USD/JPY USD/CAD USD/CHF Applicable mainstream cross currency pair EUR/JPY EUR/GBP EUR/CHF EUR/CAD EUR/NZD AUD/CAD AUD/NZD AUD/CHF AUD/JPY GBP/JPY GB
The Visual Volatility Clustering indicator clusters the market based on volatility. The indicator does not redraw and gives accurate data, does not use closing prices. Uses the opening prices or the highs or lows of the previous completed bar. Therefore, all information will be clear and unambiguous. The essence of the indicator is to divide the price market into certain areas according to a similar type of volatility. This can be done in any way. In this example, the indicator is configured fo
Simply The Best Pro
Szymon Palczynski
5 (1)
This indicator displays the histogram and arrows on chart. When Simple The Best Pro are placed on a chart, they identify the trend.  The color of may be blue or red. The blue color stands for upside moves and the red color stands for downside trends. The indicator offers to set Stop Loss (SL) and  Take Profit (TP)  setting. The default value is ATR. Indicator has automatic optimization. The STB is a unique indicator that shows the tendency (button Bars) of a particular signals. The STB tells us
VolumeProfile
Robert Hess
3.8 (5)
Descption: The Volume Profile displays detailed informations of historical trading activities at certain price levels (Market Profile). So you can locate the areas with the best prices in the market and get an advantage about other market participants. Features: Customizable Volume Profile / Market Profile Shows the "fair" Value Area with 70% of all Volume Shows critical low volume zones Shows VPOC, VAL and VAH Points Works on all timeframes Also available for MT5 ( https://www.mql5.com/en/mark
The indicator analyzes the change in the minimum and maximum prices of the previous bars fixing the entrance of the big players. If the change (delta) increases, a signal is displayed on the graph in the form of an arrow. At the same time, virtual trade on history is carried out. In case of a repeat of the signal, the positions are increased (refilling). Thus the lot of positions can differ. The results of virtual trading in the form of losses / losses, profitability, drawdown and transaction li
该产品的买家也购买
Miraculous Indicator Binary & Forex v3 StrategySafe Miraculous Indicator Binary & Forex v3 StrategySafe 是一款专业交易指标,适合希望获得清晰信号、强大确认工具以及结构化交易方式的 Binary 和 Forex 交易者。 v3 版本加入了 MIR Dashboard、Miraculous Confirmation Dashboard、GANN Law、Square of 9 水平线、GANN 角度以及更强的 Forex 分析模式。 核心功能 同时支持 Binary 和 Forex 交易模式。 MIR Dashboard 可快速读取市场状态。 Miraculous Confirmation Dashboard 用于确认交易机会。 GANN Law drawing lines 用于 Forex 市场结构分析。 Square of 9 线条、方向和关键价格水平。 1x1 GANN Angle 用于判断趋势压力。 Entry Information TP 帮助寻找合理止盈区域。 Strateg
Miraculous 指标 – 100% 不重绘的外汇和二元期权工具,基于江恩九方图 这个视频介绍的 Miraculous 指标 是一款专为外汇和二元期权交易者开发的高精度、强大交易工具。该指标的独特之处在于它建立在传奇的 江恩九方图 和 江恩振动法则 之上,使其成为现代交易中可用的最精确预测工具之一。 Miraculous 指标 完全不重绘 ,这意味着它的信号在 K 线收盘后不会改变或消失——你看到的就是你得到的。这为交易者提供了可靠且一致的基础,让他们能够自信地进出场交易。 主要特点: 基于江恩九方图和江恩理论构建 100% 不重绘的信号系统 适用于所有时间周期(M1、M5、H1、H4、日线、周线) 适用于外汇和二元期权交易 清晰的买卖信号,准确率高 可用于剥头皮、日内交易或波段交易 兼容大多数 MT4 平台 这款工具旨在帮助初学者和专业交易者做出更好、更明智的决策。无论您是交易货币、指数还是二元期权,Miraculous 指标都将为您在市场中提供所需的优势。
ORB Seeker
Marcela Goncalves De Oliveira
4 (1)
特价促销,限量供应,保持产品稀缺性! 仅售 599 美元! 购买后请联系我以获取奖励的 ORB Seeker EA 和个人优化设置文件。 自信地捕捉干净利落的比赛片段! ORB Seeker 是一款专业的开盘区间突破 (ORB) 指标,专为追求准确性、简洁性、灵活性和清晰图表结构的交易者而设计。 它能自动绘制任何交易品种的盘前或自定义交易时段区间,然后给出清晰的突破信号,包括入场点、止损点、止盈点以及可选的50%部分止盈位。所有数据均实时计算并直接显示在图表上。 您可以选择交易伦敦开盘、纽约交易时段、亚洲交易时段,或者您自定义的交易时段。ORB Seeker 会根据您选择的交易时段自动调整,让您精准掌握市场波动范围、突破位和交易位的位置。 每次购买均免费赠送 ORB Seeker EA 智能交易系统。该 EA 系统读取指标的突破信号并可自动下单,您可以选择手动交易,也可以让 EA 系统根据指标的信号逻辑自动处理入场。   为什么选择 ORB Seeker 支持多个交易时段 - 您可以自行设置伦敦、纽约、亚洲或自定义交易时段的盘前交易时间和交易时段。 完整的突破视觉效果 - 交易最高
TrendMaestro
Stefano Frisetti
4 (4)
Attention: beware of SCAMS, TRENDMAESTRO is only ditributed throught MQL5.com market place. note: this indicator is for METATRADER4, if you want the version for METATRADER5 this is the link:  https://www.mql5.com/it/market/product/108106 TRENDMAESTRO ver 2.5 TRENDMAESTRO recognizes a new TREND from the start, he never makes mistakes. The certainty of identifying a new TREND is priceless. DESCRIPTION TRENDMAESTRO identifies a new TREND in the bud, this indicator examines the volatility, volumes a
FFx Engulfing Setup Alerter gives trade suggestions with Entry, Target 1, Target 2 and StopLoss. Below are the different options available: Entry suggestion - pips to be added over the break for the entry 3 different options to calculate the SL - by pips, by ATR multiplier or at the pattern High/Low 3 different options to calculate the 2 TPs - by pips, by ATR multiplier or at Risk/Reward Offset the dashboard - any place on the chart Remove the suggestion once the price reached the SL line Lines
FFx InsideBar Setup Alerter gives trade suggestions with Entry, Target 1, Target 2 and StopLoss. Below are the different options available: Entry suggestion - pips to be added over the break for the entry Minimum candle size - to avoid too close buy/sell entry suggestions 3 different options to calculate the SL - by pips, by ATR multiplier or at the pattern High/Low 3 different options to calculate the 2 TPs - by pips, by ATR multiplier or at Risk/Reward Offset the dashboard - any place on the c
FFx OutsideBar Setup Alerter gives trade suggestions with Entry, Target 1, Target 2 and StopLoss. Below are the different options available: Entry suggestion - pips to be added over the break for the entry. 3 different options to calculate the SL - by pips, by ATR multiplier or at the pattern High/Low. 3 different options to calculate the 2 TPs - by pips, by ATR multiplier or at Risk/Reward. Offset the dashboard - any place on the chart. Remove the suggestion once the price reached the SL line.
FFx PinBar Setup Alerter gives trade suggestions with Entry, Target 1, Target 2 and StopLoss. Below are the different options available: Entry suggestion - pips to be added over the break for the entry Minimum candle size - to avoid too small candles 3 different options to calculate the SL - by pips, by ATR multiplier or at the pattern High/Low 3 different options to calculate the 2 TPs - by pips, by ATR multiplier or at Risk/Reward Offset the dashboard - any place on the chart Remove the sugges
Lineverse Trendlines
Arkady Segal
5 (1)
Automatic, live & interactive picture of all trendlines. Assign push, email and sound alerts to the lines of your choice and be informed about price rollback, breakout, rollback after breakout, number of rollbacks, line expiration by double breakout. Correct, drag or delete the lines and interactively tune the line system. https://youtu.be/EJUo9pYiHFA . Chart examples https: //www.mql5.com/en/users/efficientforex Price Interaction Events All events are effective immediately and only after one
FFx MACD Divergences
Eric Venturi-Bloxs
The purpose of this new version of the MT4 standard indicator provided in your platform is to display in a sub-window multiple timeframes of the same indicator with its divergences. See the example shown in the picture below. But the display isn't like a simple MTF indicator. This is the real display of the indicator on its timeframe. Here's the options available in the FFx divergences indicator: Select the timeframes to be displayed (M1 to Monthly) Define the width (number of bars) for each tim
FFx RSI Divergences
Eric Venturi-Bloxs
The purpose of this new version of the MT4 standard indicator provided in your platform is to display in a sub-window multiple timeframes of the same indicator with its divergences. See the example shown in the picture below. But the display isn't like a simple MTF indicator. This is the real display of the indicator on its timeframe. Here's the options available in the FFx divergences indicator: Select the timeframes to be displayed (M1 to Monthly) Define the width (number of bars) for each tim
FFx CCI Divergences
Eric Venturi-Bloxs
The purpose of this new version of the MT4 standard indicator provided in your platform is to display in a sub-window multiple timeframes of the same indicator with its divergences. See the example shown in the picture below. But the display isn't like a simple MTF indicator. This is the real display of the indicator on its timeframe. Here's the options available in the FFx divergences indicator: Select the timeframes to be displayed (M1 to Monthly). Define the width (number of bars) for each ti
The FFx Dashboard MTF alerter will show you on a single chart all the timeframes (M1 to Monthly) with their own status for the indicator. 2 Alert Options: Single timeframe: each selected timeframe alert separately when a signal occurs Multi timeframes: all selected timeframes must agree for an alert to be triggered Both options have an input to select the timeframes to be used for the alert(s). How to Understand the Status: Green/Red square: histogram above/below 0 line Green square + Red bord
The FFx Dashboard MTF alerter will show you on a single chart all the timeframes (M1 to Monthly) with their own status for the indicator. 2 Alert Options: Single timeframe: each selected timeframe alert separately when a signal occurs Multi timeframes: all selected timeframes must agree for an alert to be triggered Both options have an input to select the timeframes to be used for the alert(s). How to understand the status: Green/Red square: RSI above/below 50 line Green square + Red border: R
The FFx Dashboard MTF alerter will show you on a single chart all the timeframes (M1 to Monthly) with their own status for the indicator. 2 Alert Options: Single timeframe: each selected timeframe alert separately when a signal occurs Multi timeframes: all selected timeframes must agree for an alert to be triggered Both options have an input to select the timeframes to be used for the alert(s). How to understand the status: Green/Red square: Stoch above/below 50 line Green square + Red border:
The FFx Dashboard MTF alerter will show you on a single chart all the timeframes (M1 to Monthly) with their own status for the indicator. 2 Alert Options: Single timeframe: each selected timeframe alert separately when a signal occurs Multi timeframes: all selected timeframes must agree for an alert to be triggered Both options have an input to select the timeframes to be used for the alert(s). How to understand the status: Green/Red square: Price above/below Cloud (Kumo) Green square + Red bo
The FFx Dashboard MTF alerter will show you on a single chart all the timeframes (M1 to Monthly) with their own status for the indicator. 2 Alert Options: Single timeframe: each selected timeframe alert separately when a signal occurs Multi timeframes: all selected timeframes must agree for an alert to be triggered Both options have an input to select the timeframes to be used for the alert(s). How to understand the status: Green/Red square: MA pointing Up/Down Green square + Red border: MA po
The FFx Dashboard MTF alerter will show you on a single chart all the timeframes (M1 to Monthly) with their own status for the indicator. 2 Alert Options: Single timeframe: each selected timeframe alert separately when a signal occurs. Multi timeframes: all selected timeframes must agree for an alert to be triggered. Both options have an input to select the timeframes to be used for the alert(s). How to understand the status: Green square: Price above PSAR Red square: Price below PSAR Options
The FFx Dashboard MTF alerter will show you on a single chart all the timeframes (M1 to Monthly) with their own status for the indicator. 2 Alert Options: Single timeframe: each selected timeframe alert separately when a signal occurs Multi timeframes: all selected timeframes must agree for an alert to be triggered Both options have an input to select the timeframes to be used for the alert(s). How to understand the status: Green/Red square: CCI above/below levels (ie. 100/-100) Grey square: C
The FFx Dashboard MTF alerter will show you on a single chart all the timeframes (M1 to Monthly) with their own status for the indicator. 2 Alert Options: Single timeframe: each selected timeframe alert separately when a signal occurs Multi timeframes: all selected timeframes must agree for an alert to be triggered Both options have an input to select the timeframes to be used for the alert(s). How to understand the status: Green/Red square: ADX above level Grey square: ADX below level Red bor
The FFx Dashboard MTF alerter will show you on a single chart all the timeframes (M1 to Monthly) with their own status. 2 Alert Options: Single timeframe: each selected timeframe alert separately when a signal occurs Multi timeframes: all selected timeframes must agree for an alert to be triggered Both options have an input to select the timeframes to be used for the alert(s). How to understand the status: Green/Red square: bullish/bearish candle Options available in the FFx Dashboard Alerter
The indicator of a Professional Trader is an arrow indicator for predicting the direction of price movement. I have been working on this indicator since 2014. You can use this indicator as your main indicator, use its entry signals, and use it as your only indicator to find entry points. About the product: Recommended TF [H4-D1-W1]   . The indicator predicts the direction of the next candle. Fits a variety of tools; Flexibility in settings for different instruments and intervals through the MO
THE GRAFF III
Charles Harper
The [GRAFF] III manual trading system is based on multiple MetaTrader (MT4) indicators. Together, the entire PACK of GRAFF III indicators makes an advanced trading tool. The system consists of over 20 different custom-built indicators which have been carefully selected and tested in the long term to produce strong and efficient trading signals. The particular indicators are based on different mathematical formulas, so the entire system is calibrated to remove false signals from its own indicator
This indicator allows you to see the strength of the trend on all timeframes. It can be used for all currency pairs. The indicator can be displayed in the form of a column (from left to right): status buy / sell / strong buy / strong sell, strength of the trend in percentage, pips last candle, body candle now, remaining time, and the timeframe of M1 to MN. Information contained below (from left to right): total trend percent, sell percent, buy percent.
FFx Universal Strength Meter PRO is more than a basic strength meter. Instead of limiting the calculation to price, it can be based on any of the 19 integrated strength modes + 9 timeframes. With the FFx USM, you are able to define any period for any combination of timeframes. For example, you can set the dashboard for the last 10 candles for M15-H1-H4… Full flexibility! Very easy to interpret... It gives a great idea about which currency is weak and which is strong, so you can find the best pai
A simplistic indicator informing a user on RSI divergence by sending messages to mobile device and email. The indicator draws 2 vertical lines, marking two RSI extrema that formed the divergence. You get the alert, open the charts and make a decision. The indicator does not show past divergences, thus when you attach it to a chart for the first time you see nothing. Graphics and alerts will appear as soon as divergences do. Drop it in Tester to see how it works. Parameters: RSIPeriod - number of
ZLevels
Sergio Andres Zuleta Lopez
This indicator is based on Market Profile methodology, which contains the Z-Zone , unlike the latter, allows visualization of multiple time frames on the same graph. This methodology has proven to be very effective for: Reduce the number of windows required to analyze or track a financial asset. Display important resistance areas (ROZ), support (SoZ) and average distribution (PoC) in different periods of time. Define areas to take profits as well locate technical stop loss. Analysis in the devel
Pan PrizMA CD Phase is an analogue of the МetaТrader 5 indicator , and is an option based on the Pan PrizMA indicator. Details . Averaging by a quadric-quartic polynomial increases the smoothness of lines, adds momentum and rhythm. Extrapolation by the sinusoid function near a constant allows adjusting the delay or lead of signals. The value of the phase - wave status parameter (which is close in meaning to the trigonometric phase or the angle of the radius-vector rotation in the trigonometric p
作者的更多信息
Primes Action
Ivan Stefanov
Primes Action 在图表上绘制前一日、前一周和前一月的高点和低点,并在价格突破这些位置时给出提示。每个周期使用各自的颜色,三条参考线一目了然。 水平线如何确定 一个周期的精确高点或低点往往只是一根短促的尖刺。Primes Action 取前一个已完成周期的上八分之一和下八分之一区间,在每个区间内绘制价格停留时间最长的位置。计算使用一分钟数据,而不是您当前图表的K线。因此,日线、周线和月线的水平线在 M5、H1 或 H4 上完全相同。 每一天在纽约收盘时结束,即纽约时间 17:00。美国夏令时自动处理。一周从纽约时间周日 17:00 到周五 17:00。因此,这些水平线不依赖于经纪商服务器的时区。 突破线 W. D. Gann 描述过 lost motion:价格可以稍微越过一个水平位而并未真正突破它。Primes Action 在每条水平线之外绘制一条突破线,距离为高低两条水平线之间区间的八分之一。只有当前 Bid 价格越过这条线时,才标记为多头或空头突破。箭头标出发生突破的那根K线。水平线与其突破线之间的区域会被填色。 面板 面板显示三个周期各自的状态:中性、多头或
Currency Strength Anchor —— 会话自适应的相对强度指标,以日开盘、周开盘和月开盘为锚点。无重绘。 大多数强度指标在固定回溯期内比较不同品种。但随着交易日从一个交易时段进入下一个时段,这种比较的意义会发生变化:基于亚洲时段数据的排名在伦敦和纽约开盘后几乎没有参考价值。 Currency Strength Anchor 采用不同的参考方式。它将每个品种与三个固定锚点进行比较——日开盘、周开盘和月开盘——并根据你所处的交易时段自动调整计算范围。 上下文会自动在以下范围之间切换: 仅亚洲时段 亚洲 + 欧洲时段 亚洲 + 欧洲 + 美洲时段 仅美洲时段 所有数值均基于已完成的价格数据计算,不会重绘。 如何阅读 指标为图表上的每个组成部分绘制一条线,因此你始终是在比较两条线。 示例 1 —— 黄金。你会看到两条线,一条代表 XAU,一条代表 USD。如果 XAU 线高于 USD 线,说明黄金强于美元,你应寻找做多 XAUUSD 的机会。 示例 2 —— EURUSD。如果 EUR 线低于 USD 线,说明欧元弱于美元,你应寻找做空 EURUSD 的机会。 规则对所有品
Transaction Speed MT5
Ivan Stefanov
5 (4)
当然,以下是翻译成中文(简体)的版本: 该指标标出市场中显现出 交易兴趣 的区域,并随后显示 订单积累区域 。它的工作方式类似于大规模的订单簿。 这是为 大资金 打造的指标,性能卓越。市场中有任何兴趣,你都能通过它清晰看到。 (这是一个 完全重写的自动化版本 —— 不再需要手动分析。) 交易速度 是一个全新的概念指标,它显示了市场上大订单 何时 、 何地 聚集,并揭示了其背后的意义。它可以在 非常早期 就检测到趋势的变化。 在外汇市场,所谓的“交易量”实际上是误导性的,因为那指的是价格在单位时间内的变化,因此真正的名称应是“交易速度”。 一切都取决于我们如何思考、如何行动、如何分析。 改变分析范式至关重要。 该指标完全重构了外汇市场上“交易量”的概念,用逻辑方式重新定义并应用,从而成为一个 独特而精准的工具 。 使用方法: 默认情况下,指标处于 自动模式 ,可独立用于任何时间周期。如果你希望切换到手动模式,只需点击 Auto / Manual Mode 按钮即可。 在 手动模式 下,所有计算从 2025年1月1日 开始。你可以根据需要更改该日期,以查看不同的分析结果。 最优数据周期
Fibowave
Ivan Stefanov
FIBOWAVE 在七个时间周期上同时自动完成艾略特波浪计数,从月线图一直到 M5,并给出运行中调整浪的斐波那契回撤、第3浪、第5浪和C浪的斐波那契目标、计数失效的价位,以及第3浪或第5浪开始时的提醒。 手工数浪速度很慢,而且两位分析师很少能得出相同的计数。FIBOWAVE 按固定规则计数,每次的方式都相同,并把各浪、它们的子浪以及子浪的子浪标注在您的图表上。 计数从哪里开始 您不需要选择起点,也不需要设置任何参数。本指标从月线图开始逐级向下寻找市场最近一次显示出新一轮走势开端的位置,并从该位置开始计数。 在起始阶段,一段走势既可能是新趋势的第1浪,也可能是旧趋势的第2浪,在价格再次运行之前没有人能够确定。FIBOWAVE 会如实说明这一点:标签显示为 "1/2?",状态行会告诉您每种情况分别需要发生什么。一旦价格给出答案,标签就变为第1浪或第2浪,计数由此继续。若某段走势最终被确认为B浪,同样会重新标注。 高时间周期上尚未确定的浪不会中断分析。较低的时间周期会继续对该走势计数,状态行会说明它们采用的是哪一种解读。 从月线图逐级向下 每个时间周期的计数都一直延伸到最后一
GANN Master 为当前的日、周或月绘制江恩(W. D. Gann)平方根水平,并标出买方与卖方目标相遇的区域。水平由上一周期的最高价和最低价计算,在整个周期内保持不变,不会重画。 水平如何构建 上一周期的最高价成为 TOP 线,其最低价成为 BOTTOM 线。指标从 TOP 向下量出三个看跌目标(Bears' interest 1、2 和 3),从 BOTTOM 向上量出三个看涨目标(Bulls' interest 1、2 和 3),使用江恩的平方根步长 1/8、2/8 和 3/8。 江恩计算始终需要一个比例。GANN Master 会自行选择:它尝试每一个比例,并保留使看涨线与看跌线彼此最接近的那一个。当一条看跌线与一条看涨线相互靠近时,双方的利益就在此相遇。指标把这些位置着色为共同利益区域。每个周期最多绘制五个区域。 每个区域周围有两条虚线的区域突破线,位于该区域上方和下方,距离为 TOP-BOTTOM 区间的 1/8。TOP 和 BOTTOM 周围也有一条同样大小的着色带。 图表上显示的内容 TOP 与 BOTTOM、六条江恩线及其名称,显示在当前K线的右侧 当前日、周或
Meravith Scanner
Ivan Stefanov
5 (3)
MERAVITH SCANNER 是一款适用于 MetaTrader 5 的专业金融市场指标,将多种分析工具整合为一个统一的系统。它基于专有的成交量加权平均价格(VWAP)方法自动完成所有计算,完全消除主观判断。 该指标适用于所有资产类别(外汇、股票、指数、大宗商品、加密货币)以及从 M1 到 Monthly 的所有时间周期。其核心原理是价格跟随成交量。MERAVITH 识别机构资金成交量的集中区域,并从该集中区域中推导出数学上精确的价格水平。它不预测,不推测。它只计算。 使用 MERAVITH SCANNER,您可以在 2–3 分钟内扫描全部 28 个主要外汇货币对的所有时间周期。您也可以扫描任何您选择的市场——例如,大约 100 只股票约需 10 分钟。 该指标计算耗尽水平、平衡线、偏差、统计水平以及目标投射。 图表元素 Origin Point 标记所有计算的起始位置。指标会自动将其放置在最佳位置。红色标签(TOP)表示市场高点并带有看跌倾向。绿色标签(BOTTOM)表示市场低点并带有看涨倾向。 Sentiment Line 是一条动态曲线,反映基于成交量加权计算得出的市场情绪。
KAMA Confluence Engine
Ivan Stefanov
5 (2)
KAMA Confluence Engine 顺势交易——在趋势反转的那一刻立即知道你的入场、止损和目标位。 KAMA Confluence Engine 是一款基于考夫曼自适应移动平均线(KAMA)的全能趋势指标,并结合了成交量加权、多周期共振确认以及自动交易水平。它会根据市场环境自动调整:在趋势行情中快速敏捷,在震荡行情中平稳过滤噪音——让你始终站在正确的一侧。 它的独特之处 成交量加权自适应引擎 ——当真实的成交量进入市场时,KAMA 线会加速;当成交量减弱时,它会放缓,让你留在强势行情中,避开假突破。 醒目的霓虹趋势带 ——亮丽、流畅的线条,底部带有深色阴影。绿色 = 上升趋势,红色 = 下降趋势,灰色 = 横盘/无交易。趋势一眼即可识别,即使远距离也清晰可见。 趋势颜色蜡烛图 ——蜡烛本身会根据趋势着色,让整个图表呈现统一的趋势故事。 自动 Entry / SL / TP 水平(新功能) 当新趋势出现时,指标会自动在图表上绘制可直接使用的交易水平: 入场线位于信号价格 止损由 ATR 计算(根据品种波动性自动调整) TP1 / TP2 / TP3 按你设定的风险回报比(默认
Order Block Scorecard 在您的图表上标记供给区与需求区,并为每一个区域记录来自您自己历史数据的三项数值:价格进入该区域的次数、其中有多少次被守住,以及此后价格走出的最远距离。 这三个数字描述的是您眼前这个品种与周期上已经发生的事情。它是过去行为的记录,不是预测。 区域规则 只有一条规则,完整写出,您可以在任何一根K线上用肉眼验证: 供给区 - 下跌前的最后一根阳线,且该下跌在允许的K线数量内走完所需距离 需求区 - 上涨前的最后一根阴线,条件相同 区域就是这根K线,取整根或仅取实体,由您选择。没有隐藏过滤,没有平滑处理。 每个区域的记录 从区域生成的那一刻起,指标沿历史向前推演并记录发生了什么: 测试次数 - 价格进入该区域的次数 守住次数 - 其中有多少次之后出现了足够大的离开走势 最佳 - 触及后价格从区域边界走出的最远距离 当一个区域结束时它会变灰:或者因为有K线收盘穿过了它的远端边界,或者因为它已被测试到您允许的次数上限。结束的区域仍留在图表上,因为失效的区域同样是记录的一部分。 大幅走势上的箭头 当一次触及之后出现了超过您设定阈值的走势,会从区域边界画出一
FREE
MACD divergency
Ivan Stefanov
4.7 (10)
该指标准确地识别出价格走势与MACD柱状图之间的牛市和熊市背离,使用的指数移动平均线(EMA)周期为5(快速),34(慢速),信号线周期为5。该指标突出显示了动能减弱的点,提示可能的趋势反转。 正确识别背离的规则: 当价格形成更低的低点,而MACD柱状图同时在零线之上形成更高的低点时,牛市背离有效。 当价格形成更高的高点,而MACD柱状图同时在零线以下形成更低的高点时,熊市背离有效。 如果柱状图的极值和价格的极值没有位于零线的同一侧,则背离信号无效,因为这可能导致假信号。 这种方法代表了应用MACD背离分析最准确和可靠的方法。 指标特点: 清晰地标记已确认的牛市和熊市背离。 严格遵守MACD背离验证规则,提高可靠性。 其他信息:该指标作为MetaTrader 5的EX5编译文件提供。它不需要外部库或DLL文件。建议交易者将此工具与整体交易策略一起使用。在进行真实交易前,请务必在模拟账户中充分测试。该指标不保证盈利,仅作为帮助识别真实MACD背离的分析工具。
FREE
Ichimoku Nexus Pro
Ivan Stefanov
5 (1)
Ichimoku Nexus Pro 一目均衡表,将细田悟一的全部三大理论呈现在同一张图表上:五条线、波动论(I、V、N、P、Y、W 波)、价格论(N、V、E、NT 目标)和时间论(基本数值与对等数值的时间计数)。 另外还包含:不重绘的高周期云图、经过测算的迟行带(Chikou Span)、在基准线走平、云层过薄或价格处于云中时暂停交叉信号的震荡过滤器,以及读取"市场报价"中全部品种并按可靠度排序的扫描器。 多数一目均衡表工具只画五条线,再加一个面板和一个提醒。五条线只是一目均衡表的第一部分。细田悟一把这套系统建立在三大理论之上:行情的形态、应走的幅度,以及何时应当发生变化。Ichimoku Nexus Pro 三者全画。 五条线 转换线、基准线、云(先行带 A 与 B)和迟行带均在指标内部计算。策略测试器中的数值与实盘图表完全一致,没有断档,也没有空值。 周期预设: Traditional 9 / 26 / 52 / 26 Crypto 20 / 60 / 120 / 30 Doubled 18 / 52 / 104 / 26 Auto:加密货币品种用 Crypto,其余一律用 Tr
FREE
Meravith MT5
Ivan Stefanov
5 (3)
做市商工具。 Meravith 将: 分析所有时间周期并显示当前正在运行的趋势。 标注流动性区域(成交量均衡区),即多头与空头成交量相等的位置。 在您的图表上直接显示来自不同时间周期的所有流动性水平。 生成并展示基于文本的市场分析供您参考。 根据当前趋势计算目标位、支撑位和止损位。 计算交易的风险回报比。 根据您的账户余额计算仓位大小,并估算潜在利润。 在市场出现重大变化时,Meravith 还会发出警告。 指标的主要线条: 多头/空头成交量衰竭线 —— 作为目标位使用。 趋势线 —— 指示市场趋势方向。根据市场是多头还是空头而改变颜色,并作为趋势支撑。其颜色主要反映市场情绪。 成交量均衡线(Eq)—— Eq(Volume Equilibrium)是系统的核心。它表示买卖双方成交量的平衡点,即市场流动性所在位置。向上突破 Eq 表示多头倾向,向下突破 Eq 表示空头倾向。突破后,应等待回调——当价格回到相反趋势的偏离线或衰竭线附近时。 使用方法:只需将其添加到图表中。 Meravith 可以分析一切——趋势和回调。 趋势线与某条成交量衰竭线之间的距离越大,说明该方向的成交量越高。 趋势
RSI Divergence Pulse 是一个全面的 RSI 指标,结合了背离检测、多时间框架分析和可视化工具于一身,轻量级应用。它自动识别常规和隐藏背离,显示实时多时间框架 RSI 面板,填充 OB/OS 区域以便视觉识别,在价格图表和 RSI 子窗口上绘制背离线,放置买卖箭头,并提供实时警报。 Features Color-Coded RSI Line RSI 线根据当前区域改变颜色。蓝色表示中性区域(30 到 70 之间)。绿色标记超买区域(高于 70)。红色标记超卖区域(低于 30)。 RSI Signal Line RSI 的 SMA(默认周期 9)作为信号线。RSI 和信号线的交叉提供额外的时机信息。差值(Diff)显示在仪表板中。 Automatic Divergence Detection 基于分形的枢轴算法扫描最多 500 根 K 线,检测两种类型的背离。常规(实际)背离识别经典反转信号,即价格创出新极值而 RSI 不认可。隐藏背离识别趋势延续信号,在回调期间。 Dual Divergence Lines 实线代表常规背离,虚线代表隐藏背离。线条同时绘制在价格图表
Imbalance Pro
Ivan Stefanov
5 (4)
该指标测量所选时段内牛市和熊市之间的不平衡,并在两点之间显示一条直线。 如果牛市的成交量大于熊市,则该线变为绿色。 如果熊市成交量更大,则为红色。 直线还显示成交量的百分比差异。 该指标在单独的窗口中显示相同的数据。您还可以看到分割后的成交量。 该指标有两种模式。 为此,左上方有一个按钮、  - 如果不按下,它将测量市场任意点与当前价格之间的不平衡。 - 如果按下按钮,则可以测量市场任意两点之间的平衡。 该指标测量所选时段内牛市和熊市之间的不平衡,并在两点之间显示一条直线。 如果牛市的成交量大于熊市,则该线变为绿色。 如果熊市成交量更大,则为红色。 直线还显示成交量的百分比差异。 该指标在单独的窗口中显示相同的数据。您还可以看到分割后的成交量。 该指标有两种模式。 为此,左上方有一个按钮、  - 如果不按下,它将测量市场任意点与当前价格之间的不平衡。 - 如果按下按钮,则可以测量市场任意两点之间的平衡。
RSI Divergence Pulse is an RSI-based indicator for MetaTrader 4. It detects regular and hidden divergences, draws them on the price chart and in the RSI subwindow, shows RSI values from five timeframes in one panel, and reports the current RSI state in an information panel. Alerts can be sent when a divergence is confirmed. How it works The indicator calculates a standard RSI and a signal line, which is a simple moving average of the RSI. Significant RSI highs and lows are located with a frac
Enigmera
Ivan Stefanov
5 (9)
ENIGMERA: 市场的核心 重要提示:MQL5.com 演示版本在策略测试器中运行,可能无法完全反映 Enigmera 的功能。请查看描述、截图和视频了解详细信息。如有任何问题,请随时联系我! 该指标的代码已完全重写。版本 3.0 增加了新功能并修复了自指标发布以来积累的错误。 简介 这个指标和交易系统是金融市场的一种独特方法。ENIGMERA 使用分形周期来精确计算支撑和阻力水平。它展示了真实的积累阶段,并提供了方向和目标。无论是在趋势中还是在修正中,这个系统都能工作。 它是如何工作的 指标的大部分功能通过图表左侧的按钮控制,使得能够快速响应不同的市场情况。 按钮 ON/OFF – 显示或隐藏整个指标。 Channel – 激活支撑通道,显示可接受的偏差范围。 Dev1 (第一偏差) – 指示价格在支撑偏差内的波动,信号表示市场正在整合或积累力量。 Dev2 (第二偏差) – 显示价格在偏差之间的波动,表示趋势形成和方向。 Dev3 (第三偏差) – 表示趋势的显著加速和高波动性。 45deg (45度) – 显示市场的节奏和相对于 45 度线的运动稳定性。 Tgt1/2
Sense
Ivan Stefanov
5 (2)
SENSE 是一个自动系统,它将选定的 GANN 方法与分形计算相结合。系统会告诉我们在哪里开仓,在哪里平仓。无需再将时间浪费在复杂的计算上 - SENSE 会为您完成一切。只需安装指标即可。 基本原则: 当价格高于白线时,市场看涨 在白线上方买入,在白线下方止损 绿线为上涨目标 当价格低于白线时,市场看跌。 在白线下方卖出,在白线上方止损 红线为下行目标 双绿线或红线表示较强的区域。 为什么是 SENSE? 获利目标: SENSE 自动设置获利目标,帮助您最大限度地提高交易成功率。 自动适应: 该指标可自动重新计算任何时间框架,提供准确可靠的信号,无需手动调整。 非常适合剥头皮交易。 查看演示版! SENSE 是一个自动系统,它将选定的 GANN 方法与分形计算相结合。系统会告诉我们在哪里开仓,在哪里平仓。无需再将时间浪费在复杂的计算上 - SENSE 会为您完成一切。只需安装指标即可。 基本原则: 当价格高于白线时,市场看涨 在白线上方买入,在白线下方止损 绿线为上涨目标 当价格低于白线时,市场看跌。 在白线下方卖出,在白线上方止损 红线为下行目标
Two Snakes
Ivan Stefanov
5 (1)
GANN Master
Ivan Stefanov
5 (1)
GANN Master 为当前的日、周或月绘制江恩(W. D. Gann)平方根水平,并标出买方与卖方目标相遇的区域。水平由上一周期的最高价和最低价计算,在整个周期内保持不变,不会重画。 水平如何构建 上一周期的最高价成为 TOP 线,其最低价成为 BOTTOM 线。指标从 TOP 向下量出三个看跌目标(Bears' interest 1、2 和 3),从 BOTTOM 向上量出三个看涨目标(Bulls' interest 1、2 和 3),使用江恩的平方根步长 1/8、2/8 和 3/8。 江恩计算始终需要一个比例。GANN Master 会自行选择:它尝试每一个比例,并保留使看涨线与看跌线彼此最接近的那一个。当一条看跌线与一条看涨线相互靠近时,双方的利益就在此相遇。指标把这些位置着色为共同利益区域。每个周期最多绘制五个区域。 每个区域周围有两条虚线的区域突破线,位于该区域上方和下方,距离为 TOP-BOTTOM 区间的 1/8。TOP 和 BOTTOM 周围也有一条同样大小的着色带。 图表上显示的内容 TOP 与 BOTTOM、六条江恩线及其名称,显示在当前K线的右侧 当前日、周或
Fifty Pro
Ivan Stefanov
5 (1)
FIFTY 指标现在提供自动化版本,无需手动绘制水平线。此版本可自动在图表上绘制每日、每周、每月和年度水平线,确保准确性并节省时间。此外,提供按钮以切换这些水平线的可见性,实现完全自定义。对于喜欢手动操作的用户,免费版本仍然可用且功能齐全,让交易者可以根据自己的需求选择手动或自动工具。 最符合逻辑的指标之一。 高度可靠。 FIFTY 指标现在提供自动化版本,无需手动绘制水平线。此版本可自动在图表上绘制每日、每周、每月和年度水平线,确保准确性并节省时间。此外,提供按钮以切换这些水平线的可见性,实现完全自定义。对于喜欢手动操作的用户,免费版本仍然可用且功能齐全,让交易者可以根据自己的需求选择手动或自动工具。 最符合逻辑的指标之一。 高度可靠。
Fifty Pro MT5
Ivan Stefanov
这是为数不多仅基于价格计算水平的指标之一。该指标不受时间周期、趋势或市场周期的影响,是有史以来最具逻辑性的指标之一。 现在, FIFTY 指标推出了自动版本,无需手动绘制水平线。此版本会自动在图表上绘制每日、每周、每月和每年的水平线,确保精确并节省时间。此外,提供了按钮用于切换这些水平线的显示,方便用户完全自定义。对于喜欢手动方式的用户,免费版本仍然可用且功能齐全,可根据交易需求选择手动或自动工具。 非常可靠,强烈推荐!快来索取你的手动版 FIFTY 指标吧! 这是为数不多仅基于价格计算水平的指标之一。该指标不受时间周期、趋势或市场周期的影响,是有史以来最具逻辑性的指标之一。 现在, FIFTY 指标推出了自动版本,无需手动绘制水平线。此版本会自动在图表上绘制每日、每周、每月和每年的水平线,确保精确并节省时间。此外,提供了按钮用于切换这些水平线的显示,方便用户完全自定义。对于喜欢手动方式的用户,免费版本仍然可用且功能齐全,可根据交易需求选择手动或自动工具。 非常可靠,强烈推荐!快来索取你的手动版 FIFTY 指标吧!
Speculator MT5
Ivan Stefanov
SPEKULATOR 是一个手动交易系统和指标,帮助您识别关键支撑区域和市场方向。 用简单的策略和隐藏的智慧掌握市场。 您可以在图表上选择任意一个顶部(TOP)和底部(BOTTOM),指标将自动绘制: 您趋势方向的支撑区。 如果是多头趋势,将显示绿色区域;如果是空头趋势,将显示红色区域。该支撑区的灵敏度可以在设置中调整。该区域基于您选择的趋势,表示支撑最可能出现的位置。 高偏差线和低偏差线 根据甘氏九宫格(W.D. Gann’s Square of 9)计算的角度线 入场规则如下: 如果价格向上突破高偏差线,可以做多 如果价格向下突破低偏差线,可以做空 如果价格在偏差线之间震荡,可以在区间内高抛低吸,同时遵守支撑区的方向 甘氏角度线可用作止盈参考 关键水平是360度线: 如果价格高于该线,市场可能会上涨 如果价格低于该线,市场可能会继续下跌 加载指标后,它会出现在图表上的第20根到第50根K线之间。 点击该线即可激活,激活后可以将其移动到任意顶部或底部。 SPEKULATOR 是少数几个将清晰逻辑与优雅视觉效果结合在一起的指标之一。 您可以选择启用区域之间的颜色渐变,使图表显示更为平
Naturu
Ivan Stefanov
5 (1)
“Naturu” 是一个使用大自然对称性作为算法的手动指标。 用简单策略和隐藏智慧,掌控市场! 加载指标后,您会看到两条线——上线(Top)和下线(Bottom)。 单击一次即可激活某条线。要移动,只需点击您想放置该线的那根K线。 您设定一个高点和一个低点,指标会自动计算: 洋红色区域,显示多空双方兴趣最接近之处,也就是最有可能成为支撑/阻力的区域。 灰色区域,标示下一层次的关注区。 青绿色线条,表示多方的目标价位。 金色线条,表示空方的目标价位。 手动指标赋予您完全的控制和灵活性,让您根据实时市场环境和个人直觉调整级别。它们迫使您更深入地亲自分析价格走势,帮助您真正理解支撑、阻力和形态是如何形成的。依靠人工判断,可以过滤掉自动系统常常误判的大量“噪音”,减少错误信号。而且,因您亲自设定每个级别,可在突发新闻或极端行情时立即调整,无需等候代码更新。 隐藏于简单游戏背后的神圣力量!
Chart AI Assistant – 一键完成实时图表的 AI 分析 AI 会像您一样查看图表的画面。它看到屏幕上的蜡烛、价位和指标,读懂它们,然后告诉您正在发生什么。 Chart AI Assistant 像经验丰富的交易者一样分析您的图表,并告诉您它看到了什么:结构、区域、流动性、形态、成交量以及可能的下一步走势。它适用于任何品种和任何周期。按下 ANALYZE,答案就会以您的语言显示在图表上。 该助手不交易,也不开仓或平仓。它为您提供第二个意见,而每一个决定仍由您自己做出。 工作方式 将该 EA 加载到任何图表上。 勾选您关心的问题。 按下 ANALYZE。 答案会显示在图表旁的面板上,关键价格水平会绘制在图表上。 只问您想知道的 共有九个问题按钮。您可以任意组合: BOS / CHOCH Order Block Fair Value Gap Nearest Liquidity Chart Pattern Candle Pattern What is the Trend? Analyze Volume Most Important 全部九项都勾选时,您将得到完整分析:市场背
筛选:
igivaka
93
igivaka 2026.02.20 16:58 
 

A deep understanding of forex, the philosophy of forex and life, translated into an understandable, easily applicable, profitable, and underpriced Meravith indicator (in fact, a complete system). On top of that, you get a dedicated, friendly, knowledgeable, and always available author ready to help.

zeke21t2
767
zeke21t2 2026.02.14 18:32 
 

The Meravith and the Transaction Speed ​​are two of the three best indicators I know. They integrate three perspectives: ΔP (price change), ΔV (trading volume change), and ΔT (time change), accurately analyze the market, and are designed to be intuitively applicable to actual trading. It's fascinating to watch the price move exactly as the indicators suggest. Despite their intuitive interface, both indicators are incredibly deep, and your research can make them even more useful. Winning EAs are great, but winning through discretionary trading is even better, right? If that sounds like you, I highly recommend them. The author is a very honest and kind person, and I admire his dedication to market research.

Mase
1799
Mase 2025.10.24 05:51 
 

one of the best tools i have ever used, highly recommend it. Ivan spends a lot time improving it consistently and is highly supportive!

回复评论