Meravith
- 지표
- 버전: 5.14
- 업데이트됨: 8 6월 2026
- 활성화: 20

마켓 메이커를 위한 도구.
Meravith는 다음과 같은 기능을 제공합니다:
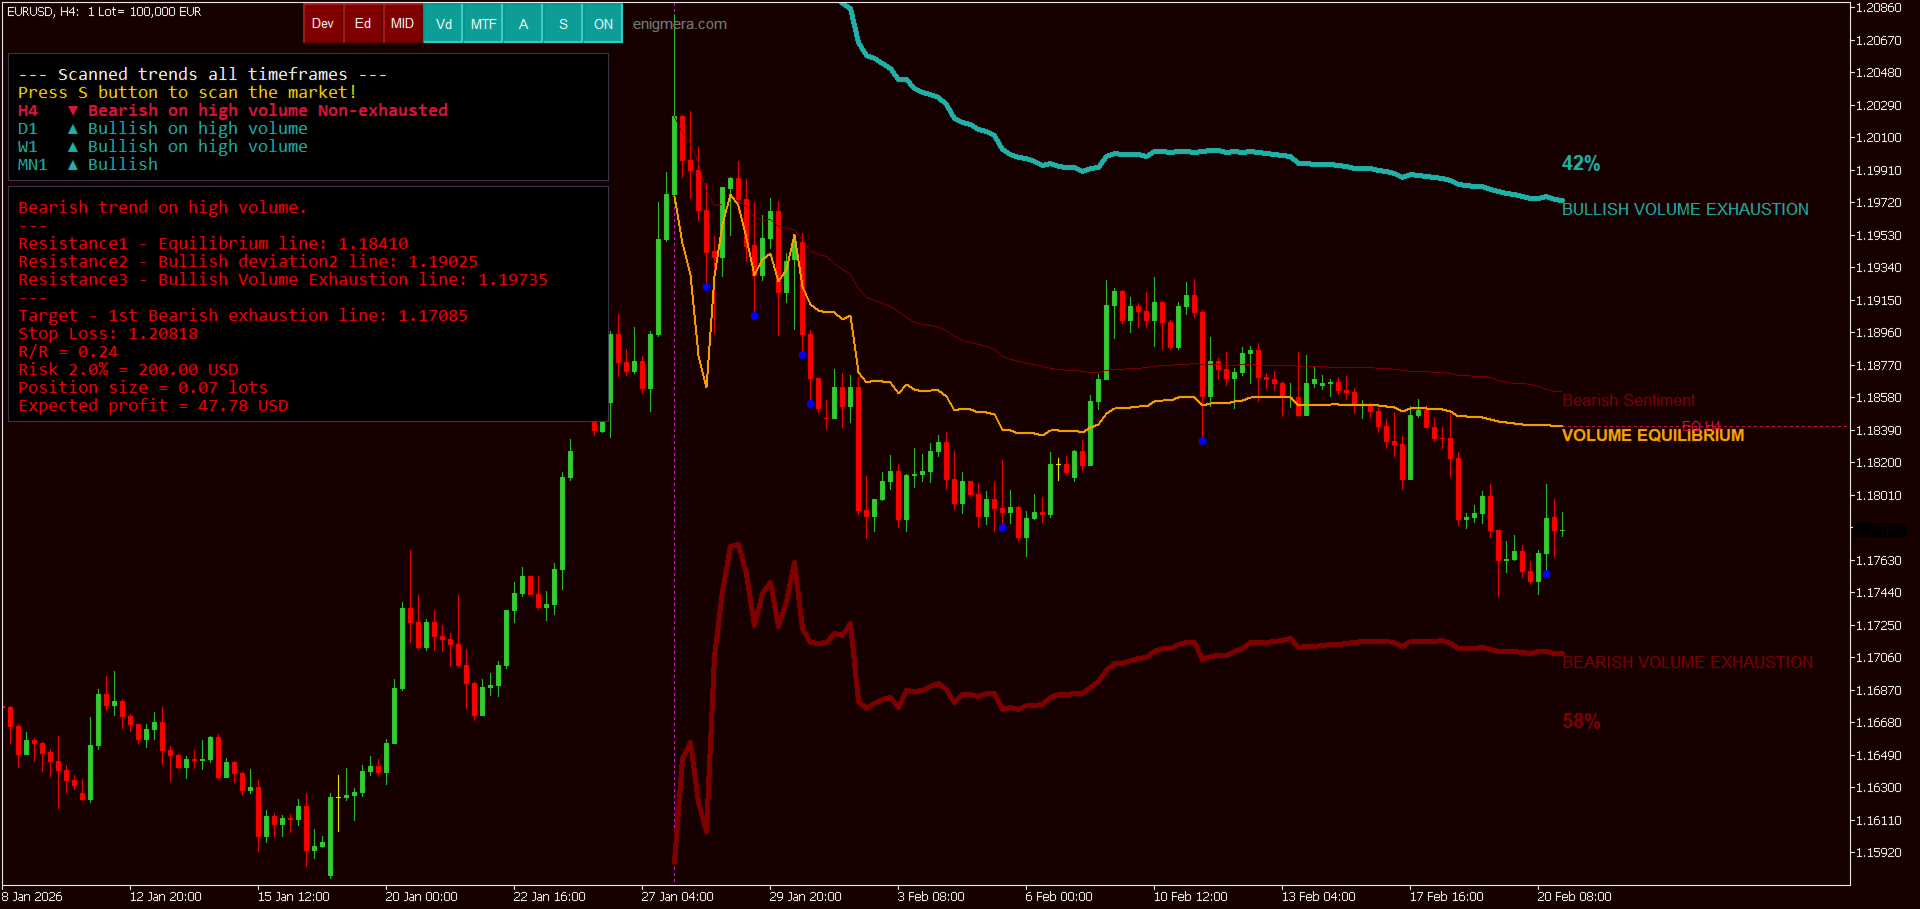
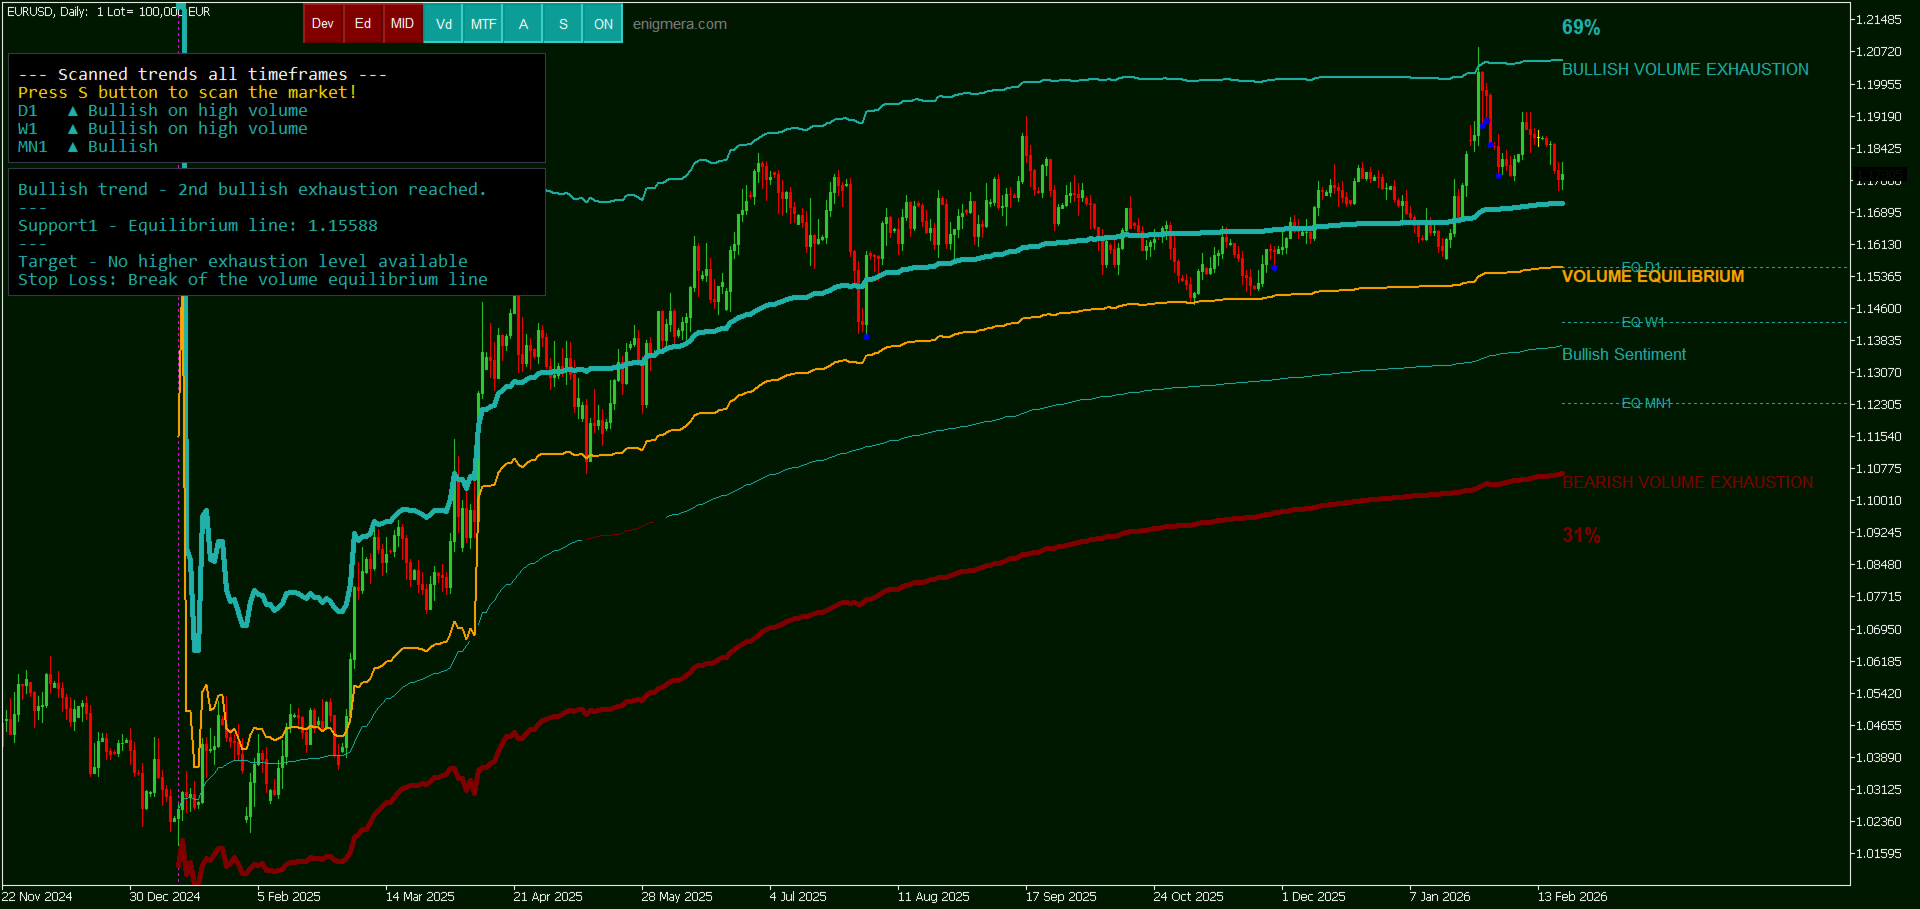
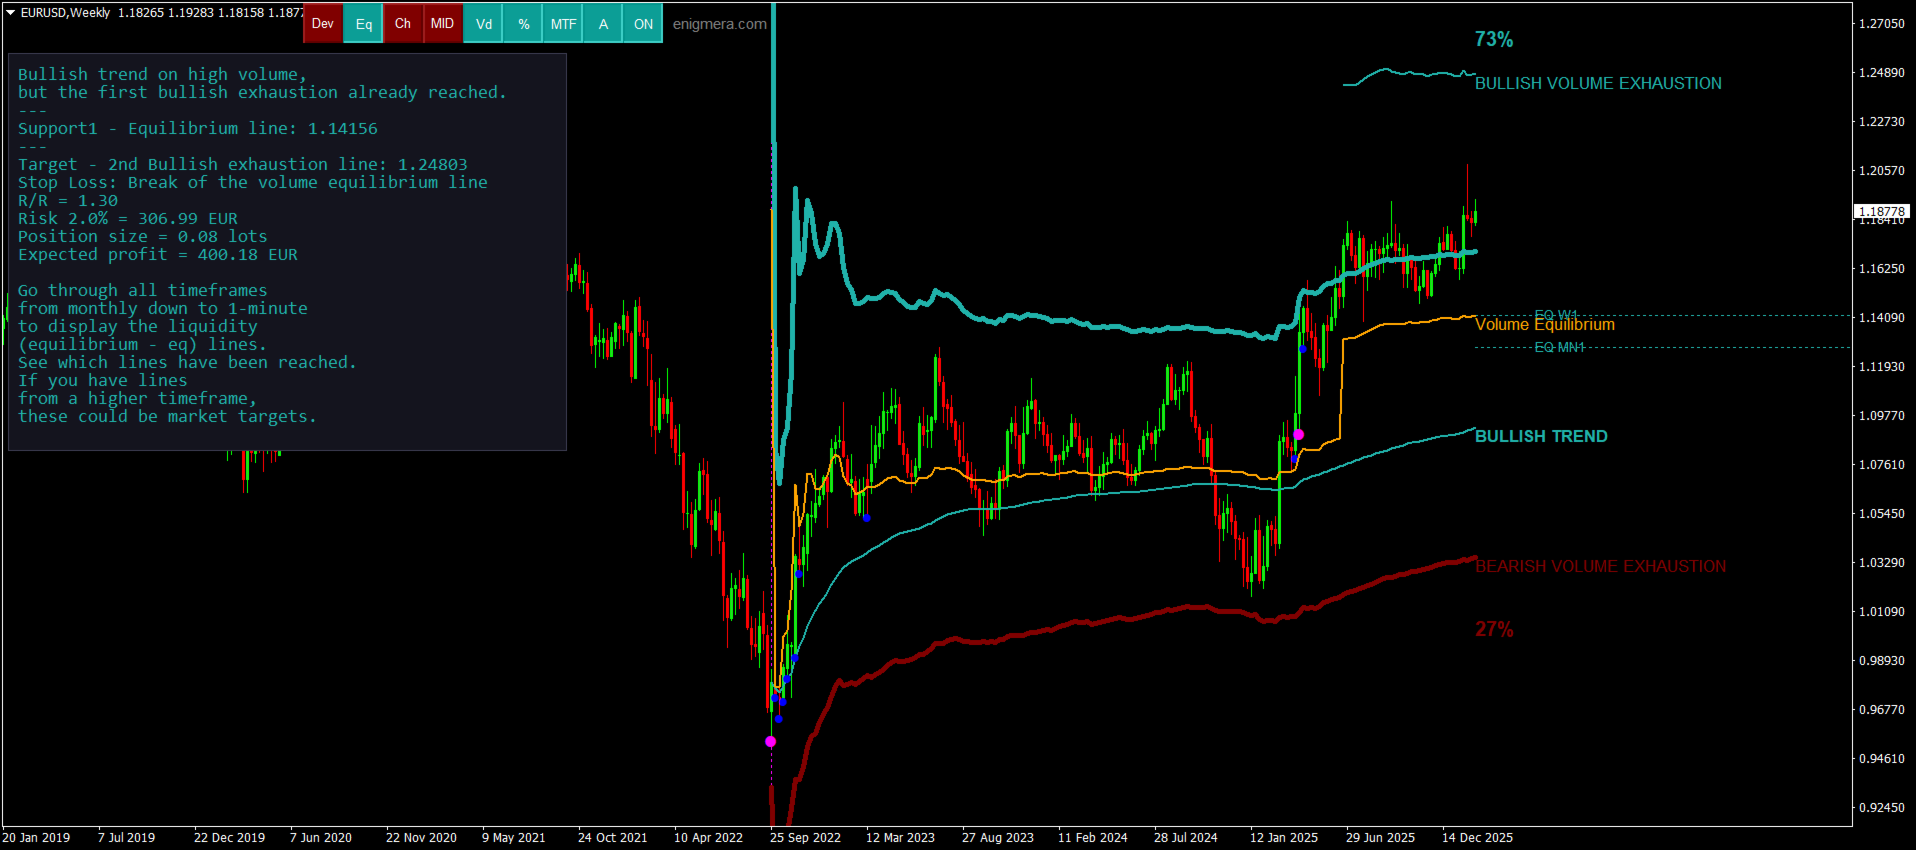
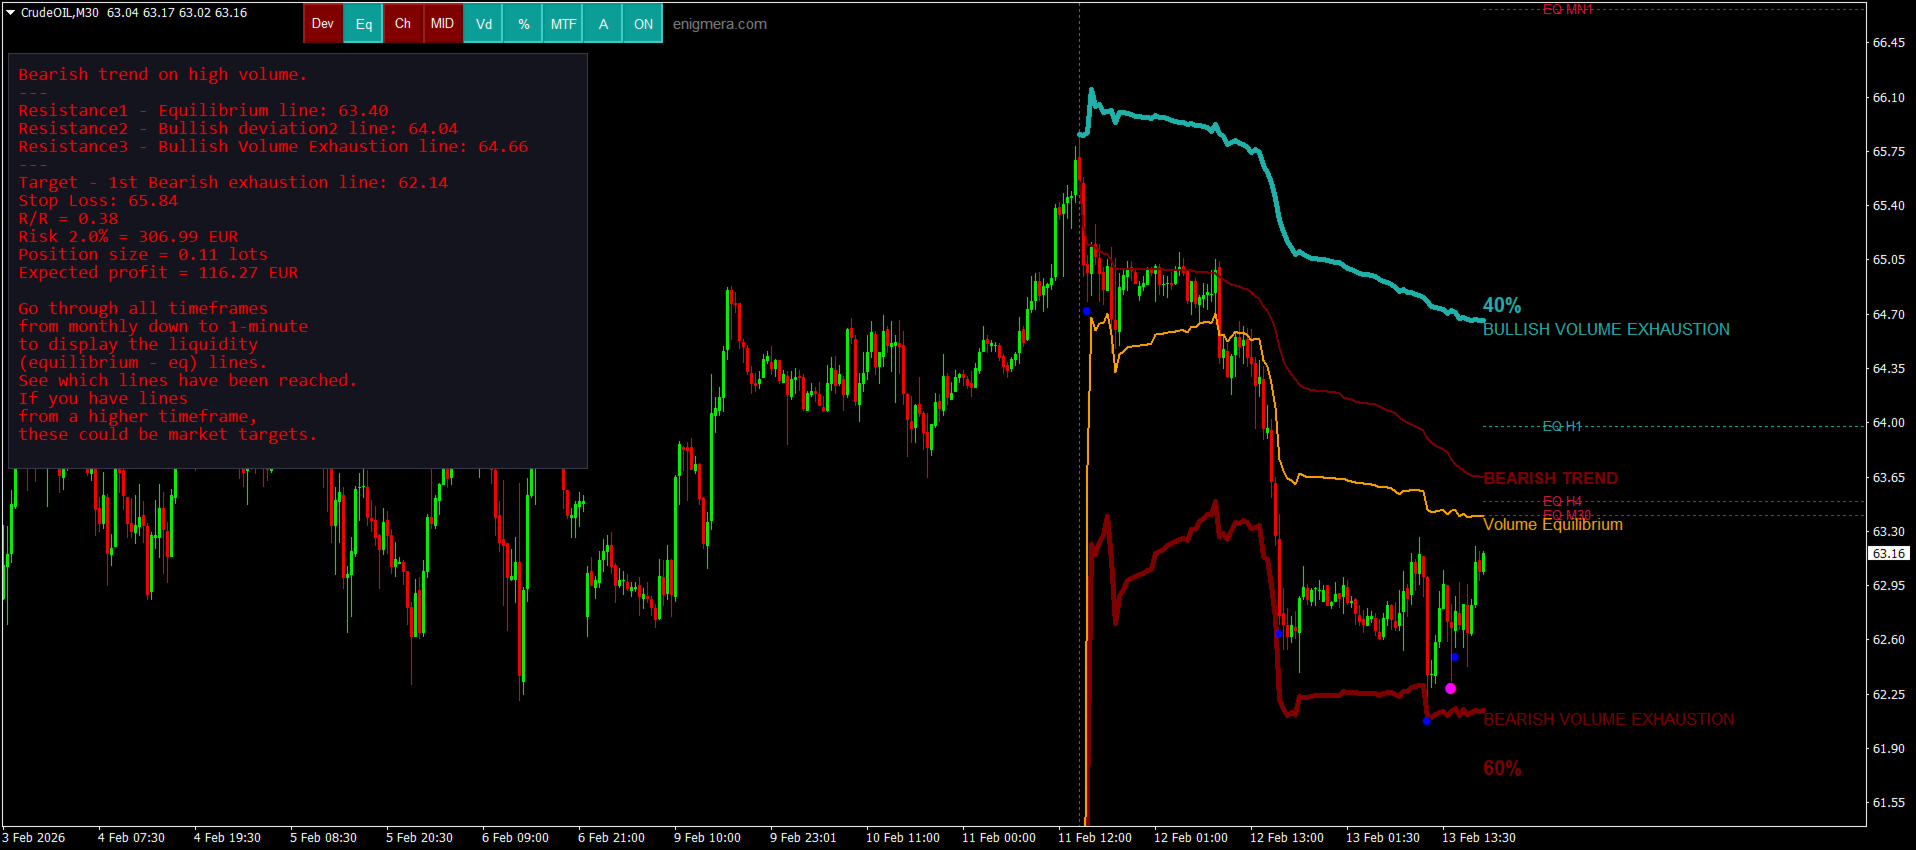
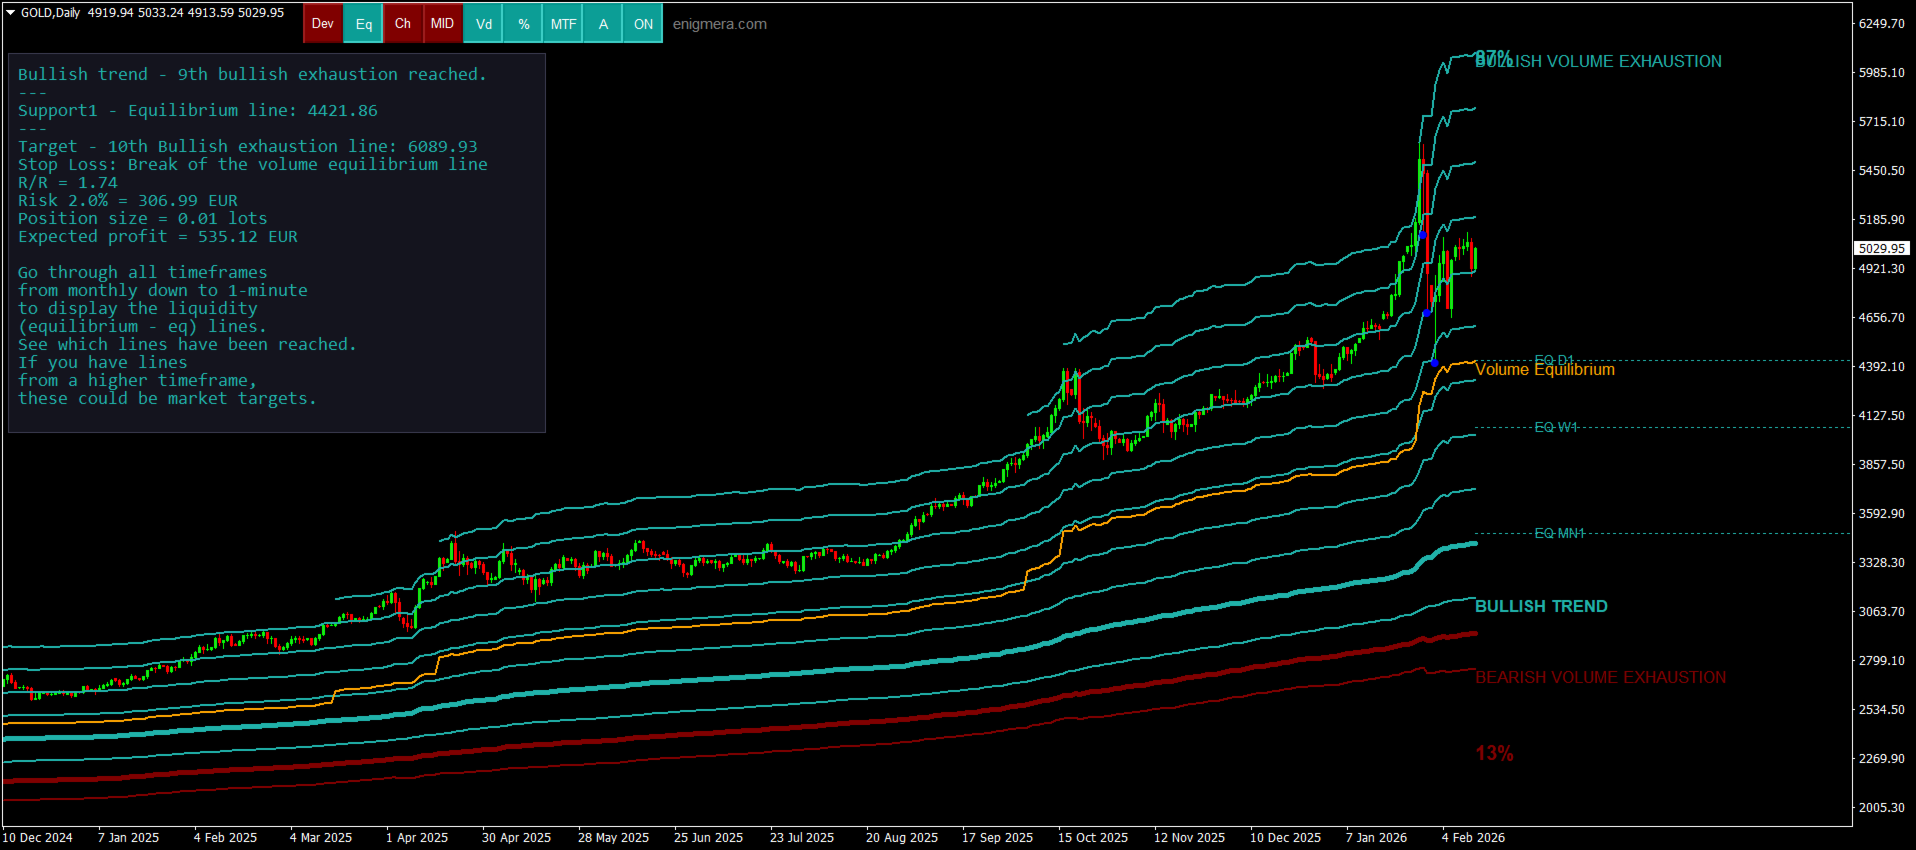
모든 타임프레임을 분석하고 현재 유효한 추세를 표시합니다.
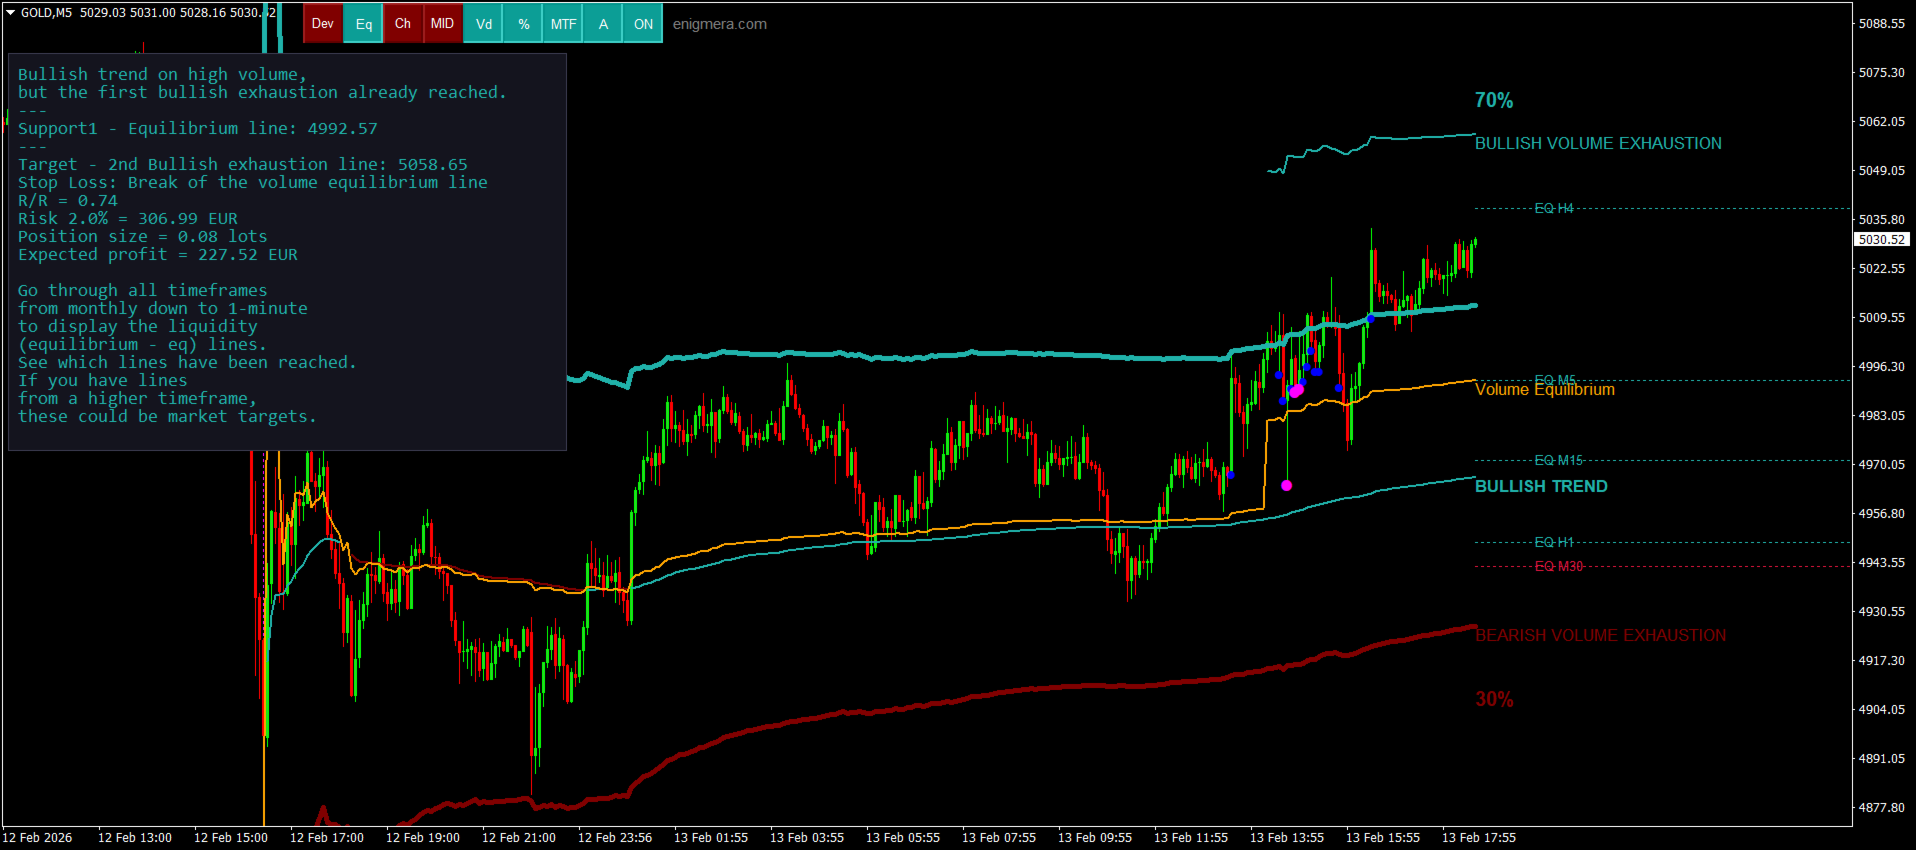
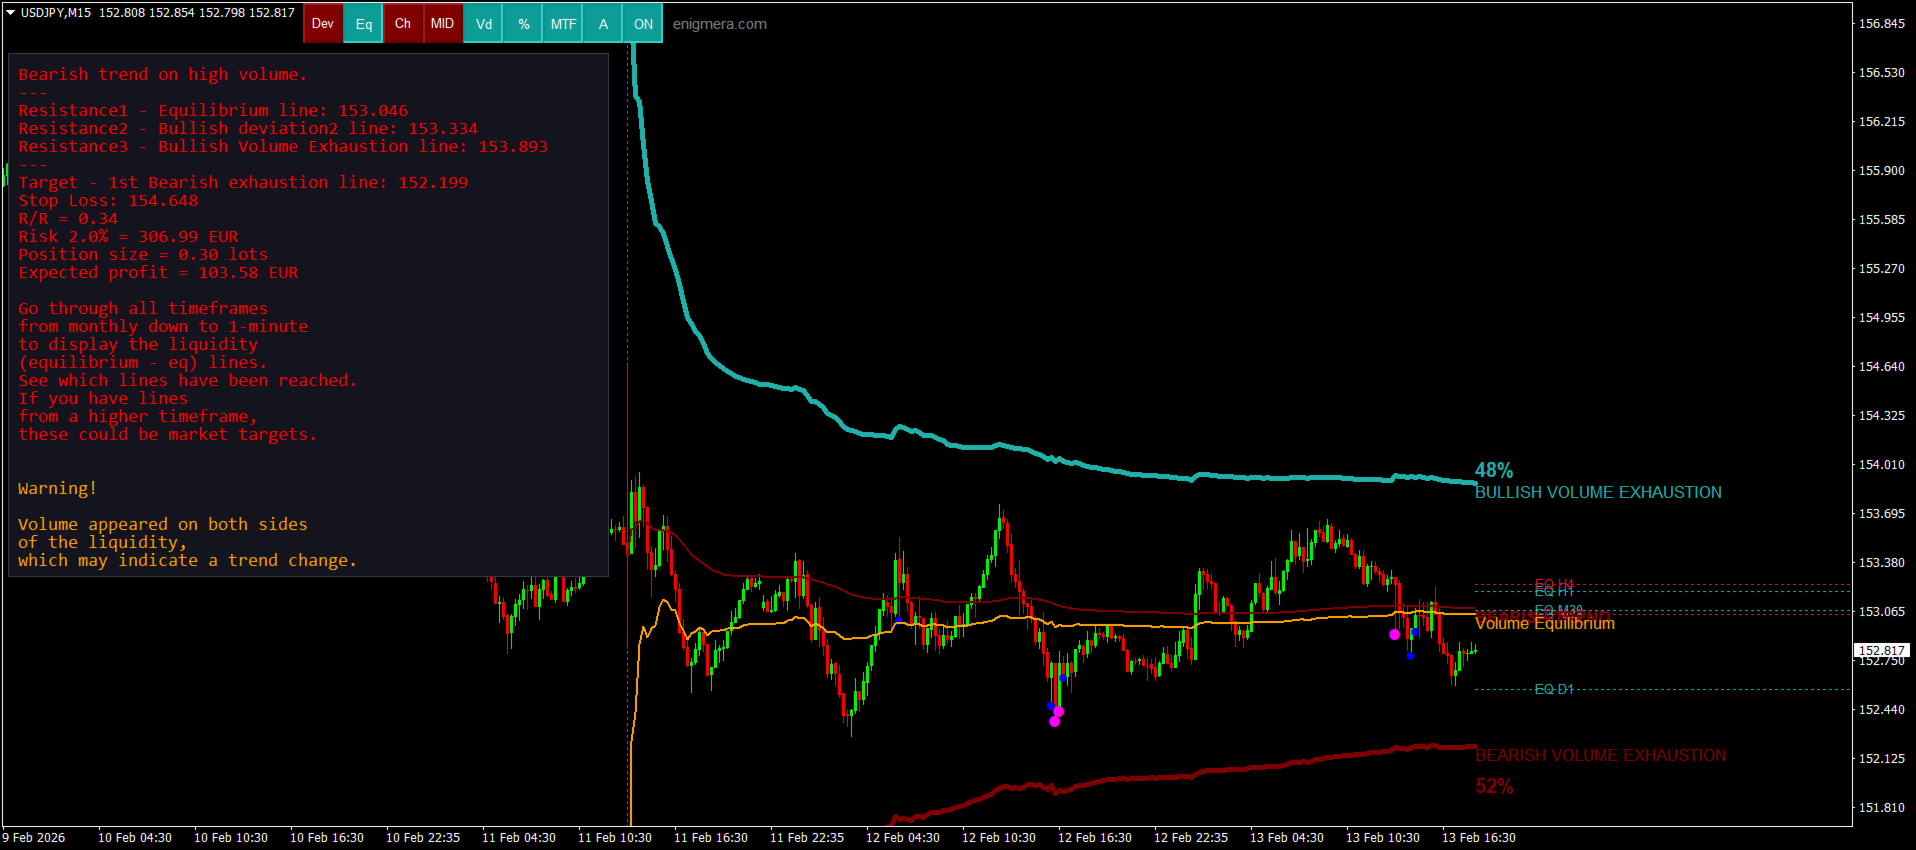
강세와 약세 거래량이 동일한 유동성 구간(거래량 균형 구간)을 강조 표시합니다.
서로 다른 타임프레임의 모든 유동성 레벨을 차트에 직접 표시합니다.
텍스트 기반 시장 분석을 생성하여 참고용으로 제공합니다.
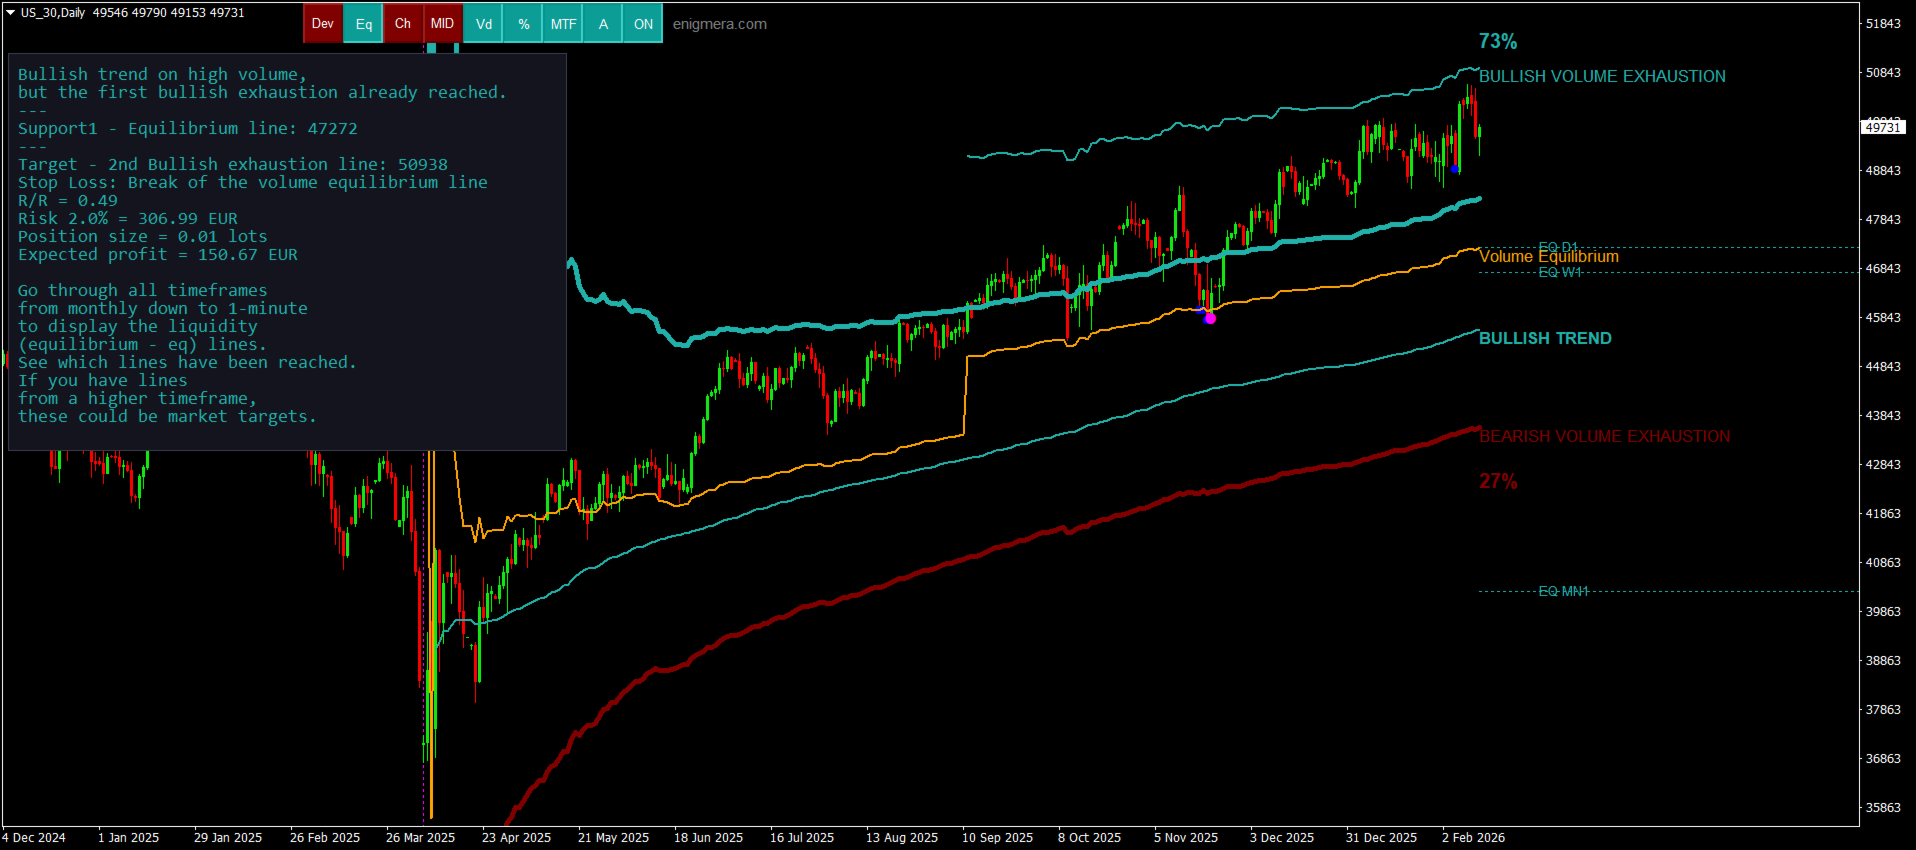
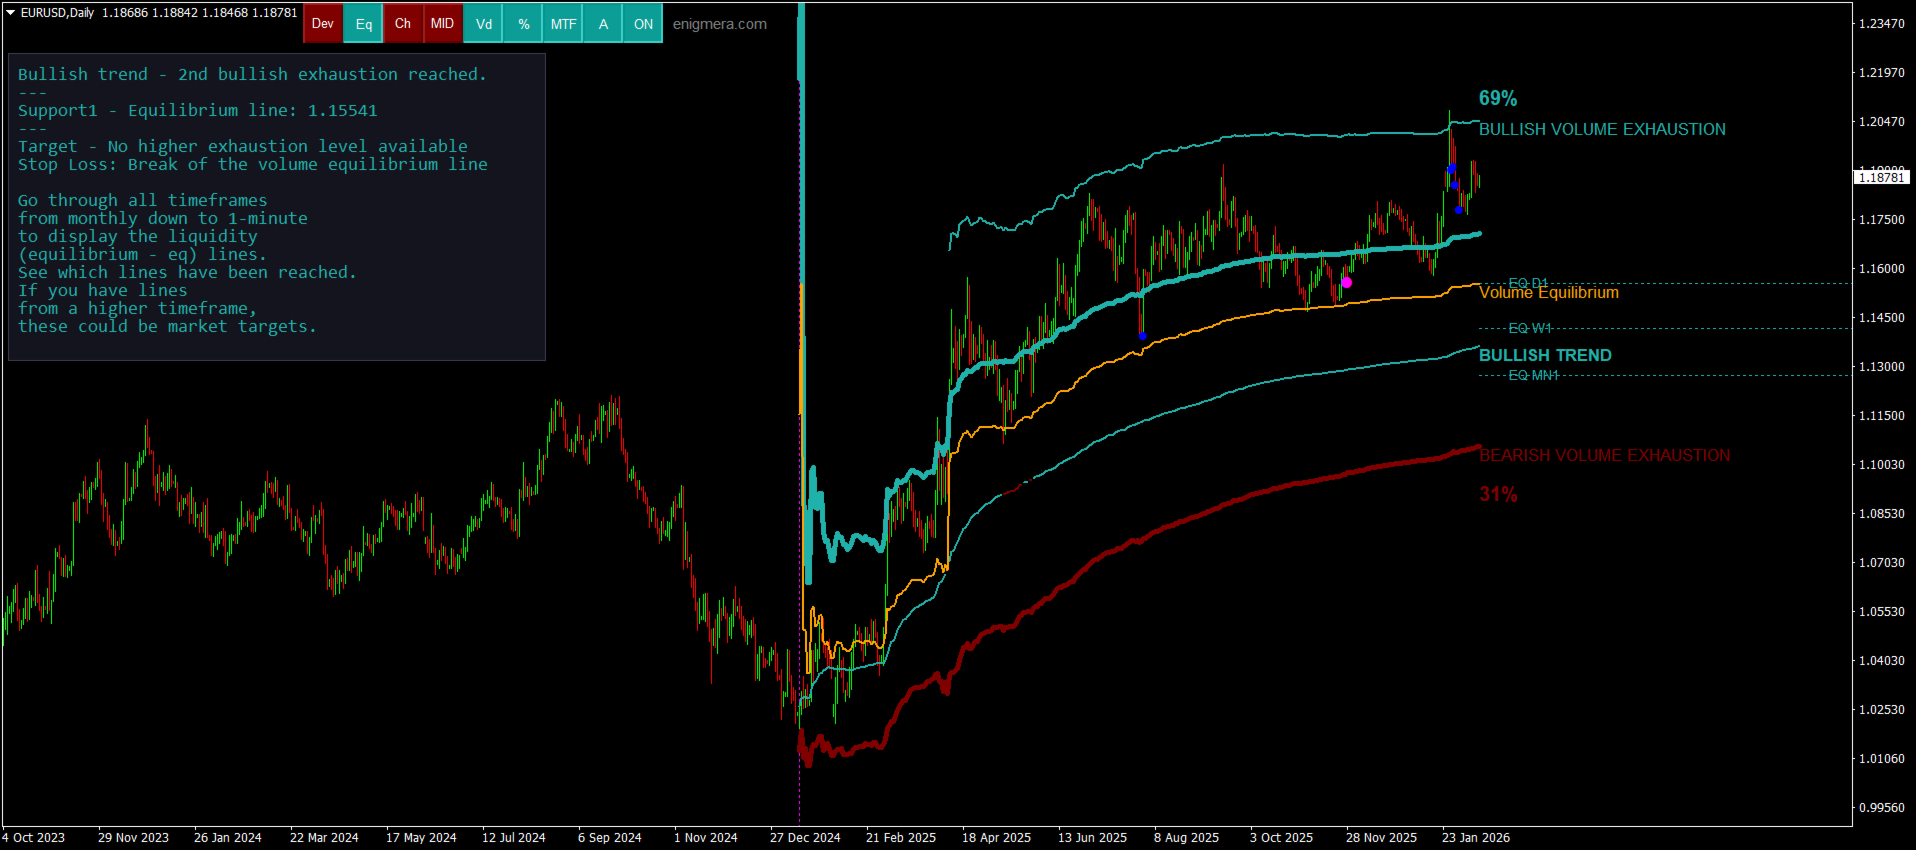
현재 추세를 기반으로 목표가, 지지선 및 손절가를 계산합니다.
거래의 위험 대비 보상 비율(Risk/Reward)을 계산합니다.
계좌 잔고에 따라 포지션 크기를 산출하고 잠재 수익을 추정합니다.
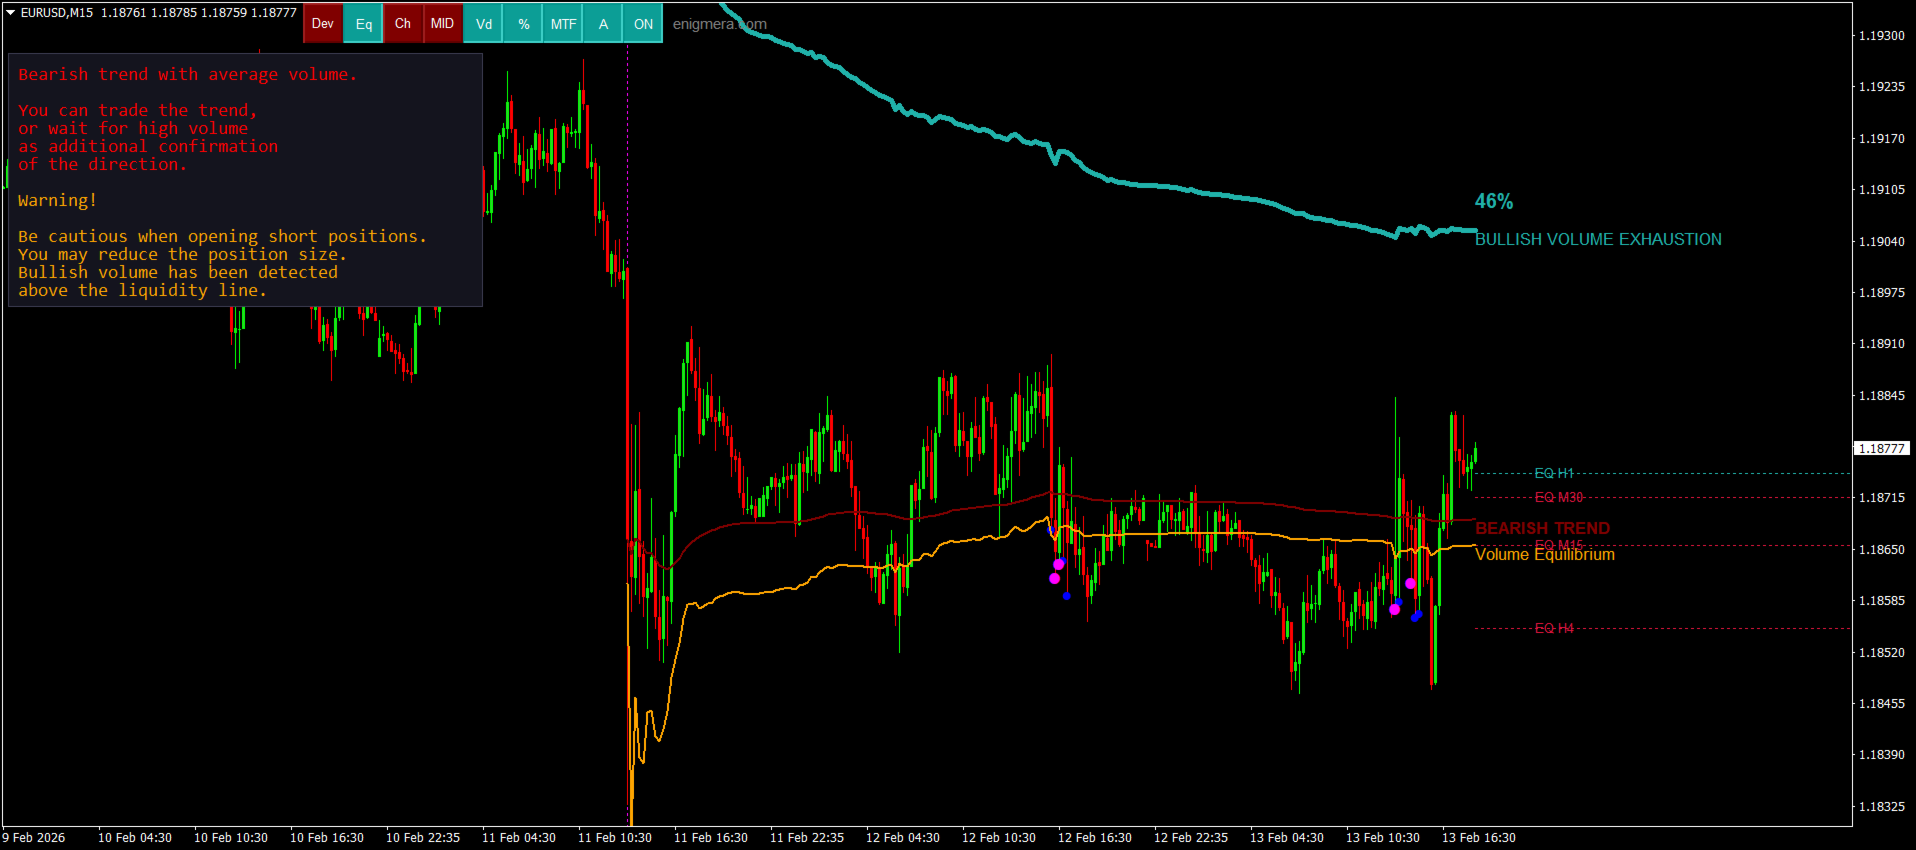
시장에 중대한 변화가 발생할 경우 경고도 제공합니다.
지표의 주요 라인:
강세/약세 거래량 소진 라인 — 목표가로 사용됩니다.
시장 추세를 나타내는 라인. 시장이 강세인지 약세인지에 따라 색상이 변경되며 추세 지지선 역할을 합니다. 색상은 주로 시장 심리를 보여줍니다.
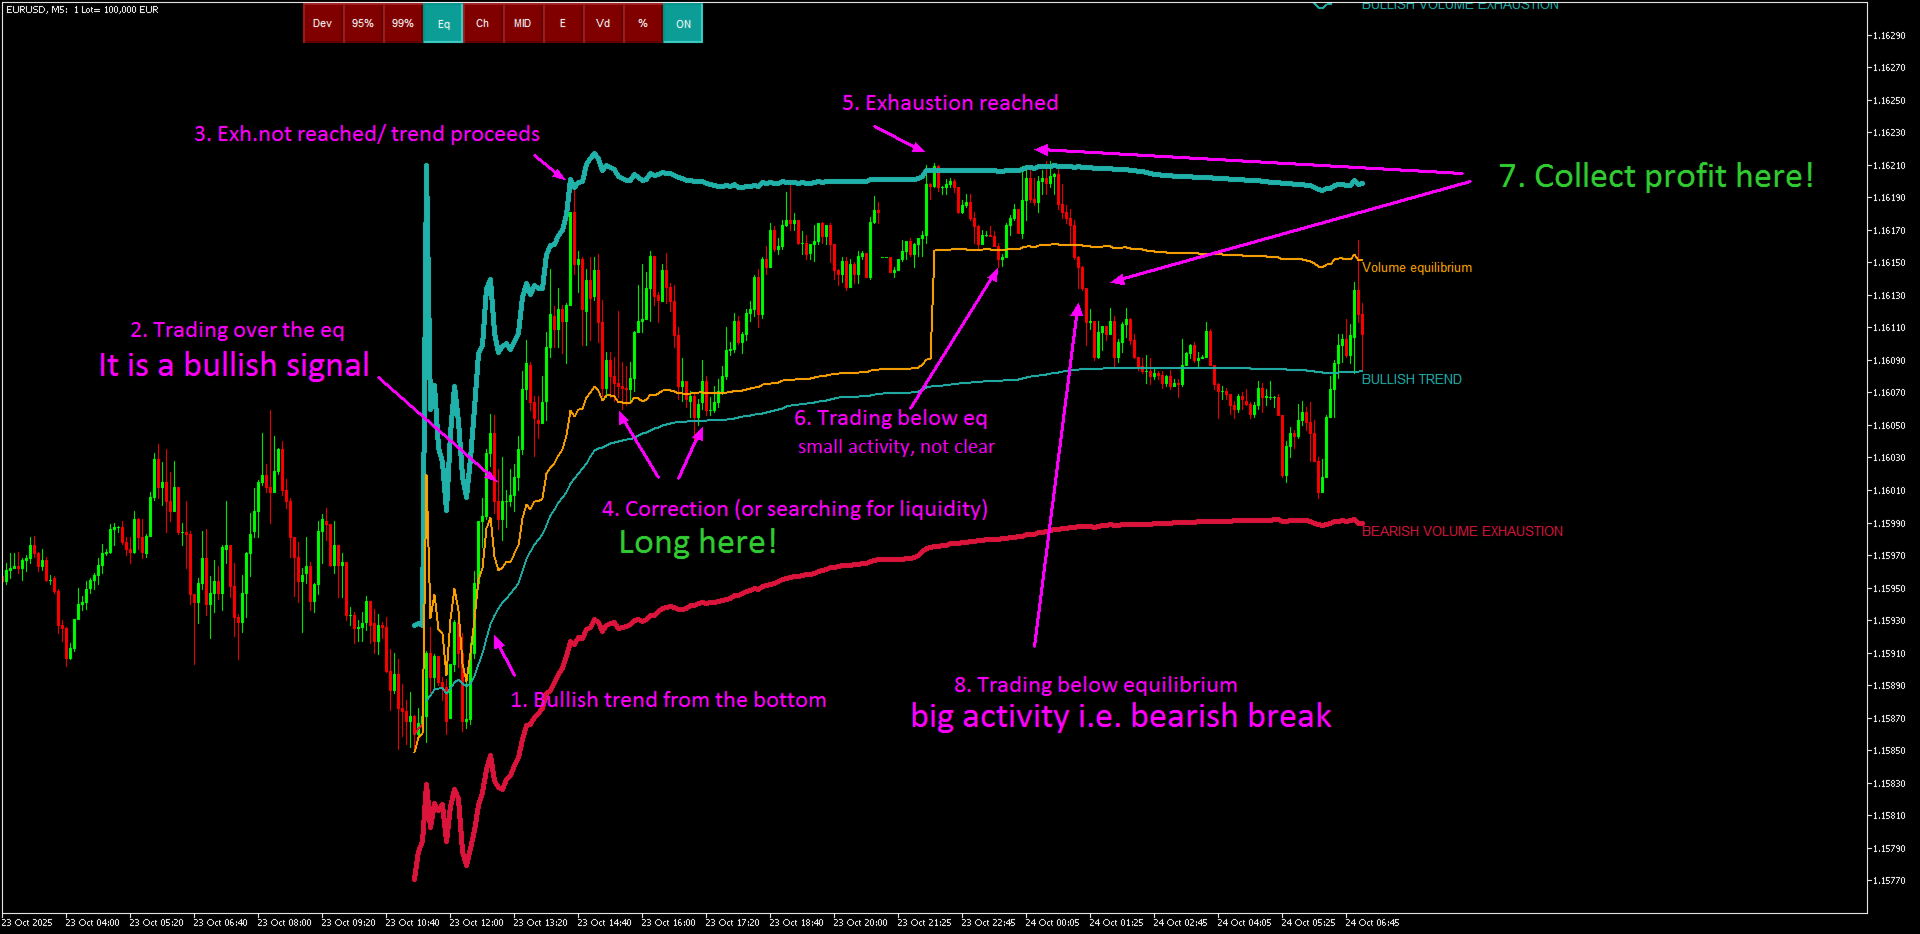
거래량 균형선(Eq). Eq(Volume Equilibrium) 라인은 시스템의 핵심입니다. 이는 매수자와 매도자 사이의 거래량 균형 지점을 나타냅니다. 즉, 시장의 유동성입니다. Eq 위로 돌파하면 강세 편향을, 아래로 돌파하면 약세 편향을 의미합니다. 돌파 이후에는 조정을 기다려야 합니다 — 가격이 반대 추세의 편차선 또는 소진선으로 되돌아올 때까지 기다립니다.
사용 방법: 차트에 추가하기만 하면 됩니다.
Meravith는 추세와 조정 모두를 분석합니다.
추세선과 거래량 소진선 사이의 거리가 클수록 해당 방향의 거래량이 더 크다는 의미입니다.
추세선은 진입 지점으로, 소진선은 수익 실현 지점으로 활용할 수 있습니다.
Meravith에는 차트 내 버튼이 포함되어 있어 작업을 더욱 쉽고 빠르게 할 수 있습니다 — 모든 핵심 기능을 차트에서 직접 켜거나 끌 수 있습니다. 각 버튼의 기능은 다음과 같습니다:
DEV – 지지선으로부터의 이중 편차를 표시합니다. 추세 내부 거래량이 높을 경우 추가 지지선으로 작용할 수 있습니다.
Eq – 거래량 균형선. 시장의 유동성 라인으로, 강세 거래량과 약세 거래량이 동일한 지점입니다.
CH – 구조를 더 명확히 보기 위해 전체 지지 채널을 표시합니다.
MID – 전체 움직임의 중간 지점(50%)과 0%, 100% 레벨을 표시합니다.
Vd – 평균 대비 비정상적으로 높은 거래량 편차를 가진 캔들을 강조 표시합니다.
% – 강세 채널과 약세 채널을 백분율(%)로 비교합니다.
MFT – 이 버튼(멀티 타임프레임)을 누른 후 모든 타임프레임을 확인하십시오. 지표는 모든 유동성 레벨을 자동으로 계산하여 선택한 타임프레임에 표시합니다. 각 타임프레임은 자체 유동성 레벨과 상위 타임프레임의 레벨을 표시합니다. 하위 타임프레임의 레벨은 표시되지 않습니다. 이 버튼으로 해당 레벨을 표시하거나 숨길 수 있습니다.
A – Analysis. 이 버튼은 지표가 생성한 시장 텍스트 분석을 표시하거나 숨깁니다.
ON / OFF – 전체 지표를 켜거나 끕니다.
MT4, MT5 및 TradingView에서 사용 가능합니다.
권장 사항:
통화쌍: 모든 통화쌍, 모든 시장
타임프레임: 모든 타임프레임
최소 입금액: 제한 없음
계좌 유형: 제한 없음
브로커: 제한 없음
구매 전:
MetaTrader 테스터에서 먼저 테스트하시기 바랍니다. 문의 사항이 있으시면 MQL5 프로필을 통해 메시지를 보내주십시오.
구매 후 전체 지원 및 보너스 자료가 제공됩니다.


A deep understanding of forex, the philosophy of forex and life, translated into an understandable, easily applicable, profitable, and underpriced Meravith indicator (in fact, a complete system). On top of that, you get a dedicated, friendly, knowledgeable, and always available author ready to help.