Meravith
- Indicadores
- Versão: 5.14
- Atualizado: 8 junho 2026
- Ativações: 20

Ferramenta dos market makers.
O Meravith irá:
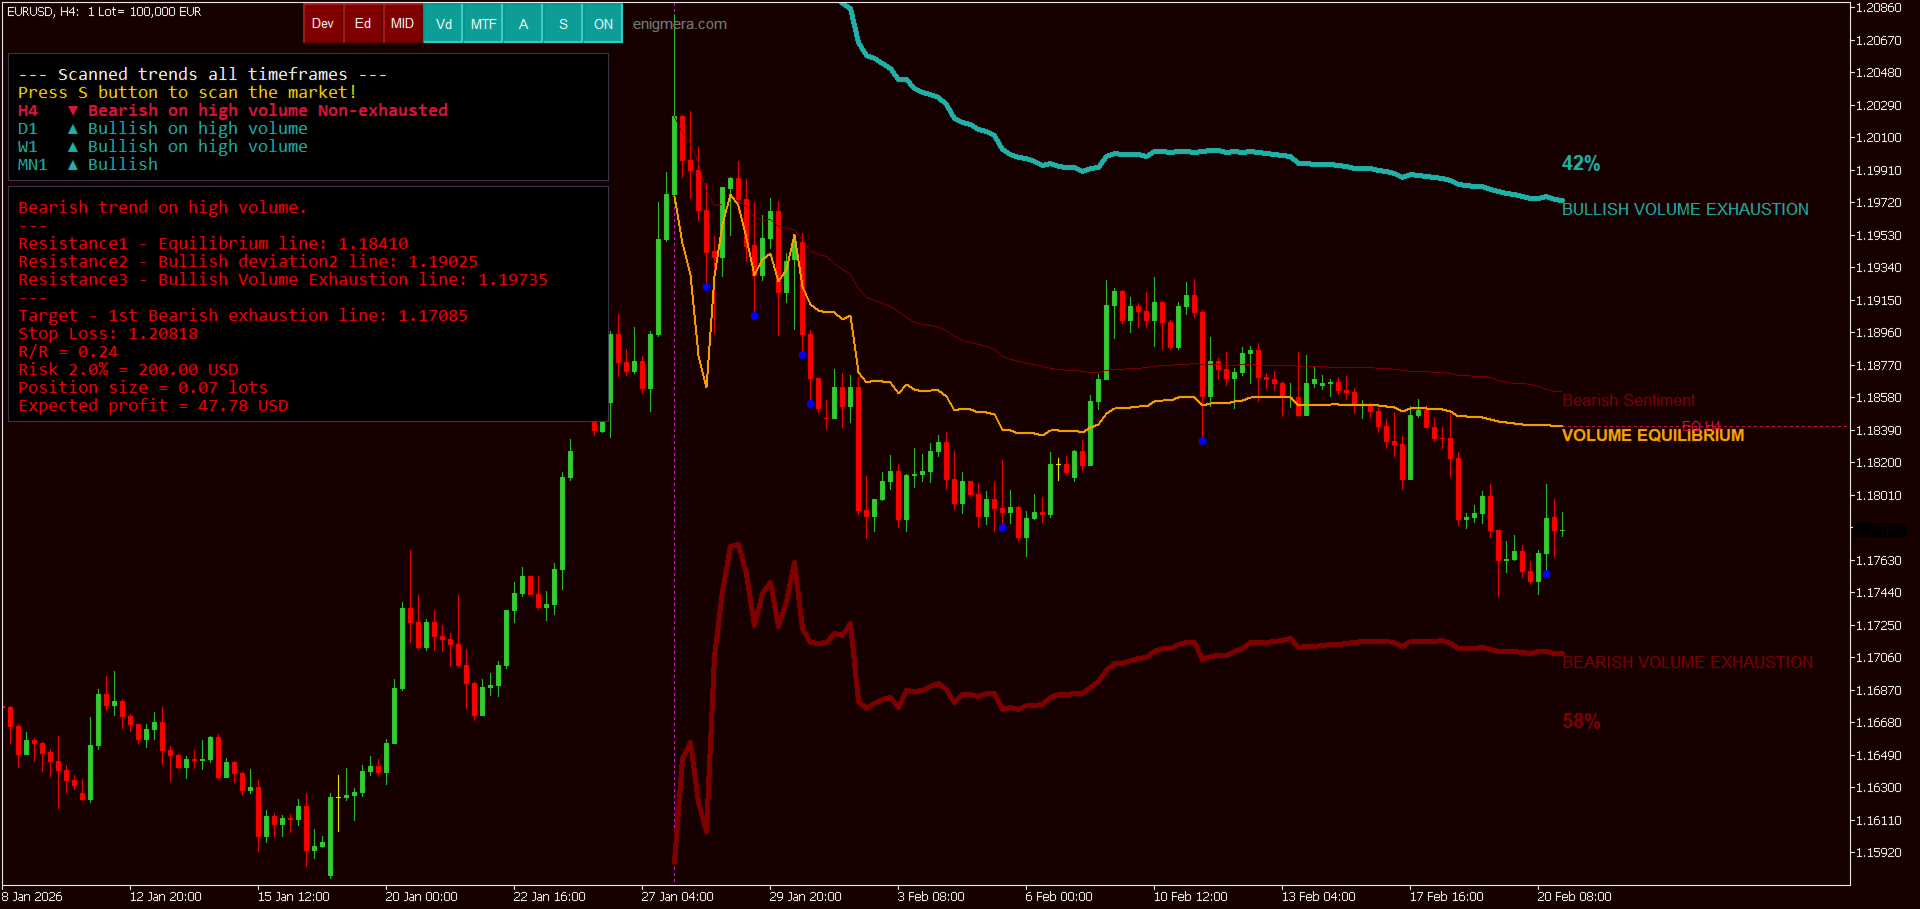
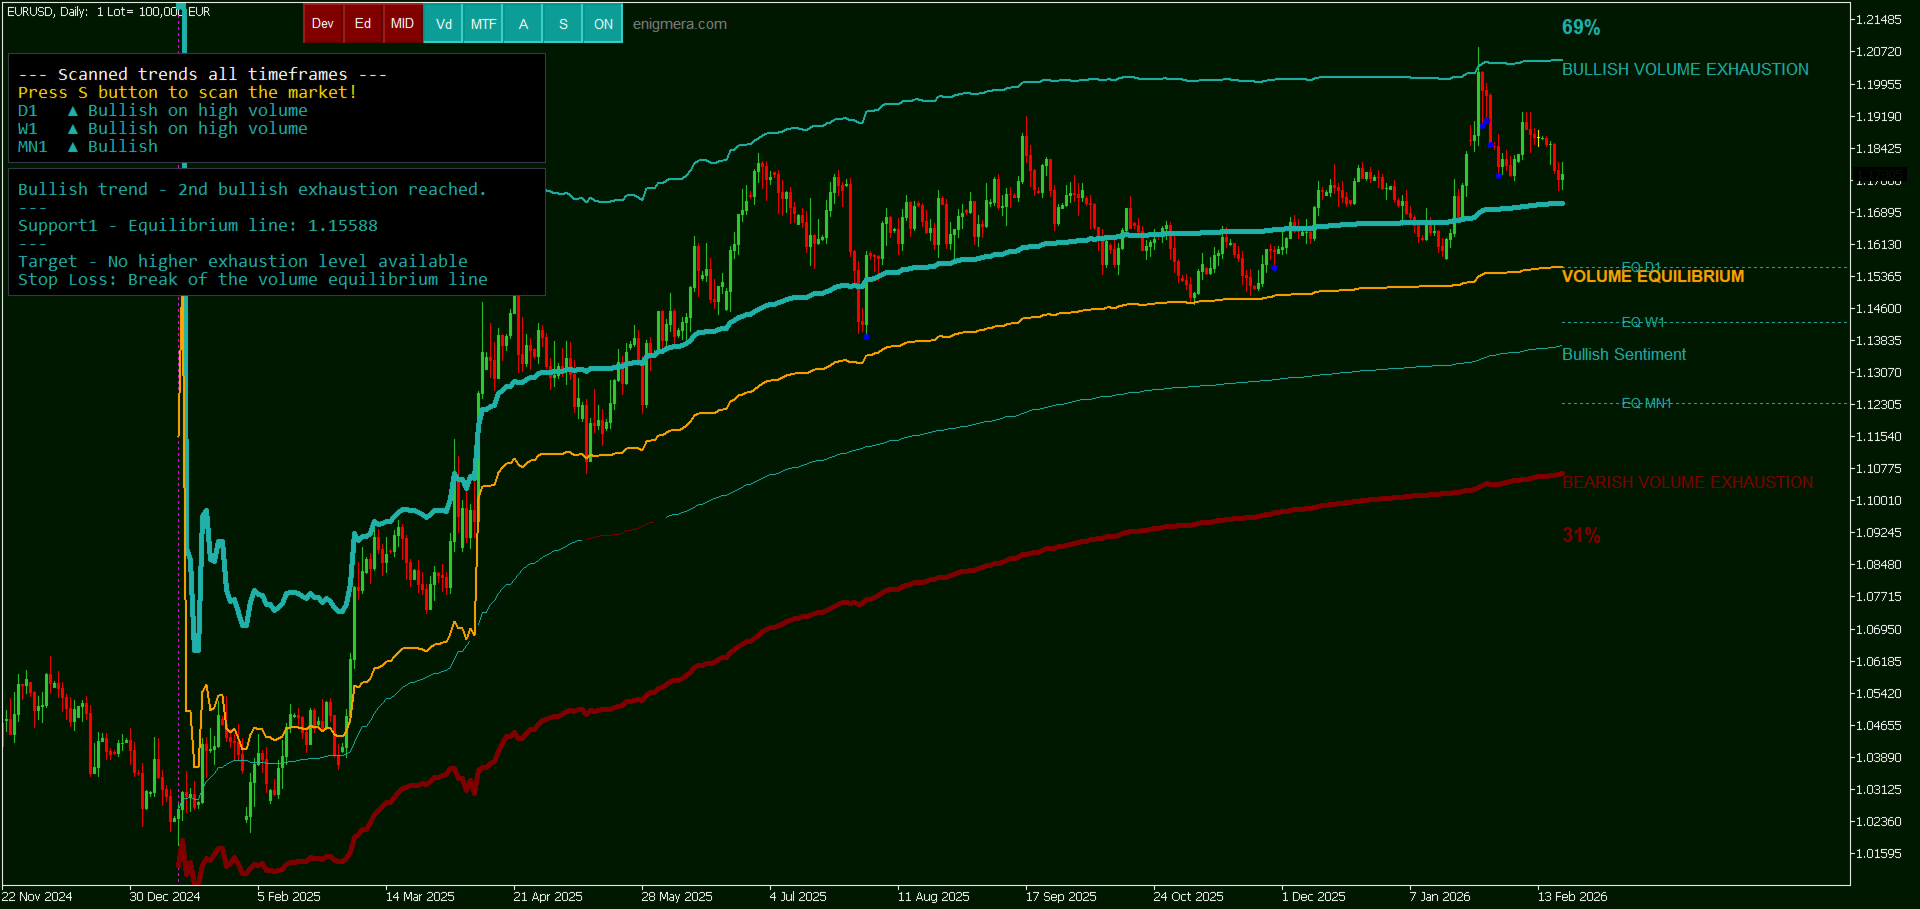
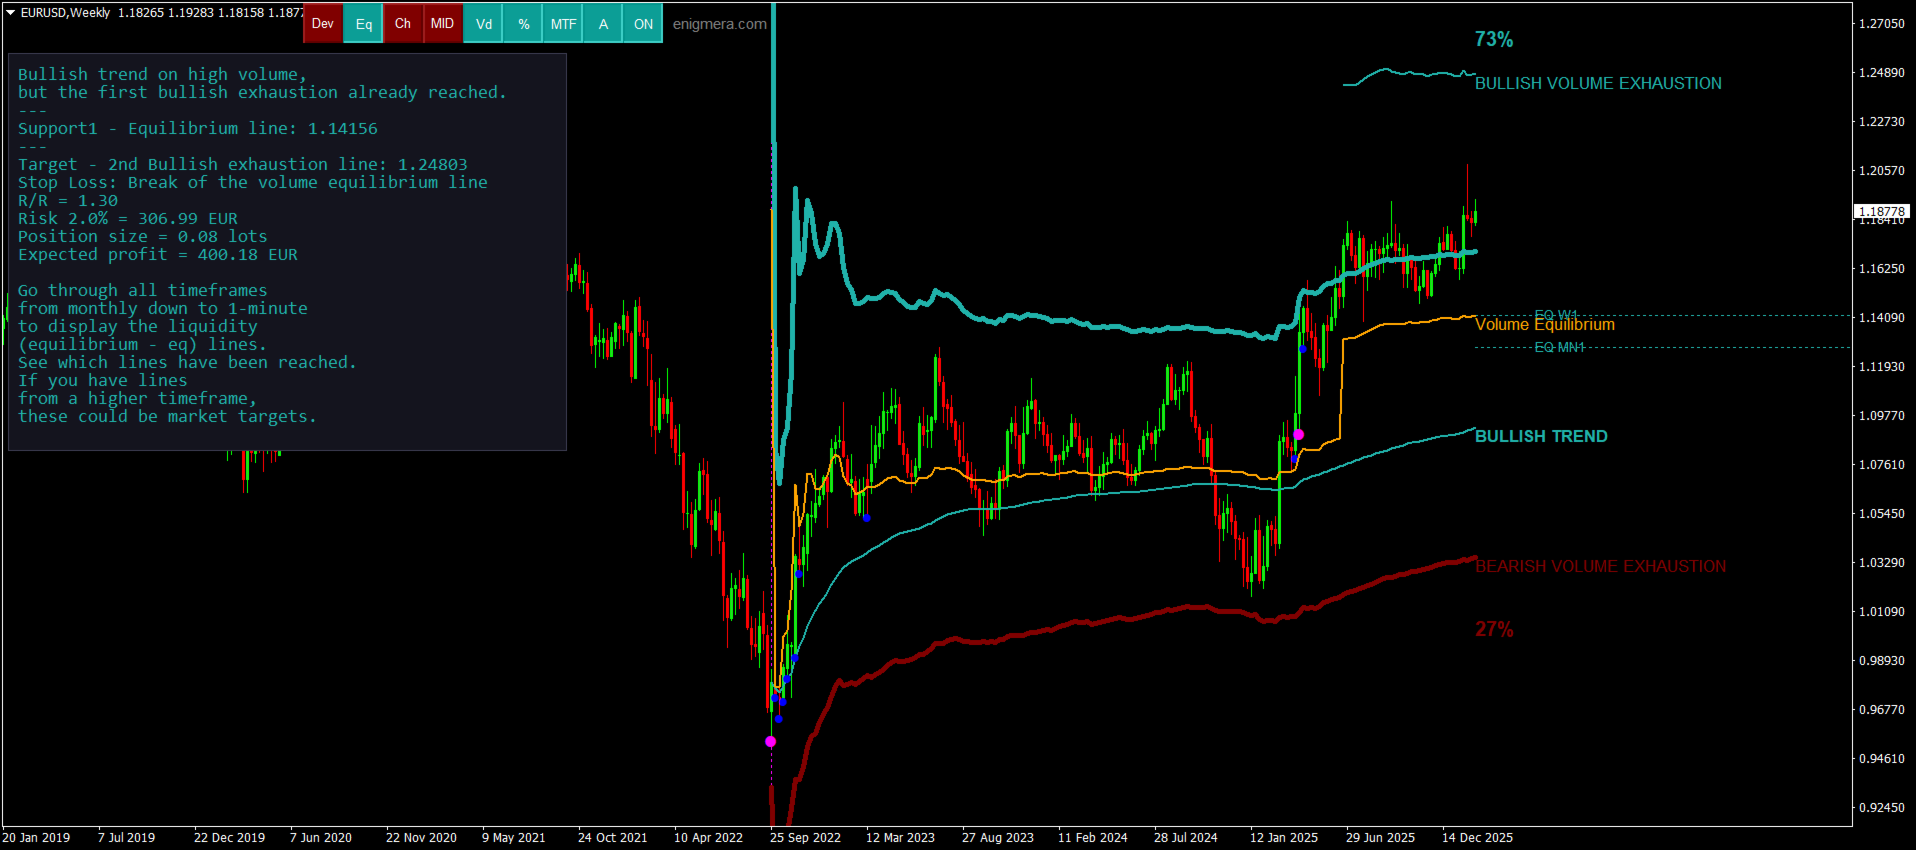
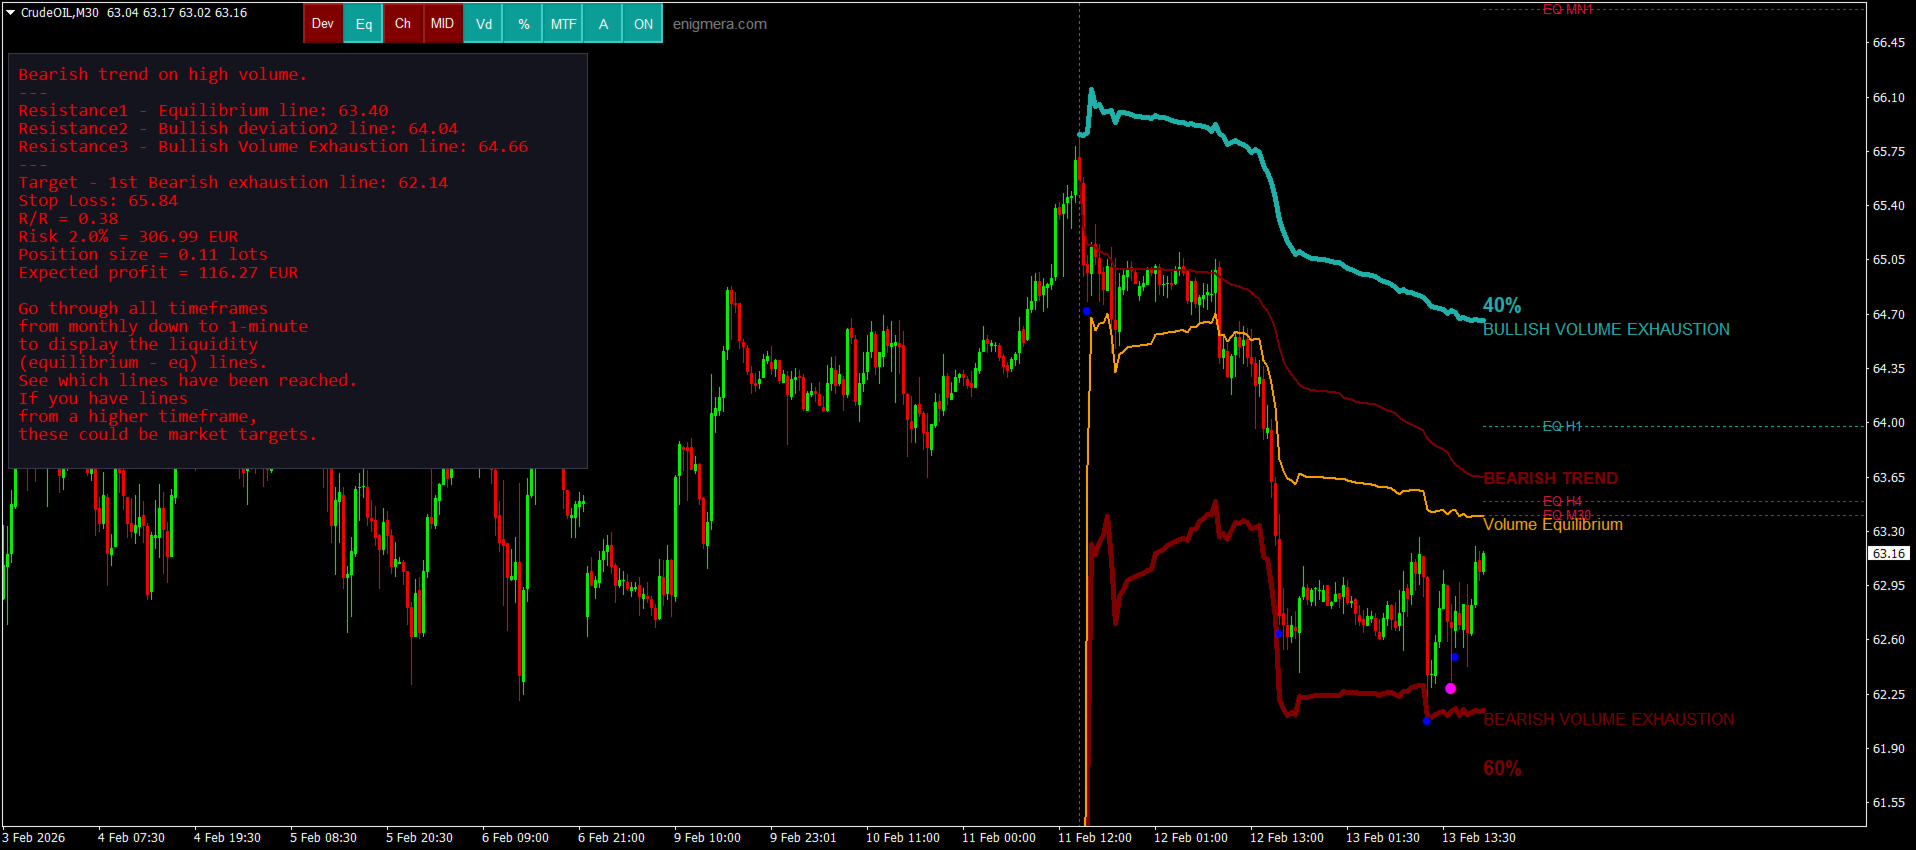
Analisar todos os timeframes e exibir a tendência atual em vigor.
Destacar zonas de liquidez (equilíbrio de volume) onde o volume comprador e vendedor é igual.
Mostrar todos os níveis de liquidez de diferentes timeframes diretamente no seu gráfico.
Gerar e apresentar análise de mercado em formato de texto para sua referência.
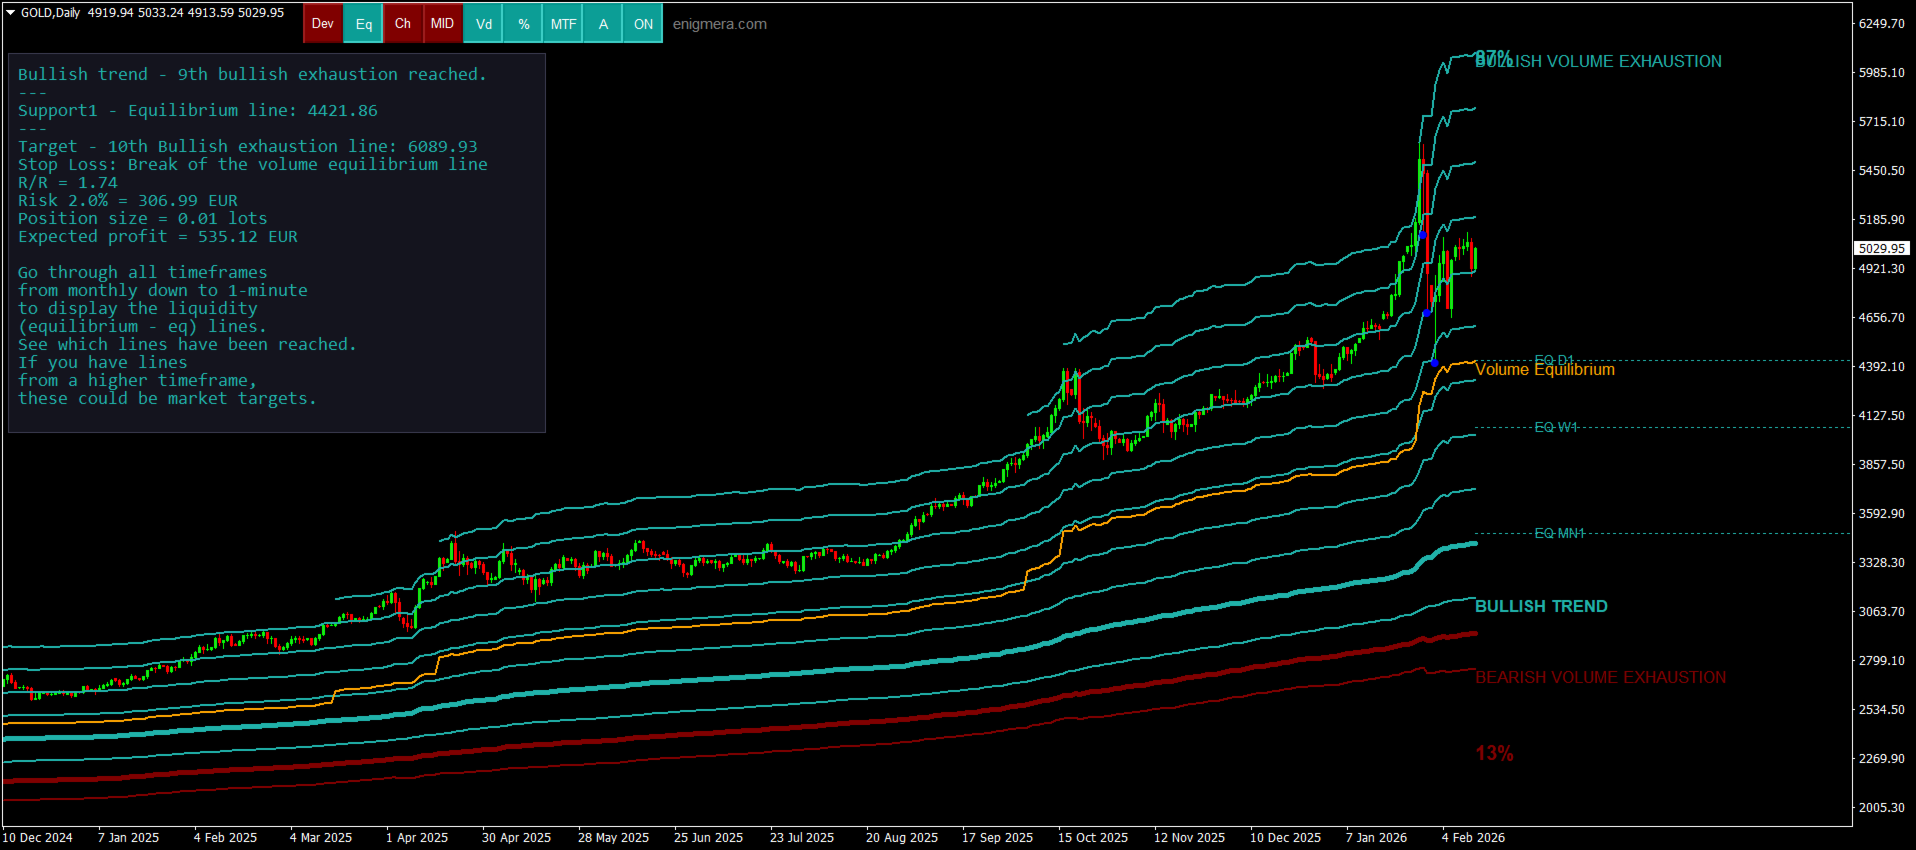
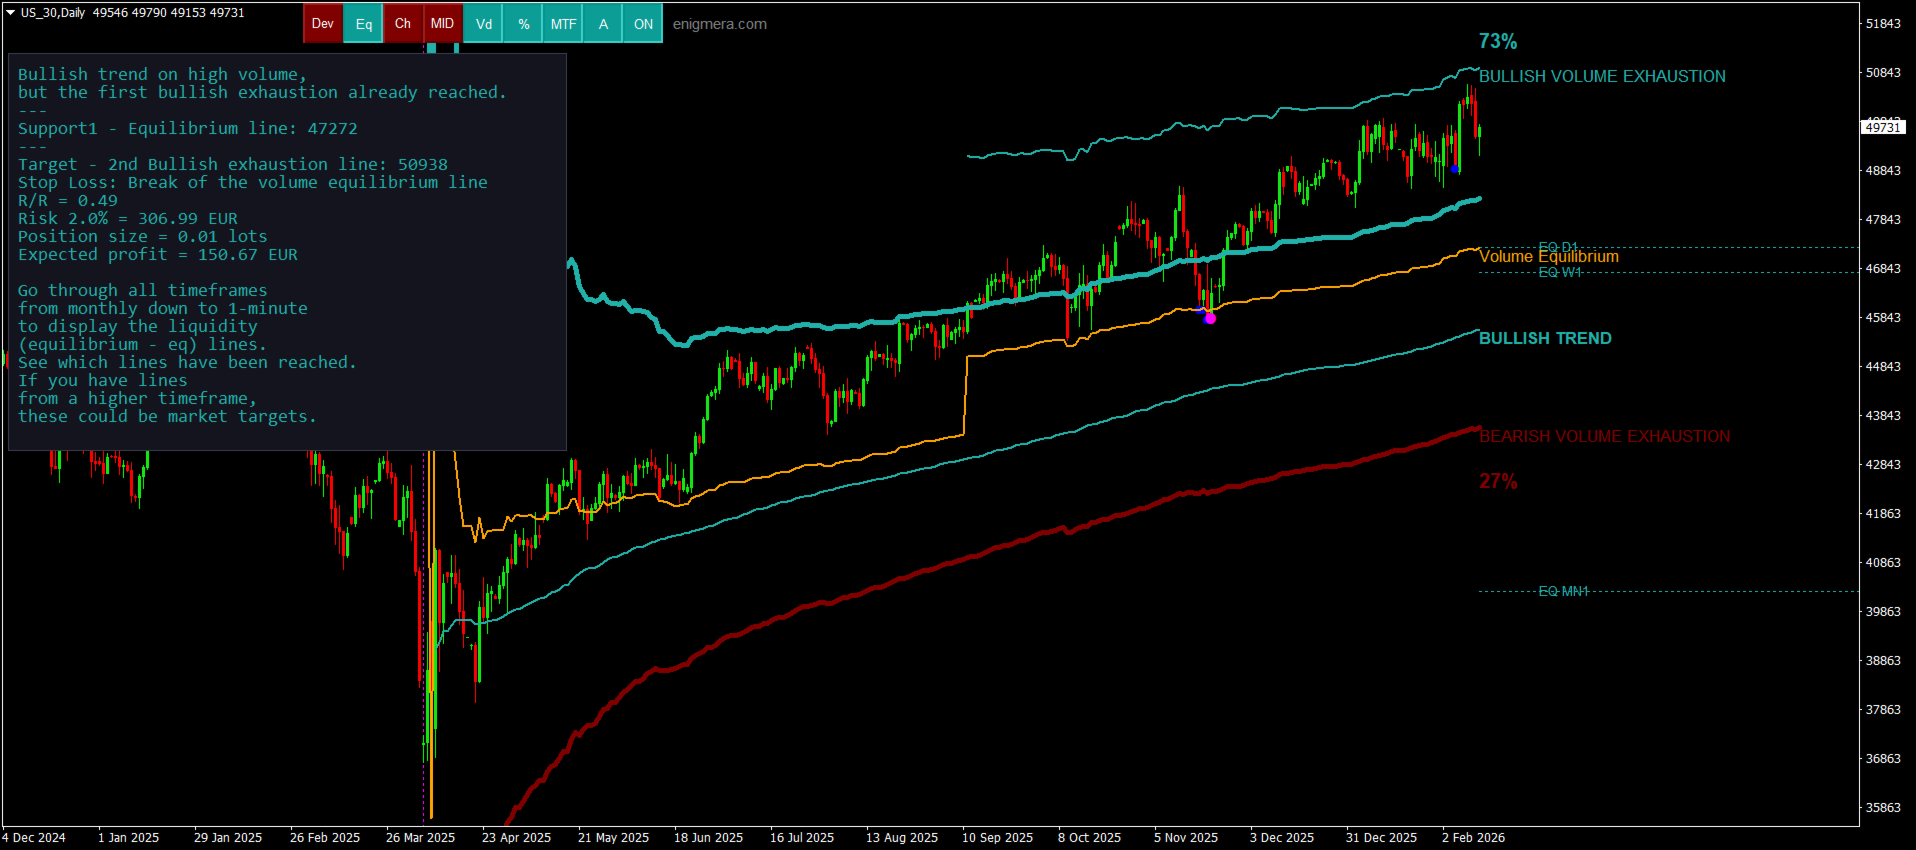
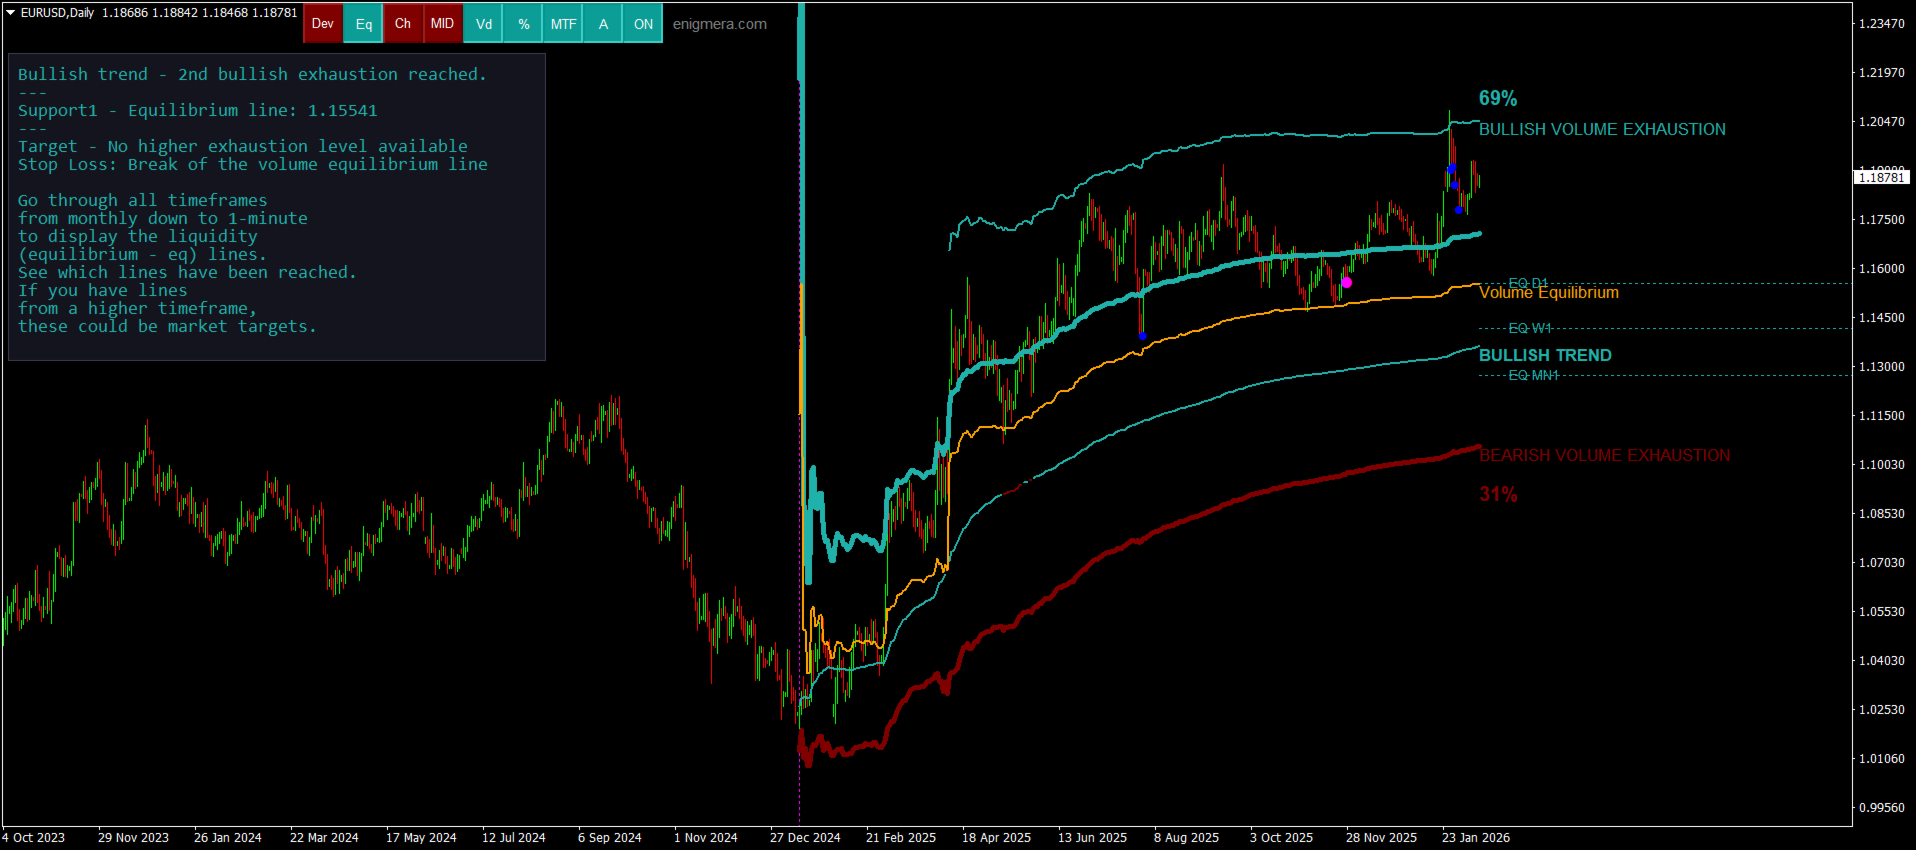
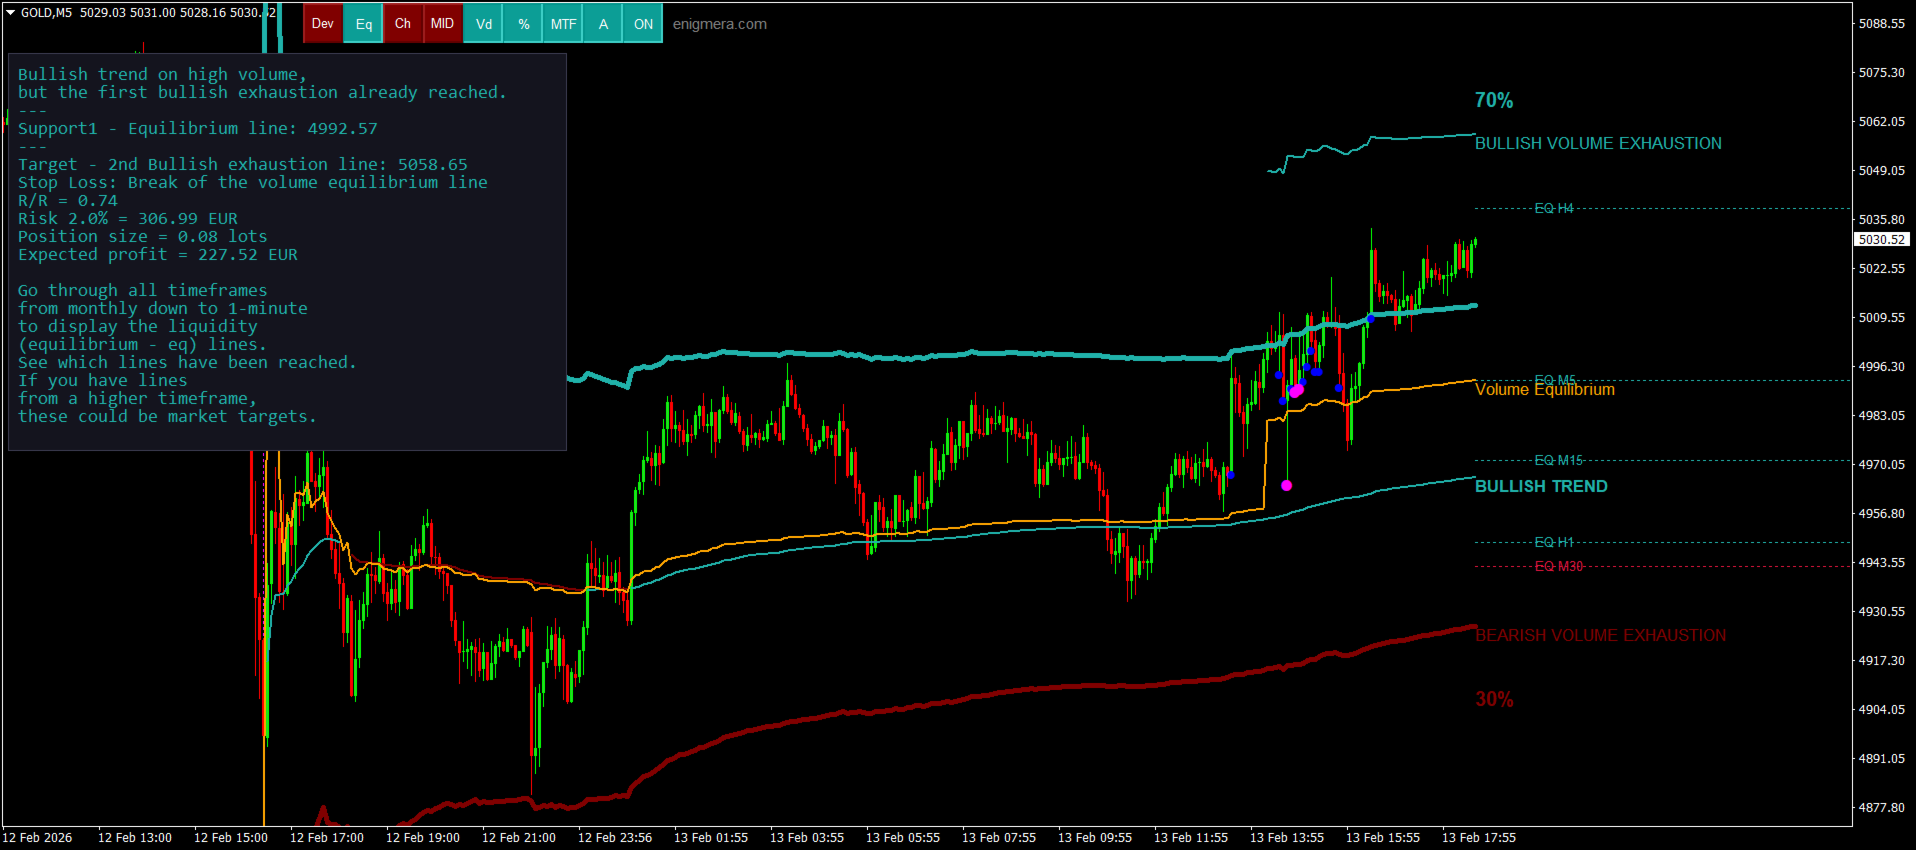
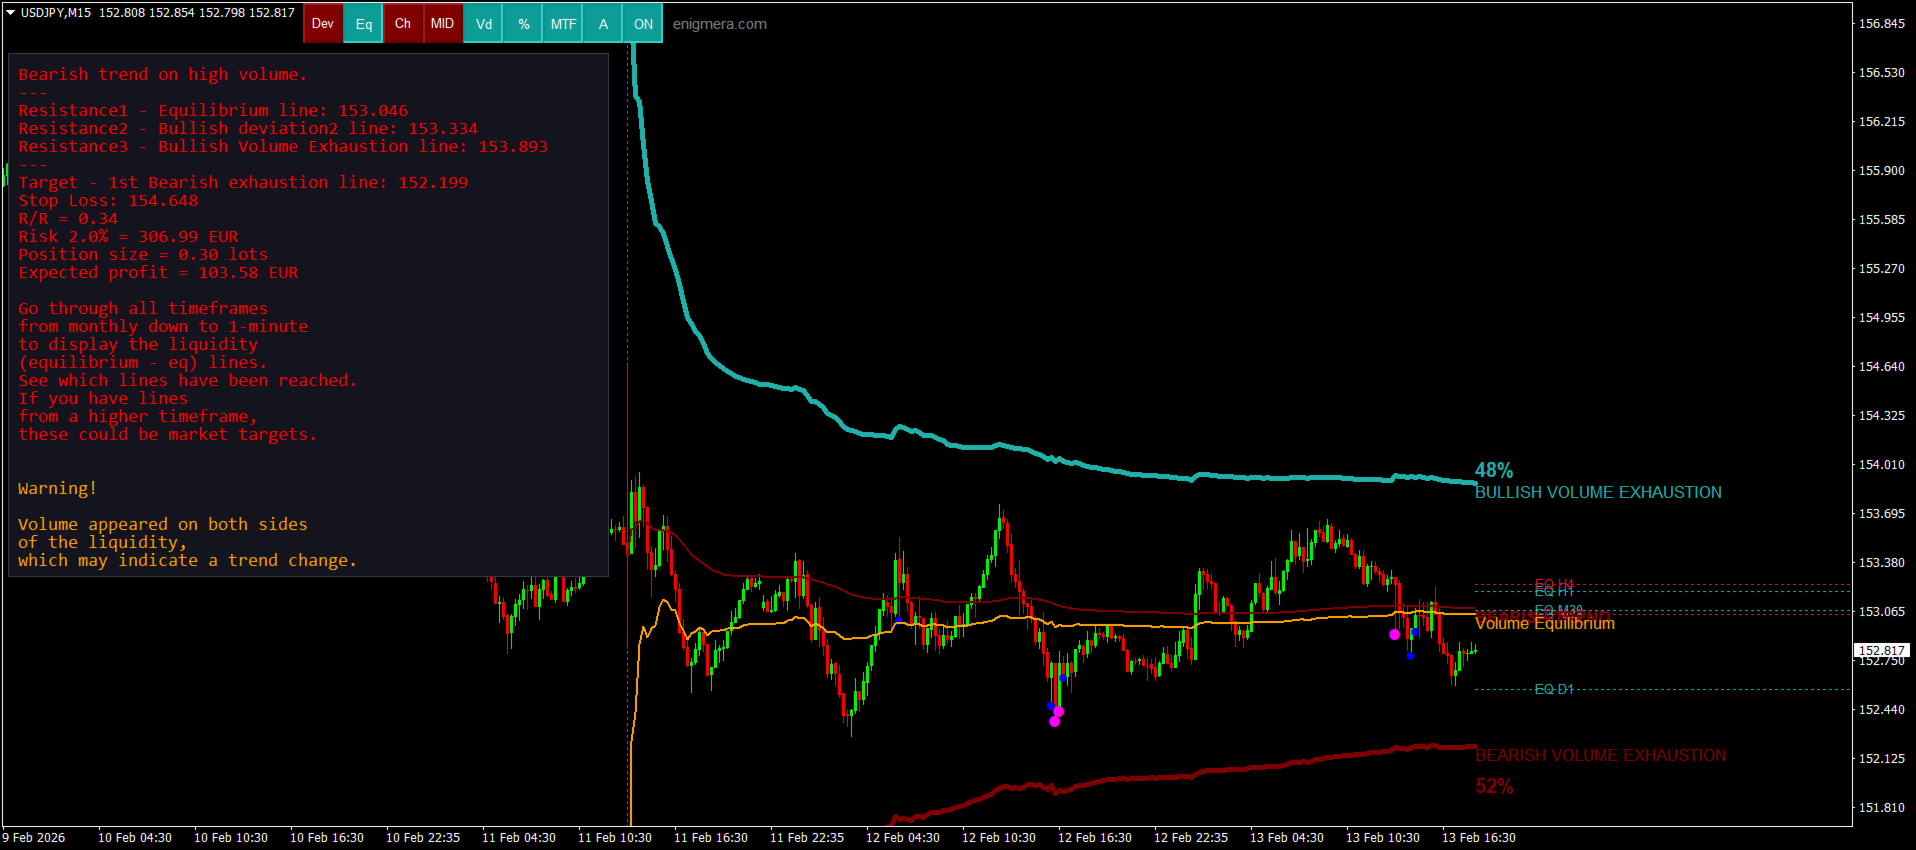
Calcular alvos, níveis de suporte e pontos de stop-loss com base na tendência atual.
Calcular a relação risco/retorno das suas operações.
Determinar o tamanho da posição de acordo com o saldo da sua conta e estimar o lucro potencial.
O Meravith também fornecerá alertas em caso de mudanças significativas no mercado.
Principais linhas do indicador:
Linhas de exaustão de volume comprador/vendedor — servem como alvos.
Linha que indica a tendência do mercado. Ela muda de cor conforme o mercado esteja em alta ou em baixa e funciona como suporte da tendência. Principalmente, sua cor mostra o sentimento do mercado.
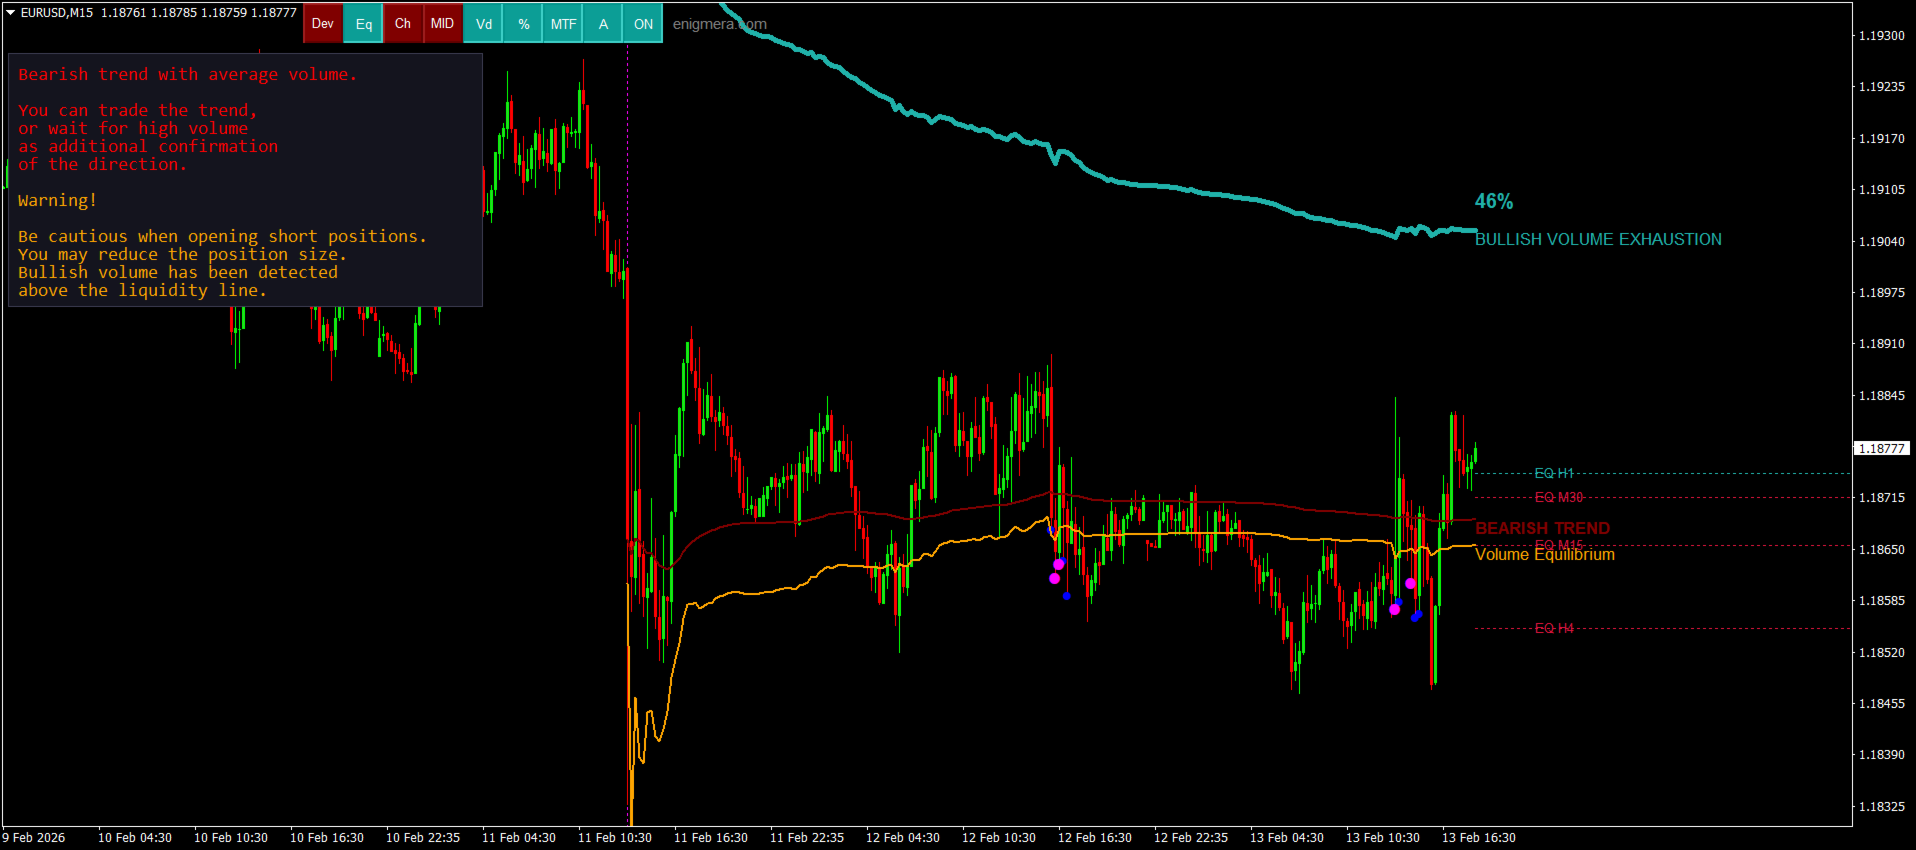
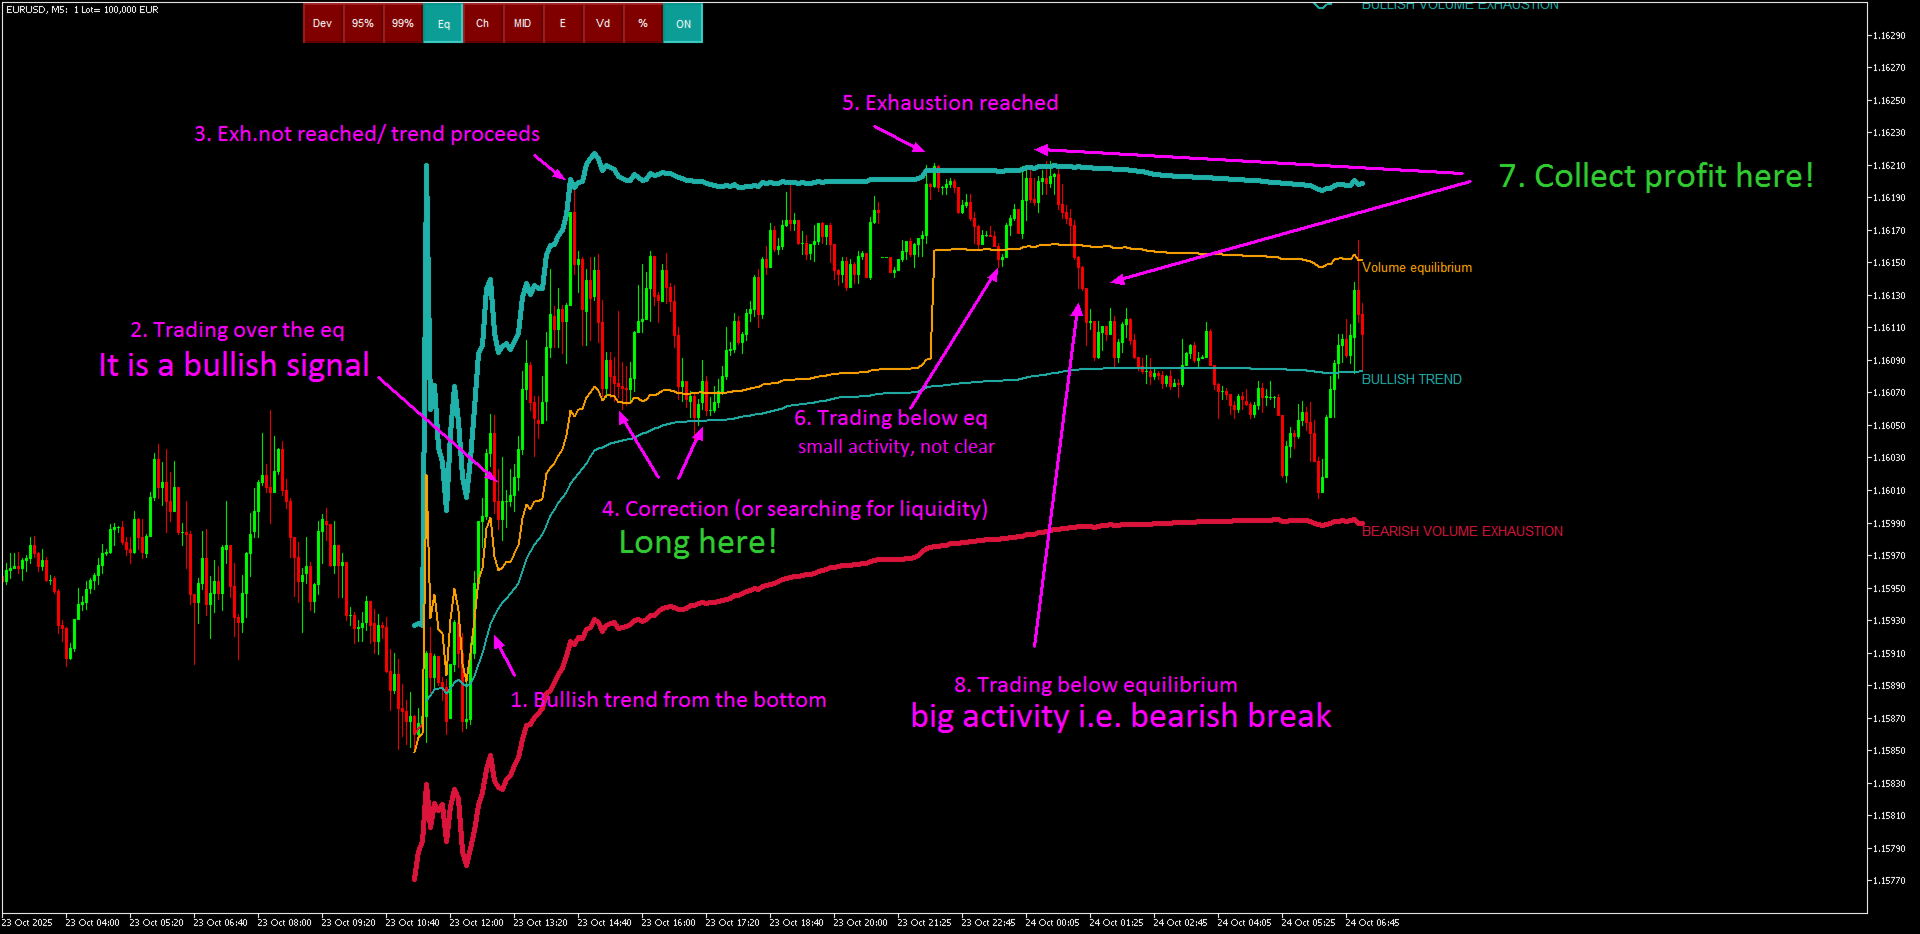
Linha de Equilíbrio de Volume (Eq). A linha Eq (Volume Equilibrium) é o núcleo do sistema. Representa o ponto de equilíbrio do volume entre compradores e vendedores. É a liquidez do mercado. Um rompimento acima da Eq sinaliza viés de alta, e um rompimento abaixo da Eq sinaliza viés de baixa. Após o rompimento, aguarde uma correção — quando o preço retornar a um dos desvios ou às linhas de exaustão da tendência oposta.
Como usar: basta inserir no seu gráfico.
O Meravith analisa tudo — tendências e correções.
Quanto maior a distância entre a linha de tendência e uma das linhas de exaustão de volume, maior o volume naquela direção.
A linha de tendência pode ser usada para abrir ordens, enquanto as linhas de exaustão podem ser usadas para realizar lucros.
O Meravith inclui botões no gráfico, tornando o trabalho muito mais fácil e rápido — todas as funções principais podem ser ativadas ou desativadas diretamente no gráfico. Veja o que cada botão faz:
DEV – Exibe um duplo desvio a partir da linha de suporte, que pode atuar como nível adicional de suporte se a tendência tiver alto volume interno.
Eq – Linha de equilíbrio de volume. É a linha de liquidez do mercado. O volume comprador é igual ao volume vendedor.
CH – Mostra o canal completo de suporte para melhor visualização da estrutura.
MID – Marca o ponto médio (50%) de todo o movimento, juntamente com os níveis 0% e 100%.
Vd – Destaca velas com desvio de volume incomumente alto em comparação com a média.
% – Compara os canais de alta e de baixa em percentual %.
MFT – Pressione este botão (Multi Time Frame) e percorra todos os timeframes. O indicador calculará automaticamente todos os níveis de liquidez e os exibirá no timeframe escolhido. Cada timeframe mostra seu próprio nível de liquidez e os níveis dos timeframes superiores. Os níveis dos timeframes inferiores não são exibidos. O botão permite mostrar ou ocultar esses níveis.
A – Analysis. Este botão mostra ou oculta a análise textual que o indicador gera sobre o mercado.
ON / OFF – Liga ou desliga completamente o indicador.
Disponível para MT4, MT5 e TradingView.
Recomendações:
Par de moedas: Todos os pares, todos os mercados
Timeframe: Todos os timeframes
Depósito mínimo: Sem depósito mínimo
Tipo de conta: Sem limitações
Corretoras: Sem limitações
Antes de comprar:
Por favor, teste no testador do MetaTrader. Se tiver alguma dúvida, envie-me uma mensagem através do meu perfil no MQL5.
Suporte completo e materiais bônus disponíveis após a compra.


A deep understanding of forex, the philosophy of forex and life, translated into an understandable, easily applicable, profitable, and underpriced Meravith indicator (in fact, a complete system). On top of that, you get a dedicated, friendly, knowledgeable, and always available author ready to help.