 MetaTrader 5
 Experts
 지표
 라이브러리
 유틸리티
 위젯
 규칙
MetaTrader 5용 유료 기술 지표 - 91
 기술 지표의 시그널은 주식 및 외환 시장에서 거래를 개시 및 종료하는 데 중요한 역할을 합니다. 지표의 본질은 미래의 가격 변화를 예측하기 위한 금융 시그널 값의 수학적 변형입니다.
기술 지표를 테스트하여 시장 행동과 그로 인한 이익을 더 잘 예측할 수 있습니다.
Range Cycle Indicator. Gives signal on price range cycling smoothed by moving average. It is better to use it on H1+ timeframes and avoid side markets. Because if market is flat this indicator will give too many zero profit or even losing signals. Parameters: PopUpAlert - to allow it to alert when trend changes; EMailAlert - for email alerts; period - this is a smoothing criteria, use higher values on lower timeframes; TimeFrame(new) - higher timeframe (or the same) to use for calculation, defa

상상:당신은 거대한 이익의 가장자리에 있지만,시장이 갑자기 변경 당신은 기회를 그리워. 또는 더 나쁜,당신은 손실 대신 이익을 얻을. 당신은 사전에 속삭이는 신뢰할 수있는 동맹이 있다면 어떻게:"준비-파도가오고있다!"? Harbinger 을 알아보세요–메타 트레이더 5 에 대한 혁신적인 지표,특별히 혼란의 피곤과 시장의 변화를 예상 할 상인을 위해 설계!
Harbinger 은 숨겨진 추세 변동성 패턴을 분석하여 다가오는 철수,반전 또는 축적을 놀라운 정확도로 알리는 스마트 알고리즘입니다. Harbinger mt4 version
표시기 작업 방법 Harbinger.
Harbinger 의 신호가 차트에 나타나면 신호 이전의 가격 움직임이 함께 풀백 또는 추세 반전과 함께 축적 또는 롤백 또는 축적을 위해 중지된다는 것을 의미합니다. 종종 두 가지 모두 한 번에 발생합니다. 중요한 것은 신호가 나타나면 이전 추세의 변화가 오는 것을 의미한다는 것을 이해하는 것입니다. 이 모든 것이

Acceleration Bias — Price Acceleration Impulse Indicator Acceleration Bias is a modern analytical tool designed to measure changes in price acceleration and visualize impulse asymmetry using a robust mathematical model.
This indicator is intended for traders working with market volatility, impulse phases, and price-movement structure, as well as those who need algorithmic, rule-based analytical support. Purpose and Core Concept Unlike traditional oscillators that analyze only velocity changes (f

WHAT IS HTF CANDLES PRO? HTF Candles Pro is an advanced Multi-Timeframe indicator that constructs custom higher-timeframe candles directly from H1 bars, combining this visualization with a complete system of internal Fibonacci levels and projections. Unlike other HTF indicators that only display standard MetaTrader timeframes, this indicator allows you to create completely customized timeframes (24H, 48H, 72H, 96H, etc.) by aggregating 1-hour bars. KEY FEATURES 1. CUSTOM CANDLE CONSTRUCTION Cust

Elliott Wave Drawing Tool for MT5 – The Ultimate Professional Wave Mapping System Take your market analysis to the next level with the Elliott Wave Drawing Tool for MT5 , an advanced charting solution designed for traders who demand precision, speed, and complete control in wave labeling. Engineered for both beginners and expert Elliotticians, this tool transforms manual wave marking into a smooth, intuitive, and highly accurate experience. Built with a smart drawing engine , this indicator lets

you tired of exporting your trading history to Excel just to figure out your stats? Do you struggle to know if your EA is actually profitable, or if your manual trades are hurting your performance? Stop guessing and start analyzing. The Trade Performance Dashboard is a powerful, all-in-one utility that replaces guesswork with facts. It loads directly onto your chart and instantly analyzes your entire trading history, presenting all vital statistics in one clean, professional panel.
Finally, Kn

N/B: All our product purchase comes with our free ‘’DAILY SCALPER EA’’ - bit.ly/4qlFLNh Whatsapp Developer for yours after successful purchase
DAY TRADER PLUS: The Institutional Order Flow System
Finally See Where Banks Place Their Orders - And Profit With Them
ARE YOU SICK OF THIS?
"I entered the trade at what seemed like the perfect time... only to watch price reverse immediately and hit my stop loss."
"I took profits too early, then watched the market run another 100 pips w
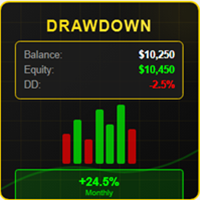
# DRAWDOWN INDICATOR V4.0 - The Essential Tool to Master Your Trading
## Transform Your Trading with a Complete Real-Time Performance Overview
In the demanding world of Forex and CFD trading, **knowing your real-time performance** isn't a luxury—it's an **absolute necessity**. The **Drawdown Indicator V4.0** is much more than a simple indicator: it's your **professional dashboard** that gives you a clear, precise, and instant view of your trading account status.
---
## Why This Indicator
Harmonic based indicator. Recognizes several patterns: ABCD, 3 Drives, Gartley, Butterfly, Bat, Atlternative Bat, Deep Bat, Crab, Deep Crab, Cypher and Shark. Able to set SL and three levels of TP based on Fibonacci Levels. Three types of alerts are available: PopUp, Email and Push. Trade advices on chart and stats also printed for visual estimation. All patterns are formed by not repainting ZigZiag. Parameters for it are classic: InpDepth, InpDeviation,InpBackstep. MinComplete means the level
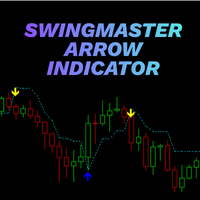
Swing Master Arrow Indicator Clear Swing Signals • Trend-Aligned Entries Swing Master Arrow Indicator is a swing-based trading tool designed to identify potential market turning points and highlight structured Buy and Sell opportunities. It uses a volatility-aware trend logic to detect meaningful swing reversals while filtering out minor market noise. The indicator provides clear arrow signals directly on the chart, helping traders follow price movement with greater clarity and consistency. Cor
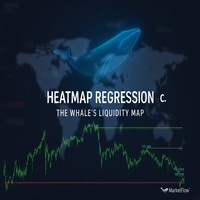
HeatMap Regression Confluence: 귀하의 기관 유동성 레이더 가격이 반드시 방문해야 하는 레벨을 식별하고 싶으신가요? Heatmap Regression 은 차트에서 기관 활동의 흔적 을 감지하는 고급 히트맵입니다. 이는 강력한 자본 흡수 또는 분배가 발생한 핵심 영역 을 식별하여, 시장이 수정하는 경향이 있는 미결된 불균형을 남깁니다. 이 지표는 귀하에게 가격이 되돌아갈 가능성이 가장 높은 목표 를 드러냅니다. 핵심 영역 분석 (가격 불균형) 이 지표는 두 가지 유형의 기관 유동성 흔적을 표시합니다. 녹색 영역 (축적/Acumulación): 가격이 강하게 하락할 때 (매도 우세) 형성되며, 기관 매수 주문(유동성)을 뒤에 남깁니다. 가격은 이 레벨을 균형 맞추기 위해 상승으로 되돌아갈 확률이 높습니다. 빨간색 영역 (분배/Distribución): 가격이 강하게 상승할 때 (매수 우세) 형성되며, 기관 매도 주문(유동성)을 뒤에

Smash FX System — Inside-Bar Breakouts, Reversals & Continuations (Indicator) Tagline: Smash the noise, catch the clear moves — high-clarity inside-bar breakout, reversal and continuation arrows designed for clean entries and professional journaling. Short promo Smash FX System pinpoints high-probability inside-bar breakouts, smart reversals and continuation setups with on-chart arrows and exact levels — built for traders who want clear, repeatable setups and perfect order-management handoffs f
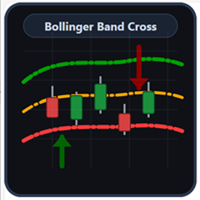
Bollinger Band Cross — 화살표 & 밴드 “재 진입 /터치 ” 신호를 화살표로 선명하게 표시하는 볼 린저 밴드 지 표. 기능 상 녹색 /중 주황/하 빨강, Dash DotDot 스타일. 하 단 재 진입 시 진 녹색 상승 화 살표 . 상단 재진입 시 진빨 강 하 락 화살 표 . 두 가지 계산 모드. 신 호 모드 Re entry (cross_reentry): 이전 봉 종가가 밴드 밖, 현재 봉 종가가 채널 안. Touch (cross_touch ): 심지는 밴드 밖 , 종가는 채널 안 . 입력 값 기간 (기본 5 0), 시프트 , 표준편차 (2.0) 가격 타입: PRICE_CLOSE / OPEN / HIGH / LOW / MEDIAN / TYP ICAL / WEIGHT ED 모드 : Reentry 또는 Touch 화살표 픽셀 시프트(세 로), 포인트 오프 셋(고 /저 기준 ) 시 각 요소

Range Perfect 지표 소개 Range Perfect(RP)는 MX Robots에서 개발한 독자적인 MetaTrader 5 지표로, 횡보장이나 추세 피로 구간에서 거래하는 트레이더를 위해 설계되었습니다. 이 지표는 시장의 피로 구간을 감지하고 XAUUSD, EURUSD, 주요 외환 통화쌍, 비트코인과 같은 암호화폐, 그리고 기타 변동성이 큰 자산에서 고확률 반전 지점을 표시합니다. 여러 확인 단계를 필요로 하는 일반적인 지표들과 달리, Range Perfect는 단독으로도 강력한 거래 전략으로 기능합니다. 제공된 예시와 영상에서 볼 수 있듯이 RP는 다른 도구와 결합하지 않아도 고품질의 매수·매도 신호를 제공합니다. 다른 기술 도구와 결합하면 정확도는 85% 이상으로 향상될 수 있습니다. RP는 인공지능 알고리즘 기반으로 개발되었으며 시장 구조, 추세 피로, 그리고 보이지 않는 지지·저항 영역을 높은 정확도로 탐지합니다. Range Perfect의 독창성 Range Perfe
N/B: All our product purchase comes with our free ‘’DAILY SCALPER EA’’ - bit.ly/4qlFLNh Whatsapp Developer for yours after successful purchase
HolyGrail Premium System: The Ultimate Supply & Demand Trading Solution
Finally Discover the "Unfair Advantage" That Professional Traders Have Been Using For Years
"I went from inconsistent guessing to precision trading with 83% accuracy once I started combining multi-timeframe confirmation with institutional order flow zones"
Note: After pur
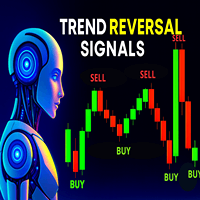
TREND REVERSAL SIGNALS – 트렌드 반전의 정확한 신호 TREND REVERSAL SIGNALS 는 시장의 추세 전환 지점 을 최대한 정확하게 포착하기 위해 설계된 고급 인디케이터입니다. 가격 데이터(OHLC)를 분석하고 주요 캔들 패턴을 인식하여 잠재적인 반전 시점을 찾아냅니다. 프라이스 액션, 변동성(ATR), 시장 구조를 결합하여 차트에 명확한 매수(BUY) / 매도(SELL) 신호 를 제공합니다. 분석 기반: 프라이스 액션 (OHLC) – 더블탑/더블바텀, 헤드앤숄더 등 반전 패턴 탐지 변동성 (ATR) – 움직임의 강도를 측정하고 잘못된 신호를 걸러냄 시장 구조 – 고점/저점의 흐름을 추적하여 방향 확인 기술적 지표 – 이동평균선, RSI, MACD, 볼린저 밴드 활용 거래량 분석 – 거래량 급증에 반응하고 VWAP을 기준선으로 활용 트레이더에게 제공하는 것: 특정 캔들에서 정확한 매수/매도 신호 제공 모든 종목과 타임프레임에서 작동 데이 트레
N/B: All our product purchase comes with our free ‘’DAILY SCALPER EA’’ - bit.ly/4qlFLNh Whatsapp Developer for yours after successful purchase
DayTrader Premium System Indicator: Complete Trading Mastery
The DayTrader Premium System Indicator represents the culmination of institutional trading methodology made accessible to retail traders. By combining order block analysis, supply/demand zone identification, and multi-factor confirmation, it provides a comprehensive framework for consis
RSI Nexus Multi-timeframe (RSI-Nexus-MTF) RSI-Nexus-MTF is a multi-timeframe RSI engine designed to help algorithmic traders identify structure, context and trigger signals simultaneously. Inspired by Fractal Market Rhythm analysis, the indicator extracts the RSI trend from three layers of market flow: Long-Term Structure (HTF) Mid-Term Context (MTF) Short-Term Trigger (current timeframe) This makes the indicator especially powerful for robot developers , allowing EAs to read market conditions

AutoLevels – 지능형 지지선 및 저항선 탐지 AutoLevels 는 강력한 인디케이터로, 실시간 차트 데이터를 기반으로 핵심 가격 구간 을 자동으로 식별합니다. 스윙 고점과 저점, 시장 변동성(ATR), 그리고 반복되는 가격 반응을 분석하여 신뢰할 수 있는 지지선과 저항선을 찾아냅니다. 핵심 구성 요소: 스윙 포인트 (Swing High / Low), 민감도 조정 가능 ATR 기반 동적 존 폭 설정으로 변동성에 자동 적응 선택적 이동평균선으로 추세 확인 선택적 거래량 분석으로 주요 레벨 검증 ️ 작동 방식: 가격 반응 지점을 그룹화하여 명확한 지지/저항 존 생성 최소 터치 수 기준으로 약한 레벨 필터링 차트에 직접 시각화 – 터치 횟수가 많을수록 존이 강력해짐 모든 타임프레임과 모든 상품에서 뛰어난 성능 – 외환, 주식, 지수, 암호화폐 등. 트레이더가 수동으로 선을 그릴 필요 없이, 중요한 레벨을 빠르고 정확하게 확인할 수 있습니다. “AutoLeve

AutoLevelsPro —— 가격 데이터를 분석하여 자동으로 지지선과 저항선 구역 을 표시하는 인디케이터입니다.
특히 단기 타임프레임 에 최적화되어 있으며, 가장 효과적인 활용은 15분 차트 에서 가능합니다. 사용 데이터: High —— 각 캔들의 최고가 Low —— 각 캔들의 최저가 Close —— ATR 계산에 사용 각 캔들의 타임스탬프를 통해 구역을 정확히 배치 ️ 분석 과정: 스윙 하이/스윙 로우 탐지 ATR 계산으로 시장 변동성을 측정하고 구역의 폭 결정 가까운 레벨을 하나의 구역으로 그룹화 최소 터치 횟수 조건을 충족하지 못한 약한 레벨은 제외 데이터 출처: 적용된 차트의 가격 데이터 (선택한 타임프레임 반영) MetaTrader 내장 ATR 인디케이터 (타임프레임에 따라 동적으로 조정) 결과 해석: 초록색 구역 = Support (지지선) 빨간색 구역 = Resistance (저항선)

Smart Risk Manager Pro – 드래그하고 자신 있게 트레이드하세요 Smart Risk Manager Pro는 달러 기준 리스크에 따라 포지션 크기를 계산해 주는 프로페셔널 온차트 리스크 관리 도구입니다. 차트에서 클릭 후 드래그 만 하면, 인디케이터가 즉시 다음 정보를 보여줍니다: 방향 (Buy / Sell) 거리 (포인트) 추천 로트 크기 (RiskUSD 값 기준) 이 도구는 매우 가볍고, 극도로 빠르며, 깔끔한 차트 와 정확한 리스크 중심 트레이딩 워크플로우 를 원하는 트레이더를 위해 설계되었습니다. 기능 ️ 차트 위에서 드래그하여 직접 리스크 측정 ️ 스마트 자동 로트 크기 계산 ️ Buy/Sell 방향 표시 ️ 포인트 단위 거리 표시 ️ 모든 심볼에서 사용 가능 (포렉스, 골드, 지수, 크립토) ️ 초고속 – 랙 거의 없음 ️ 깔끔하고 미니멀한 UI ️ 서브 윈도우 없음, 무거운 패널 없음 ️ 마우스를 놓는 순간에만 계산 → CPU 절약

Red and Green Light – Intelligent Trading Signal Indicator Product Overview Red and Green Light is a professional trading signal indicator based on the multi-stage T3 smoothing algorithm. It integrates a visual traffic light system, intelligent signal recognition, risk alerts, and multiple notification features. Whether you're a manual trader or an Expert Advisor (EA) developer, this indicator helps you capture market opportunities with greater precision and effectively avoid the risks of

Comprehensive Trading Analysis Tool This tool has four main parts that help traders understand the market and manage risk in a simple way 1 Risk and Reward Visual Tool It shows two boxes on the chart a pink box for risk and a navy blue box for reward It shows the risk to reward ratio You can move and resize the boxes It shows pips and possible money for risk and reward It gives a clear picture of possible profit and loss It helps plan trades before entering It keeps risk levels consistent It hel

King Smart Liquidity MT5는 외환, 금, 지수, 비트코인 및 기타 시장에서 기관 자금 흐름과 주요 은행들을 추적하도록 특별히 설계된 고급 분석 지표입니다. 이 지표는 "스마트 머니 컨셉" 방법론을 기반으로 개발되었으며, 이는 가격 행동, 유동성 영역, 그리고 주요 금융 기관들이 시장에서 어떻게 행동하는지에 대한 이해에 의존합니다. 이 지표는 단순히 선이나 영역을 그리는 것이 아니라, 기존의 지연되는 지표들과는 차원이 다른 실제 시장 구조에 대한 포괄적인 분석을 제공합니다.
**주요 기능:**
1. **고급 시장 구조 분석** * 중요한 고점과 저점(HH, HL, LL, LH)의 탐지 및 강도 표시가 포함된 라벨링 * 구조 돌파(BOS) 및 성격 변화(CHoCH) 지점의 정확한 식별 * 더블 탑/바텀 탐지 및 즉각적인 시각적 알림 * 가격 행동에 기반한 실제 시장 방향에 대한 명확한 뷰
2. **스마트 오더 블록
What It Does for xauusd only Finds Order Blocks (ANN + SMC) on big and small timeframes. Marks them with clean bullish/bearish zones. Drops arrows (blue = BUY, red = SELL) right inside each block. Shows an info panel on the right with the exact high/low of the newest blocks. Lets you change chart colors (background, bull candle, bear candle) instantly. How To Use It Drop the indicator into MQL5/Indicators → restart MT5. Add it to your chart. In the settings: Pick your background , bull candle ,

Moving Polynomial Regression The Moving Polynomial Regression indicator provides traders with a statistically robust and adaptive method for identifying the true trend, predicting immediate momentum shifts, and filtering market noise. Unlike traditional moving averages that simply lag the price, this tool fits an optimal polynomial curve to the market, giving you a dynamic and predictive view of price action. Key Advantages Superior Noise Filtering: Uses advanced mathematical techniques
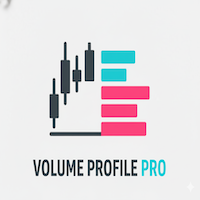
Volume Profile Pro 보조지표 이 지표는 "어떤 가격대에서 가장 많은 거래가 일어났는지" 분석하는 Volume Profile Pro 도구입니다. 다음과 같은 특별한 기능이 있습니다: 표시 모드 (Display Modes) Volume Profile (일반): 각 가격대의 총 거래량(Total Volume)을 표시하여 중요한 지지 및 저항 구간을 보여줍니다. Delta / Money Flow: 매수세와 매도세(Buy vs Sell)의 "차이(Delta)"를 표시하여 해당 가격대에서 누가 시장을 주도하는지 보여줍니다. 거래량(Volume) 또는 자금 흐름(Money Flow)으로 선택하여 볼 수 있습니다. 계산 모드 (Calculation Modes) Pro 버전의 강점은 기간 설정의 유연성입니다: Fixed Mode (고정 모드): 과거 캔들 개수를 고정하여 설정합니다 (예: 최근 100개 캔들). Dynamic Mode (핵심 기능): 수직선(Vertical Line)이

TradingView 확장 도구 TradingView 스타일의 드로잉 및 분석 도구를 MetaTrader 차트에 직접 적용 플랫폼 제한 없이 무제한 차트 사용 사용자 정의 조건에 따라 무제한 알림 생성 및 관리 MetaTrader 내에서 TradingView 스타일의 인기 지표 사용 구매 후 TradingView 스타일 지표와 설치 가이드가 포함된 추가 폴더 제공 소개
Trading View Extension은 TradingView의 고급 드로잉 도구와 분석 기능을 MetaTrader 환경으로 가져오기 위해 설계된 전문 지표입니다. 이 솔루션은 TradingView에서 분석하고 MetaTrader에서 별도로 거래를 실행해야 하는 번거로움을 제거합니다. 모든 도구는 TradingView 경험을 최대한 그대로 재현하도록 설계되었습니다. 또한 이 지표는 TradingView 구독 제한 없이 무제한 사용을 제공하여 트레이더에게 완전한 유연성을 제공합니다. 사용 가능한 도구
추세선 도구

마켓 스코어링 시스템 – 고급 멀티타임프레임 트레이딩 지표 전문 기술 지표, 머신러닝 패턴 분석, 멀티타임프레임 확인을 결합한 고급 시장 분석 시스템으로, 매우 정확한 매매 신호를 제공합니다. 주요 기능 멀티타임프레임 분석:
M5, H1 등 여러 시간대에서 신호를 확인하여 성공 확률 증가 스마트 스코어링 엔진:
최근 25개 캔들을 가중 분석하여 트렌드, 레인지, 불확실성 점수 계산 시장 의도 분석:
최근 6개 캔들과 거래량을 바탕으로 실시간 매수/매도 압력 분석 글로벌 스코어 (0–100):
종합 신호 강도 지표, 색상 기반 프로그레스 바 제공 ATR 기반 리스크 관리:
동적 스탑로스, 테이크프로핏, 트레일링 스탑 계산 ADX 추세 강도 필터:
DI+/DI- 로 강한 추세와 횡보 시장 구분 거래량 컨텍스트 분석:
폭발적 변동성과 조용한 축적 단계를 구분 머신러닝 시스템:
패턴 인식 및 결과 추적을 통한 적응형 신호 생성 엄격 모드:
ADX, 불확실성, 트렌드 강도 기

LiquidZones Pro automatically detects and visualizes supply and demand zones on your chart. By analyzing swing highs and lows over a configurable lookback period, the indicator highlights critical areas where price has historically reacted. Key Features: Automatic detection of supply (resistance) and demand (support) zones. Configurable lookback period , swing strength , and zone width . Zones merge automatically if price levels are close, keeping charts clean. Minimum touch filter to avoid wea

Dashboard for account exposure. MT5:
- List of pairs
- Account Profit/Loss - Lots open for each pair - Total PnL for each pair - Balance, equity, margin
Simple to use indicator. Just drag and drop. Minimal input required. Must enable Algo trading and DLL import. This indicator provide real time info of account status and health. Easy to make decision across pairs.
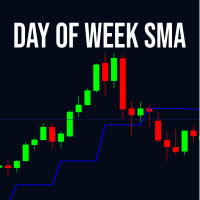
요일 SMA 지표는 사용자가 선택한 특정 요일의 종가에 기반하여 이동 평균을 계산합니다. SMA(단순 이동 평균), EMA(지수 이동 평균), SMMA(평활 이동 평균), LWMA(선형 가중 이동 평균)를 포함한 다양한 이동 평균 유형을 지원합니다. 기간은 계산에 포함할 선택된 요일의 인스턴스 수를 정의합니다. 예를 들어, 금요일을 선택하고 기간을 3으로 설정하면 최근 3개의 금요일 종가를 사용하여 평균을 산출합니다. 이 도구는 금융 시장의 주간 패턴을 분석하는 데 유용하며, 트레이더가 특정 요일에 특화된 트렌드를 식별하는 데 도움을 줍니다. 금요일과 같은 특정 요일에 초점을 맞춤으로써, 사용자는 주말 요인이나 경제 발표의 영향을 받는 반복적인 행동에 대한 통찰을 얻을 수 있으며, 시장 변동성이나 계절적 요인을 더 잘 파악할 수 있습니다. 지표는 차트 창에 선으로 표시되어 다른 기술 지표와 쉽게 결합하여 사용할 수 있습니다.
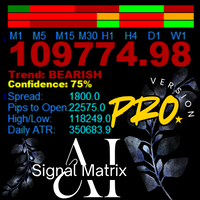
AanIsnaini Signal Matrix MT5 PRO - Bayesian Multi-Timeframe Dashboard "Advanced multi-timeframe dashboard with Bayesian Learning, real-time Signal Strength, and persistent memory. The older it runs, the smarter it becomes."
The free version (v1.3) gave you visibility. The PRO Version gives you the edge . AanIsnaini Signal Matrix MT5 PRO is a sophisticated multi-timeframe analysis system that combines classical technical indicators with adaptive probabilistic reasoning. Designed for serious tra
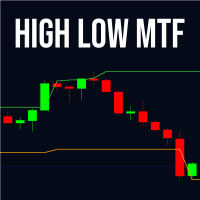
High Low MTF – 멀티 타임프레임 고점 및 저점 레벨 High Low MTF는 모든 시간대의 고점과 저점을 기반으로 강력한 지지 및 저항 영역을 표시하는 전문 지표입니다. 더 높은 시간대 또는 더 낮은 시간대의 가격 수준을 현재 차트에 직접 표시하여 정확한 멀티 타임프레임 분석을 제공합니다. 스캘핑, 데이 트레이딩, 스윙 트레이딩은 물론 iCustom을 사용하는 알고리즘 시스템에서도 사용할 수 있습니다. 이 지표는 선택한 시간대의 고점과 저점을 자동으로 감지하고 업데이트하며, 가격 반응이 자주 나타나는 신뢰성 높은 영역을 생성합니다. 이러한 영역은 기관 투자자 및 대형 거래자의 관심을 받습니다. High Low MTF는 높은 성능에 최적화되어 있으며 빠른 시장 환경과 많은 캔들 표시에서도 우수한 응답성을 제공합니다. Forex, 주식, 금, 지수, 암호화폐 및 선물 시장에서 사용할 수 있습니다. 특징 및 장점 모든 시간대의 고점 및 저점 표시 상위 및 하위 타임프레임 모두

BUY and SELL smart The BUY and SELL Smart Indicator is a next-generation trading tool engineered for precision scalpers, intraday strategists, and professional analysts who demand both speed and clarity in market visualization. It seamlessly integrates smart candle-based analytics, adaptive ATR logic, and real-time economic event awareness — giving you a fully synchronized view of market volatility and momentum. Through an elegant and optimized interface, FlashScalp delivers instant signal fee

Fine Timeframes는 MT5용 1분 단위의 타임프레임 지표입니다. 1초에서 30초까지의 간격으로 차트를 생성하여 분 및 시간 차트에서는 보이지 않는 시장 움직임을 파악하는 동시에, 표준 타임프레임처럼 포지션을 개시하고 청산할 수 있는 모든 거래 기능을 제공합니다. Fine Timeframes는 실시간 틱에서만 작동하며 전략 테스터용으로 설계되지 않았습니다. 데모 버전을 다운로드하여 EURUSD와 AUDUSD의 실제 시장 조건에서 지표를 테스트해 보세요. 주요 특징 • 1초에서 30초까지 설정이 가능하며, 한 번의 클릭으로 시간대를 전환할 수 있습니다. • 차트에서 직접 전체 거래: Fine Timeframes는 내장된 터미널 기능을 차단하지 않습니다. 일반 타임프레임에서와 마찬가지로 초 기반 차트에서 바로 표준 MT5 컨트롤을 사용하여 거래를 시작하고, 보류 주문을 넣고, 포지션을 관리할 수 있습니다. • 유연한 디스플레이 설정: 3가지 차트 유형(캔들스틱, 막대, 선형),
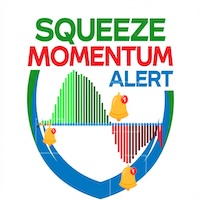
Squeeze Momentum Alert (스퀴즈 모멘텀 알림) 1. 가격 "폭발" 지점 식별 (The "Squeeze") 이 지표의 가장 큰 장점은 큰 움직임이 발생하기 전, 시장이 "숨 고르기" 또는 "에너지 축적"(횡보)하는 시기를 포착하는 능력입니다. 좋은 이유: 시장은 정체기와 폭발적인 변동성 시기를 반복합니다. 이 도구는 **"차트가 압축되고 있으니 다음 급등을 준비하라"**고 알려주어, 대형 추세의 시작을 놓치지 않게 합니다. 2. 추세 "강도"의 정밀한 구분 (Color Coded Momentum) 히스토그램은 4가지 색상 을 사용하여 추세의 건전성을 나타냅니다: 라임색 (Lime): 강력한 상승 (추격 매수 가능). 진녹색 (Dark Green): 상승세 약화 (주의: 이익 실현 준비). 빨간색 (Red): 강력한 하락 (강한 매도). 밤색 (Maroon): 하락세 약화 (매도세 소진). 좋은 이유: 추세가 강할 때 "진입" 타이밍과, 색이 바뀌자마자(모멘텀 상실)

Engulfing Signal Pro is a powerful and lightweight MQL5 indicator designed to deliver high-probability market entries based on candlestick Engulfing patterns combined with advanced internal calculations. This indicator is built for traders who demand accuracy, clarity, and speed—without repainting. Key Features Smart Engulfing Detection
Automatically detects bullish and bearish Engulfing patterns using strict candle-body rules, ensuring that only meaningful price reversals trigger signals. Mult

RSI Divergence PRO (Non-Repaint) – MT5 Indicator Overview
RSI Divergence PRO automatically detects Bullish and Bearish Divergence between price and RSI and plots clear arrows on the chart. The indicator is 100% non-repainting because signals are generated only after pivot points are fully confirmed.
This is one of the most reliable reversal detection tools used by both beginners and professional traders. ------------------------------------------------------------------ -------------------
This is MT5 version only. For MT4 visit: https://www.mql5.com/en/market/product/156000/
Detailed blog post with screenshots: https://www.mql5.com/en/blogs/post/765529
Features Overview Bull and Bear Power Visualization: Histograms or Lines or Bands Combined Bull/Bear Power (BBP) Mode: To see the net power balance Customize Colors: for instant pattern recognition Smoothing (Optional): reduces noise for cleaner signals Additional Filter Options: Price Divergence visualization to spot potential
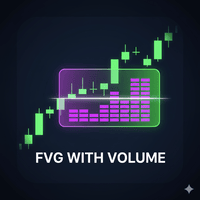
FVG Volume Profile (Institutional Price Action) Unlock the hidden liquidity inside Market Imbalances. The FVG Volume Profile is an advanced Price Action indicator that goes beyond standard Fair Value Gap detection. It looks inside the gap using lower timeframe data to construct a Volume Profile specifically for that imbalance. This helps you identify exactly where the "Smart Money" is defending positions. Key Features: Internal Volume Profile: Automatically scans lower timeframes
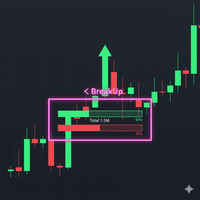
Breakout Boxes with Volume Pressure This indicator automates the identification of key consolidation zones (Supply and Demand) based on Market Pivots and Volatility (ATR). Unlike standard support/resistance tools, this indicator provides a unique Volume Pressure Analysis inside every box, giving you insight into the battle between Buyers and Sellers before a breakout occurs. Key Features Automated Supply & Demand Zones: Automatically detects significant Pivot Highs and Lows to draw dyna
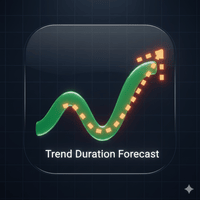
Trend Duration Forecast It utilizes a Hull Moving Average (HMA) to detect trend direction and statistically forecasts the probable duration of the current move based on historical market behavior. Key Features Smooth Trend Detection: Uses the Hull Moving Average (HMA) to filter noise while minimizing lag, providing clean Bullish/Bearish signals. Real-Time Duration Counter: Displays a dynamic label at the start of the current trend showing the "Real Length" (number of bars the trend has b

Spot high-impact reversal zones with precision. This indicator highlights candles where the wick exceeds a customizable percentage of total candle length — a key signal of price rejection and potential turning points. Features include: • Wick ratio filter (e.g. wick > 50% of candle length) • Minimum candle length threshold (in pips) • Real-time chart arrows for upper/lower wick dominance • Optional alerts for fresh wick signals Perfect for traders who rely on candlestick psychology to a

Trade in the Footsteps of the Institutions The SMC Institutional Order Flow indicator brings the power of professional trading strategies directly to your MetaTrader 5 terminal. Based on the core principles of Smart Money Concepts (SMC) , this advanced tool automatically maps the key levels and structures used by banks and large institutions to move the market. Stop guessing and start seeing the market through the lens of order flow. This all-in-one suite identifies where institutions have
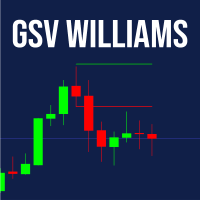
GSV – Guided Swing Value Levels GSV – Guided Swing Value Levels 는 시장이 통계적으로 높은 정확도로 반응하기 쉬운 가격 영역을 찾고자 하는 트레이더를 위해 개발된 고유 지표입니다.
이 계산 방식은 Larry Williams 의 저서 “Long-Term Secrets to Short-Term Trading” 에서 제시된 개념에 기반하며, 시장 스윙의 통계 평균이 가격이 멈추거나 조정되거나 반전될 가능성이 높은 영역을 예측하는 데 중요하다고 설명합니다. 이 지표는 Williams 의 핵심 논리 — 과거 움직임을 측정하고 미래에 투영한다 — 를 사용하지만, MetaTrader 5 용으로 완벽히 최적화되어 일봉 차트의 통계를 기반으로 모든 타임프레임에서 Buy GSV 및 Sell GSV 영역을 자동 표시합니다. GSV 작동 방식 일봉 캔들을 분석 상승 및 하락 움직임을 구분하여 실가격 스윙 평균 계산 해당 값을 통계 계수(조절 가능)로 곱함
Multi Pivot Pro — 5 Pivot Methods in One Indicator (MT5) Multi Pivot Pro draws daily pivot levels on your MetaTrader 5 chart using five different calculation methods. Switch between methods from a single dropdown — no need to install five separate indicators. Pivot points are widely used support and resistance levels that help traders plan entries, exits and stop placement. Pivot methods Classic Fibonacci Camarilla Woodie DeMark (DM) Features Pivot (P), resistance R1–R3 and support S1–S3 levels

Link to our products: https://www.mql5.com/en/users/alireza.saeedian/seller TradeX candlestick indicator is one of the leading indicators in the market. you can show/hide any pattern with one click or you can change the setting from setting tab.
If you don't have any information about candle stick pattern you can watch it from my YouTube channel. This indicator will be updated day by day.
Uncover Institutional Footprints with Volume-Based Supply & Demand Liquidity Zones is a sophisticated Price Action and Volume analysis tool designed for MQL5. Unlike standard Support & Resistance indicators that rely solely on price history, this indicator integrates Volume Volatility Analysis to identify high-probability reversal levels. It automatically detects key Swing Highs and Swing Lows where significant trading activity (volume) occurred. In Smart Money Concepts (SMC), these areas r
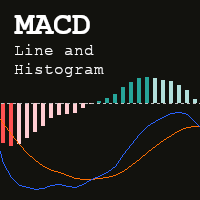
The MACD Line and Histogram is an enhanced version of the classic Moving Average Convergence Divergence (MACD) indicator. While the traditional MACD consists of two lines—the MACD (Main) line and the Signal line —the extended version introduces a Histogram that visually represents the difference between these two lines. Inputs Fast MA method (Simple, Exponential, Smothed or Linear weighted) Fast MA period Slow MA method (Simple, Exponential, Smothed or Linear weighted) Slow MA period

Multi Indicator Scanner — 10 Indicators, One Panel (MT5) Multi Indicator Scanner reads 10 popular technical indicators at the same time and shows each one as BUY, SELL or NEUTRAL in a single on-chart panel, together with an overall summary. Instead of loading and checking ten indicators one by one, you see the full picture in one place. Indicators analyzed RSI (Relative Strength Index) Stochastic %K CCI (Commodity Channel Index) ADX (Average Directional Index) MACD Moving Average Williams %R Mom

TouchGuard Alert – Advanced Price Alert & Notification Indicator for MetaTrader 5 (MT5) TouchGuard Alert is a fast, lightweight, and highly accurate price-touch Alert & Notification system designed for MetaTrader 4 (MT4) and MetaTrader 5 (MT5) . It automatically sends real-time Alerts, Pop-Up Alerts, Email Notifications, Push Notifications and early-warning notifications when price touches or approaches your chart objects. Key Features (High-Precision Alert & Notification System) Comprehensive P

Adaptive RSI is an advanced Relative Strength Index indicator. Adaptive RSI can change the look back period dynamically based on current market condition. Adaptive RSI adapts to the market changes as much as possible. Adaptive RSI is more advanced than conventional RSI.
Adaptive RSI is a tool to catch more over-bought/sold opportunities!
Features Dynamic look back period - Adaptive RSI changes the look back period dynamically basing on smartly designed adaptive methods. No worry about RSI peri
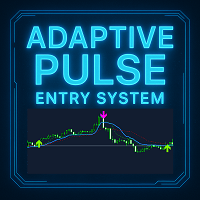
Adaptive Pulse - 전문 트레이딩 신호 시스템 간략한 설명 Adaptive Pulse는 적응형 시장 분석 기술을 기반으로 한 전문 트레이딩 신호 지표입니다. 이 지표는 자동으로 변동성에 적응하며 차트상에 시각적 화살표로 정확한 매수 및 매도 신호를 생성합니다. 모든 시간프레임과 금융상품에서 작동합니다. 주요 기능 이 지표는 각각 현재 시장 상황에 맞춰 조정되는 3개의 독립적인 적응형 라인을 갖춘 3단계 분석 시스템을 제공합니다. 시스템은 두 가지 유형의 트레이딩 신호를 생성합니다: 가격이 메인 라인과 교차할 때와 빠른 라인과 느린 라인이 서로 교차할 때입니다. 핵심 기능: 삼중 적응형 분석 시스템 두 가지 독립적인 트레이딩 신호 유형 내장된 장기 추세 필터 자동 모드를 갖춘 반복 신호의 스마트 필터링 시각적 매수 및 매도 화살표 현재 시장 상태를 표시하는 정보 패널 알림 시스템: 팝업 창, 사운드, 푸시 알림, 이메일 완전한 시각적 사용자 정의 작동 원리 이 지표는 시장

Point and Fignure (P&F) chart plots price against changes in direction by plotting a column of Xs as the price rises and a column of Os as the price falls.
Features Support for several kinds of price types - High/Low and Close. Clean and easy-to-read chart. Displays column high and low prices as indicator values. Support for both 4 and 5-digit brokers. Customizeable colors.
Advantages Filter insignificant price movements and noise. Less noise and more stable work. Focus on important price move
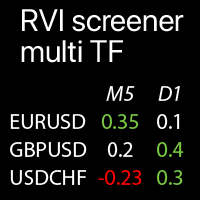
선택된 심볼에 대한 다중 시간대 RVI 값: 현재 시장 추세 비교 이 지표 는 상대 활력 지수(RVI) 값 을 모든 선택된 시간대 와 심볼 에서 단일 테이블 에 표시 하여 현재 시장 가격 추세 를 빠르게 분석 할 수 있게 합니다 . 나의 다기능 유틸리티 : 66+ 기능 | 문의하기 | MT4 버전 각 심볼 은 사용자 정의가 가능합니다: 제거하거나 교체할 수 있습니다. 최대 40개의 심볼을 추가할 수 있습니다. 패널은 차트의 어느 곳으로든 이동할 수 있습니다 (아무 곳이나 드래그).
입력 설정 에서 다음을 구성할 수 있습니다: RVI 지표 설정: MA 기간, 표시 데이터: "신호" 또는 "값". 각 시간대 를 활성화/비활성화할 수 있습니다 . 강조 옵션: 활성화된 경우 - 극단 수준이 사용자 정의 색상으로 강조 표시됩니다. 극단 수준 설정: 높은 값 및 낮
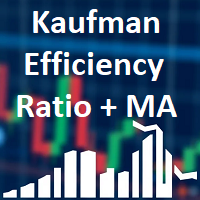
Shows Kaufman Efficiency Ratio value and smoothed by MA. Calculation is based on movement divided by volatility on a specified period. Levels are adjustable as well as visualization. Parameters: KERPeriod - period for ratio calculation. EMAPeriod - period for moving average. Shift - indicator shift. HigherLevel - low value of the higher zone. LowerLevel - high value of the lower zone. ShowHigherZone - allow higher zone drawing. HigherZoneColor - higher zone color. ShowLowerZone - allow lower zon

TradeEasy Panel - Professional Trading Control Panel Overview TradeEasy Panel is a comprehensive, professional-grade trading control panel designed for MetaTrader 5. This powerful indicator provides traders with an all-in-one solution for executing trades, managing positions, and monitoring market activity directly from the chart window. With its intuitive interface and advanced features, it streamlines the trading process for both novice and experienced traders. Key Features Real-Time Market M
Session Range Pro – Professional Session & ADR Analytics for MetaTrader 5 See what really moves the market – by session, by day, with stats that actually matter. What is Session Range Pro? Session Range Pro is a professional-grade MetaTrader 5 indicator that highlights the true behavior of price during the three main trading sessions: Asia London New York It draws clean, color-coded session ranges directly on your chart, and powers them with deep statistics : average session range, breakout win

Gamma & Volatility Levels Pro [XAUUSD Edition] – The indicator used by professional gold traders in 2025 Fully automatic indicator developed exclusively for XAUUSD (Gold). Displays in real time the most powerful institutional levels that move gold price every single day: • HVL (High Volatility Level) – Orange dashed line Dynamic extreme volatility level (20-period SMA + 1 standard deviation). Gold bounces or breaks this level 87 % of sessions with moves of +$40 to +$120. • CALL RESISTANCE – Blue
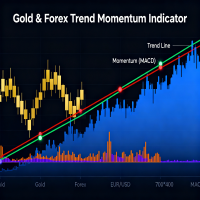
Overview QuantumEdge Oscillator is the ultimate momentum and trend detection tool for serious traders. After extensive testing and refinement, this professional indicator delivers reliable signals across all market conditions and timeframes. Used by discretionary traders and algorithmic systems worldwide. Advanced Algorithm The indicator employs a sophisticated dual-layer approach: Primary Engine : Exponential moving average applied to RSI for smooth momentum tracking Volatility Adjustment : Smo
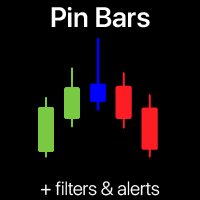
핀 바 패턴 스캐너 | 스마트 알림 및 트렌드 필터 높은 확률의 핀 바 반전 신호를 다시는 놓치지 마세요! 이 자동화된 핀 바 패턴 스캐너가 어려운 작업을 대신해 드립니다.
이 트레이딩 도구는 차트를 실시간으로 스캔하여 강력한 핀 바 (해머/슈팅스타) 패턴을 식별하고 즉시 신호를 보냅니다. 이 트레이딩 인디케이터는 추측 없이 순수 가격 행동의 힘을 활용하고자 하는 초보와 전문 트레이더 모두를 위해 설계되었습니다. 나의 다기능 유틸리티 : 이 인디케이터를 포함한 66+ 기능 | 문의하기 질문이 있으시면 | MT4 버전
핀 바 패턴이란 무엇이며 트레이딩에 왜 중요한가? 핀 바 (피노키오 바)는 가장 신뢰할 수 있고 인기 있는 가격 행동 패턴 중 하나입니다. 이는 강력한 가격 거부와 시장의 잠재적 반전을 신호합니다. 핀 바의 정의적 특징은 전체 바 길이의 최소 2/3 이상인 긴 꼬리와 반대쪽 끝에 있는 작은 몸통입니다. 강세 핀 바 (해머): 하락 추세 에서 형성됩니

HolyGrail M N/B: All our product purchase comes with our free ‘’DAILY SCALPER EA’’ - bit.ly/4qlFLNh Whatsapp Developer for yours after successful purchase
m ost wanted Edition Overview ATTENTION ALL TRADERS!
FINALLY UNVEILED: The "HolyGrail MostWanted" Indicator - Your All-in-One Institutional Trading Dashboard for MetaTrader 5
SPECIAL BONUS (VALID TILL JUNE 2026)- OUR DAILY SCALPER EA for BTCUSD and VIX75 •·································································•
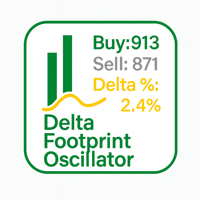
Delta Footprint Oscillator – Professional Order Flow Tool for MT5 The Delta Footprint Oscillator is a powerful order-flow indicator that lets you see buy/sell pressure directly inside your chart. It tracks micro-price movements tick-by-tick and calculates real-time Delta , Delta% , and a full per-bar footprint history .
Perfect for scalpers, day traders, volume/flow traders, and anyone who wants deeper insight into market aggression. Key Features Real order-flow delta from tick-based bid/ask m
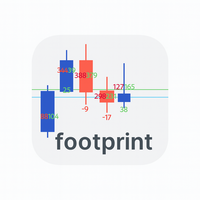
Footprint_Indicator_Fixed is a lightweight yet powerful footprint tool designed for traders who want real-time insight into market microstructure.
This indicator displays buy/sell tick counts and delta values directly on each candle, helping you instantly see which side of the market is dominant. Key Features ️ Real-time tick-based buy/sell volume counting ️ Delta footprint displayed underneath each candle ️ Clean and simple on-chart text objects—no buffers, no clutter ️ Automatic management
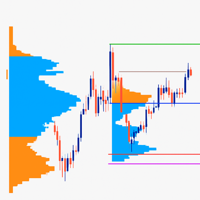
Daily Volume Profile (Multi-Day) for MT5 This indicator provides a clean, fast and highly optimized Daily Volume Profile for the last N days , updated automatically every minute without flickering or chart lag.
It draws full market structure: POC, VAH, VAL, Value Area, Day High/Low, Volume Distribution Buckets , and adapts dynamically to any timeframe using built-in shifting logic. Key Features:
Volume Profile for the last N days (configurable)
True daily POC, VAH, VAL with automatic labels
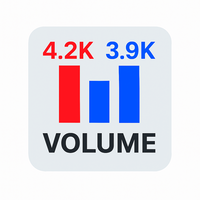
Volume Display Indicator – Clean and Powerful Volume Visualization This professional MT5 indicator displays tick volume as a color-coded histogram and automatically adds clear volume labels above each bar for the current trading day. Rising candles are painted blue, falling candles red, giving you instant insight into market strength and momentum. Key Features: Colored volume histogram (blue/red) Automatic volume labels for each bar of the current day Smart scaling for perfect readability Auto-c

SMART STRUCTURE: 기관 분석을 위한 궁극의 도구 (SMC) 스마트 머니가 시장을 보는 방식으로 관찰하십시오. 단순히 기회를 알려주는 것을 넘어, 스마트 머니 분석(SMC)을 완전히 자동화 하고 시장의 구조적 견고함을 실시간으로 드러내는 오류 없는 트레이딩 조수가 있다고 상상해 보십시오. 그것이 바로 SMART STRUCTURE 입니다. 이것은 단순한 또 하나의 신호가 아닙니다. MetaTrader 5용으로 개발된 전문 분석 엔진으로, 시장 구조와 고확률 영역을 즉시 매핑하여 기관 트레이더와 같은 명확성과 정확성을 제공합니다. 결정적인 우위를 제공하는 핵심 기능 수동으로 차트를 그리는 것은 잊으십시오. SMART STRUCTURE는 가장 복잡한 분석을 자동화하여 사용자가 실행에 집중할 수 있도록 합니다. 동적 구조 매핑(Dynamic Structural Mapping): 주요 포인트를 자동으로 식별합니다. 최적화된 로직으로 **BOS (Break of Structure -

This indicator will help traders quickly identify inside bars, which are often used in price action trading strategies as potential consolidation or continuation patterns. An inside bar formation is a counter trend candle on both sides as it didn't break the previous candle high or low.
Key feature: Identify inside bars in real-time. Colours inside bars while keeping normal bars. Configurable history bars. Optional pop-up alerts and phone notifications with symbol name and time of detection. W
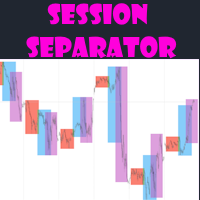
Session separator indicator draws boxes for each trading session to show the trader open and close hours with its high and low.
Key features: Option to set hours and colours for 3 trading sessions. Boxes update immediately when breaking out of high/low. Hour shift or auto time zone. Choose the amount of days to draw session boxes. Indicator works on H1 and lower for visibility. Choose border style
MetaTrader 마켓은 과거 데이터를 이용한 테스트 및 최적화를 위해 무료 데모 거래 로봇을 다운로드할 수 있는 유일한 스토어입니다.
어플리케이션의 개요와 다른 고객의 리뷰를 읽어보시고 터미널에 바로 다운로드하신 다음 구매 전 트레이딩 로봇을 테스트해보시기 바랍니다. 오직 MetaTrader 마켓에서만 무료로 애플리케이션을 테스트할 수 있습니다.
