YouTube'dan Mağaza ile ilgili eğitici videoları izleyin
Bir alım-satım robotu veya gösterge nasıl satın alınır?
Uzman Danışmanınızı
sanal sunucuda çalıştırın
sanal sunucuda çalıştırın
Satın almadan önce göstergeyi/alım-satım robotunu test edin
Mağazada kazanç sağlamak ister misiniz?
Satış için bir ürün nasıl sunulur?
MetaTrader 5 için yeni teknik göstergeler - 19

MT4 Sürümü: https://www.mql5.com/en/market/product/157679 MT5 Sürümü: https://www.mql5.com/en/market/product/157680
Destek Direnç — Akıllı Piyasa Yapısı Seviyeleri
Profesyonel yatırımcılar ve otomatik sistemler için tasarlanmış, temiz, akıllı ve son derece güvenilir bir Destek ve Direnç göstergesi.
Destek Direnç, Fraktallar, ATR tabanlı fiyat segmentasyonu ve çoklu zaman dilimi analizini birleştiren gelişmiş bir kümeleme algoritması kullanarak gerçek piyasa seviyelerini tespit etmek üzere ta

Fibonacci Auto Levels Pro MT5 – Geri Çekilmeler, Uzatmalar ve Pivot Noktaları (Pivot Points) Fibonacci Auto Levels Pro MT5, piyasa salınım (swing) noktalarını otomatik olarak tespit eden ve grafikte eksiksiz Fibonacci Geri Çekilme (Retracement), Uzatma (Extension) ve Pivot Noktası (Pivot Point) yapılarını çizen gelişmiş bir teknik analiz aracıdır. Bu gösterge, birkaç bağımsız sistemi tek bir birleşik analiz aracında birleştirir: Pivot Noktaları (Fibonacci Modu) Pivot Noktaları, önceki dönemin fi
SI Bollinger Bantları Ok Stratejisi (RSI Bollinger Bands Arrow Strategy) RSI Bollinger Bantları Ok Stratejisi, RSI ve Bollinger Bantlarının kombinasyonunu kullanarak yüksek olasılıklı dönüş noktalarını belirlemek için tasarlanmış temiz ve etkili bir teknik göstergedir. Bu strateji, RSI göstergesini Bollinger Bantları ile birlikte kullanarak: Fiyat, üst Bollinger Bandının üzerindeyken satar . Fiyat, alt Bollinger Bandının altındayken alır . Sinyaller, yalnızca her iki göstergenin de aynı piyasa k

Gelişmiş Piyasa Mikro Yapı Analiz Göstergesi Bu gösterge, büyük hareketlerden önce gizli dengesizlikleri tespit etmek için fiyat hareketini mikroskobik düzeyde analiz eder. Sadece fiyata bakan geleneksel göstergelerden farklı olarak StructureFlow , üç kritik boyutu inceler: Temel Analiz Mum Mikro Yapısı Fitil/gövde oranı analizi Gövdenin aralık içindeki konumu Genişleme/daralma tespiti Dahili volatilite anomalileri Yutan mum formasyonlarını tanıma Piyasa Temposu Fiyat hızının ölçülmesi Mikro har
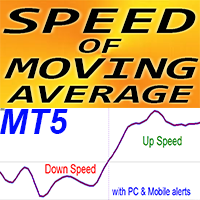
Crypto_Forex Göstergesi "MA Hızı" MT5 için, Yeniden Boyama Yok.
Hareketli Ortalamanın HIZI - benzersiz bir trend göstergesidir.
- Bu göstergenin hesaplanması fizikteki denklemlere dayanmaktadır. - Hız, Hareketli Ortalamanın 1. türevidir. - MA Hızı göstergesi, MA'nın yönünü ne kadar hızlı değiştirdiğini gösterir. - MA Hızı ile standart stratejileri bile yükseltmek için birçok fırsat vardır. SMA, EMA, SMMA ve LWMA için uygundur. - Trend stratejilerinde MA Hızı kullanılması önerilir, göstergenin
Temel Özellikler EMA Trend Filtresi Gösterge, mevcut trend yönünü tespit etmek için özelleştirilebilir bir EMA (Üstel Hareketli Ortalama) kullanır. Fiyatın EMA'nın üzerine geçmesi → Al Sinyali Fiyatın EMA'nın altına geçmesi → Sat Sinyali Dinamik Destek ve Direnç Seviyeleri Dahili yüksek/düşük yapısı: Kırmızı Çizgi → Önceki N barın en yüksek zirvesi (Direnç) Yeşil Çizgi → Önceki N barın en düşük dip noktası (Destek) Bu seviyeler, zayıf sinyalleri filtrelemeye ve güçlü kırılımları belirleme

Grafik Sanatçısı - MT5 Grafikleriniz İçin Kişisel Çizim Asistanınız (Şimdi Optimize Edildi ve Daha Akıcı!) Merhaba! MT5'teki hantal ve yavaş çizim araçlarından bıktınız mı? Ticaret fikirlerinizi kağıda çizmek kadar kolay bir şekilde çizebilmeyi mi istiyorsunuz? Grafik Sanatçısı, aynı hayal kırıklığından doğdu; basit, hızlı ve sezgisel olacak şekilde tasarlandı. Aylarca süren iyileştirmeler ve kullanıcı geri bildirimlerini dinledikten sonra, en yeni ve daha da iyi sürümünü paylaşmaktan heyecan d
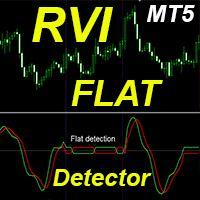
Crypto_Forex Göstergesi RVI FLAT Dedektörü - alım satımda etkili bir yardımcı araçtır! Yeniden Boyama Yok. MT5 için bu harika göstergeyle alım satım yöntemlerinizi geliştirmenizi öneriyorum.
- Gösterge, grafikte fiyatın düz alanlarını gösterir. "Düz duyarlılık" parametresi, düz alanların tespitinden sorumludur. - RVI FLAT Dedektörü, Fiyat Hareketi girişlerinin onaylanması veya Aşırı Satış (-0,23'ün altında) / Aşırı Alım (0,23'ün üzerinde) bölgelerindeki işlemler için kullanılabilir. - Trend ta

Rossi Campos Arrows Indicator – Gerçekten çalışan bir indikatörle işlem yapın Piyasaya giriş ve çıkışlarda daha fazla netlik arıyorsanız, bu indikatör sizin için üretildi.
MetaTrader 5 için Bollinger Bantları ve RSI gibi en saygın iki teknik filtreyi aynı anda birleştiren özel bir indikatör geliştirdim. Algoritma sizin yerinize tüm ağır işi yapar: Gerçek bir alım fırsatı oluştuğunda grafikte yeşil bir ok belirir. Satış zamanı geldiğinde kırmızı bir ok gösterilir.
Basit, direkt ve görseldir. Nede
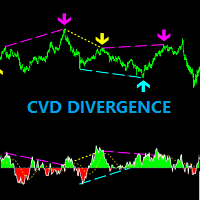
CVD Divergence – Profesyonel Emir Akışı ve Diverjans Analizi CVD Divergence, fiyat ile Kümülatif Delta Hacmi (CVD) arasındaki güvenilir uyumsuzlukları tespit etmek için tasarlanmış teknik bir göstergedir. Gerçek emir akışının fiyat hareketini doğrulamadığı anları yüksek hassasiyetle belirleyerek olası dönüşleri, momentum zayıflamasını ve kurumsal manipülasyonları ortaya çıkarır. Gösterge, agresif hacim analizini fiyat yapısıyla birleştirerek net, objektif ve erken sinyaller sağlar. Göstergenin Ö

Golden Trader Panel - Nihai İşlem Gösterge Paneli Neden Golden Trader Panel'i Seçmelisiniz? Güçlü Özellikler: Zarif altın tasarımlı profesyonel gösterge paneli Tek bakışta kapsamlı hesap özeti 1-10 saniyede bir otomatik yenileme (özelleştirilebilir) İşlem durumu anlık tanıma için akıllı renk kodlama Gerçek Zamanlı Bilgi Görüntüleme: Açık İşlem Sayısı - Tüm aktif pozisyonları takip edin Hesap Bakiyesi - Ana para biriminde mevcut bakiye Gezici Kâr/Zarar - Otomatik renklendirmeli can
FREE
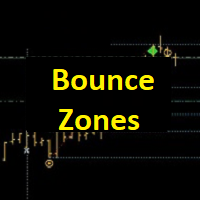
+++++++++++++++++++++++++++++++++++++++++++++++++++++++++++++++++++++++++++++++++++++++++++++++++++++++ +++ Link to EURUSD Only Free Version --> https://www.mql5.com/en/market/product/156904 +++ Full License --> https://www.mql5.com/en/market/product/156842 +++++++++++++++++++++++++++++++++++++++++++++++++++++++++++++++++++++++++++++++++++++++++++++++++++++++ +++ XMAS SALE
+++ Get this indicator for free when renting the Forecast System Full License (one license for one account)
+++ Please

What Makes NeuroSignal AI Exceptional? 1. Intelligent Multi-Layer AI Signal Generation The core of NeuroSignal AI is its proprietary algorithm that synthesizes data from multiple classic indicators to form a unified "prediction." It dynamically analyzes: Trend (MA Filter): Uses fast and slow moving averages to gauge market momentum. Momentum (RSI & MACD): Evaluates overbought/oversold conditions and trend strength. Volatility (ATR): Measures market volatility to adjust stop-loss and tak

Kuantum Volatilite Analizi ve Piyasa Rejimi Tespiti Schrödinger Market Wells (SMW) , geleneksel teknik analize alternatif bir yaklaşım sunar. Yalnızca basit istatistiksel sapmalara dayanan standart volatilite bantlarının aksine, SMW fiyat hareketini Finansal Kuantum Mekaniği ilkelerini kullanarak modeller. Bu gösterge, fiyatı bir "Potansiyel Kuyusu" (Potential Well) içinde etkileşime giren bir parçacık olarak yorumlayarak, yatırımcıların fiyatın bir aralıkta kalma veya yapısal bir kırılım gerçek

EXTREME POI Indicator Join the telegram community for an exciting trading journey. https://t.me/automated_TLabs Professional Trading Indicator for MetaTrader 5/Metatrader 4
EXTREME POI is an advanced institutional-grade trading indicator designed to identify high-probability Points of Interest (POI) based on Smart Money Concepts. The indicator combines multiple sophisticated techniques to detect areas where institutional traders are likely to enter the market.
Working Pairs GOLD, EURUSD,
FREE

Mogalef Bands — Dynamic Range Structure & Target Zones (MT5) Mogalef Bands is a visual market-structure indicator that models price as a dynamic range that shifts in stages. Instead of relying on isolated “signals”, it provides contextual levels to: identify where price is currently “working” (operating zone), locate potential extension areas (targets), and filter market noise through a non-impulsive, stable update logic (with inertia). It is designed for discretionary traders who want clear lev
REVERSAL POWER PRO
The ONLY Indicator That Shows You Where Markets WILL Reverse - BEFORE They Move
WELCOME TO THE NEXT LEVEL OF TRADING PRECISION
Tired of guessing where the market will turn? Missing entries because you don't know where support/resistance REALLY is? Getting stopped out at "fake" levels? Wondering if your bias is correct before entering?
What if you had: Crystal-clear Supply/Demand Zones that markets RESPECT Daily Bias Engine telling you market directio
FREE

HiloPower – Advanced Trend and Market Strength Indicator for MetaTrader 5 HiloPower is not just another trend indicator developed from the traditional Hi-Lo. It was designed to offer a more complete and intelligent reading of the market, combining direction, strength, and intensity of movements. With it, the trader can see not only where the price is going, but also how strong and volatile that movement really is.
FREE
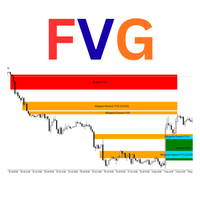
Luta FVG Pro – Professional Fair Value Gap (FVG) Indicator
Detects Institutional Fair Value Gaps on H4 timeframe with the same way used by ICT/SMC traders.
Features: • Real-time Bullish & Bearish FVG detection • Automatic Mitigation tracking • Inverted FVG signals (very powerful reversal setups) • "GOOD" FVG marking (gaps ≥ 2× minimum size – higher probability) • Clean rectangles with smart labels (Bullish FVG / Mitigated / Inverted) • Overlap filter option • Maximum 50 active zones (no chart
FREE
Stop losing money to sudden spread widening. In modern volatile markets (especially Gold and Crypto), spreads can double in seconds. Manual spread timers are outdated and annoying to configure. Pro Smart Spread Timer (Pro SST) solves this with "Zero Config Technology" .
Just drop it on any chart. It automatically analyzes the past 100 bars, learns the "normal" spread for that specific symbol, and sets the perfect alert threshold instantly. Why Pro SST? Zero Setup: No need to type "2

VM SuperAshi Trend Precision Trend Sniper using Smoothed Heiken Ashi, Supertrend and EMA Trend
Optimized for M1–M5 Scalping
Overview VM SuperAshi Trend is an indicator that combines a standardized Supertrend with smoothed Heiken-Ashi candles to deliver clear, confirmed, and non-repainting buy/sell signals directly on the chart. It automatically draws Buy/Sell arrows, displays Fast, Slow, and Trend EMA lines, and provides Popup, Email, and Push notifications.
Key Features Supertrend-based signal

Harmonic Pattern Suite Pro Introduction Harmonic Pattern Suite Pro is an indicator designed to identify and display harmonic structures on the chart based on X-A-B-C-D sequences. Its purpose is to present pattern formations that meet geometric and proportional criteria, providing a clear visual representation directly on the chart. The indicator automates the detection process, removing the need for manual measurement of ratios and allowing the user to review the structural configuration withou
FREE
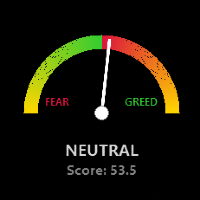
Global Market Risk Sentiment Meter 1. Abstraction The Global Market Risk Sentiment Meter is a sophisticated analytical tool designed for the MetaTrader 5 (MQL5) platform. Unlike traditional indicators that analyze a single asset in isolation, this utility employs an Inter-Market Analysis approach to reconstruct the psychological state of the global financial markets. By aggregating real-time data from US Indices, Global Equities, Cryptocurrencies, and Safe Haven assets (Gold and the US
FREE

Shadow Bands Pro – MT5 说明(中英文) English Description (MT5) Shadow Bands Pro – Advanced Reversion System for MT5 This MT5 edition of Shadow Bands Pro takes full advantage of the MT5 platform, offering faster calculations, more timeframes, and better testing capabilities.
It remains a non-repainting (on close) trend-reversal / mean-reversion tool with dynamic channels, entity-break logic, and an integrated statistics panel. Key Features Optimized for MT5’s 64-bit, multi-threaded architecture Non-
FREE
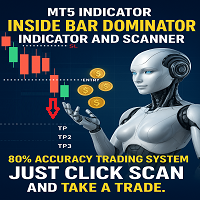
N/B: All our product purchase comes with our free ‘’DAILY SCALPER EA’’ - bit.ly/4qlFLNh Whatsapp Developer for yours after successful purchase
UNLOCK THE 4-CANDLE SECRET: Trade Like a PRO with "Inside Bar Dominator"
ATTENTION ALL TRADERS!
Are you tired of:
· Losing trades from false breakouts? · Missing entries because you're stuck analyzing charts? · Complex indicators that give conflicting signals? · Struggling to find clear stop loss and take profit levels?
What if I told you th

HMA Color – Master Smoothed A clean, high-precision visual Hull Moving Average indicator with fully smoothed trend color display. Designed for professional scalpers and algorithmic traders who want a simple, fast, powerful trend view without noise. This indicator is built with a " true double smoothing system" , making the Hull curve extremely soft and responsive.
When the trend is bullish, the HMA line automatically switches to Green and shows upward candles.
When the trend is bearish, the HM
FREE

The DFG Chart Indicator displays the historical DFG levels used in the DFG dashboard. These levels are generated dynamically using moving averages and Fibonacci ratios. The Fibonacci Bands automatically adjust to reflect changes in the price range and trend direction. The indicator also features buttons for selecting chart symbol and timeframe, along with a wide range of customization options. Key Features Dynamic DFG Levels
Automatically calculated using moving averages and Fibonacci ratios. H
FREE

RM Divergence Pro - Advanced RSI Divergence and Inability Indicator, It is a professional, non-repainting RSI divergence indicator based on real market structure. It detects Regular Divergence, Hidden Divergence, Inability, and Potential Divergence using confirmed RSI swings, price behavior, and advanced filters for clean and reliable analysis.
================================================== OVERVIEW ================================================== RM Divergence Pro is an advanced RSI-base

StrikeZone ATR is a professional-grade ATR-based volatility indicator designed for precision intraday trading.
It visualizes volatility strength using a dynamic histogram and smoothed deviation line, helping traders instantly identify expansion, contraction, trend strength, and reversal zones. Key Features TradingView-style ATR histogram (Up/Down bars with multi-color levels) Smoothed deviation line for clearer volatility trend Instant detection of volatility spikes and quiet zones Color-coded b
FREE
Optimized Trend Tracker Oscillator Indicator for MT5 (OTTO) A precision-engineered trend tracking oscillator designed for traders who demand clarity, adaptability, and multi-layered signal confirmation. OTTO combines adaptive volatility modelling, advanced moving averages, and trend-stop logic to produce an oscillator that reacts intelligently to market structure rather than noise. This indicator is suitable for traders who want early trend detection, dynamic stop-zones, and visually clean cross

StrikeZone Macd Atr is an advanced volatility-adaptive oscillator that scales the traditional MACD using ATR.
This approach solves the common problem of conventional MACD: it does not react properly to changing volatility.
With ATR scaling, momentum becomes clearer, smoother, and more meaningful across all market conditions. Key Features 1. ATR-Scaled MACD Oscillator The indicator adjusts (MACD – Signal) by ATR ratio, allowing: Reduced noise during high-volatility periods Enhanced sensitivity du
FREE
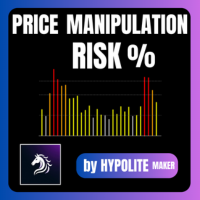
Price Manipulation Risk Indicator Advanced Tool for Market Risk Evaluation & Manipulation Detection Price Manipulation Risk Indicator is a professional tool designed to measure the current risk level in the market.
It evaluates price behavior, market activity, and candle dynamics to detect unstable or potentially manipulated environments. This indicator helps traders avoid traps , filter false signals , and improve timing in both entries and exits. Product Purpose Provide an immediate a

AI Adaptive Market Holographic System Indicator Based on Microstructure and Field Theory Abstract: This paper aims to explore the construction principles and implementation mechanism of a novel financial market analysis tool—the Micro gravity regression AIselfregulation system. This system fuses Market Microstructure theory, classical mechanics (elasticity and gravity models), information entropy theory, and adaptive AI algorithms. By aggregating Tick-level data in real-time, physically modeling

TCM Breakeven Calculator Ultra is a professional utility designed to instantly visualize your True Weighted Average Entry Price with the Total Lot Size . Unlike simple averages, this tool mathematically accounts for Lot Sizes , giving you the exact price where your net position reaches zero loss. It automatically scans your terminal and isolates trades based on the chart you are viewing. If you are trading multiple pairs (e.g., EURUSD and Gold) simultaneously, this indicator will onl
FREE

Nebula Gold Strike – Micro-Noise Heatmap + Hybrid Direction Logic + Tick Anomaly Detector Version 1.3 | Copyright 2025 Bob's Channel | t.me/BobsGoldCrusherVIP
"See the market in ticks — not bars."
What You Get in 1 Minute - Hybrid Heatmap: Real-time color shows **direction + noise level** (green = bullish clean, dark red = bearish chaos). - Tick Anomaly Dot: Yellow alert **the moment** a statistically weird tick arrives — no bar-close delay. - DOM Imbalance Line: Buyer vs selle
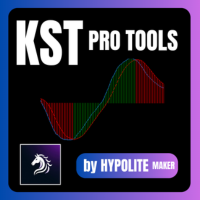
KST Pro Tools – Smart Momentum Indicator Overview KST Pro Tools is an advanced momentum indicator based on Martin Pring’s classic Know Sure Thing (KST) .
It has been redesigned to deliver a clean, instant, and unambiguous momentum reading , thanks to a smart and fully filtered histogram logic. This indicator shows only meaningful momentum , exactly when it matters. Indicator Components KST Line (blue) Measures the true strength of market momentum Built using 4 weighted and smoothed Rate

New Trend Stage is a unique next-generation indicator that creates dynamic projections of market movement based on real data from the current day. These are not classical channels. This is an enhanced system of proprietary geometry built on the principles of time shifts, range dynamics, and adaptive levels.
The indicator automatically detects and calculates the true range for the last N hours relative to each extremum and constructs precise, direction-based projections of future price movement
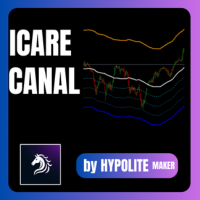
CANAL d'ICARE (Icarus Channel) Master the art of flight and prudence. The ICARUS CHANNEL is the ultimate tool for identifying "Discount" buy zones and "Premium" sell zones in the market. Inspired by the desire to reach new heights, this unique indicator dissects price action into strategic levels around its average. It empowers you to trade with professional discipline, clearly showing when the market is too expensive (Premium) or too cheap (Discount). Key Features and Benefits Base SMA (T

Multi-RSI – 4 RSIs in 1 for Complete Market Analysis Analyze market strength and momentum like a pro! Multi-RSI combines 4 distinct RSIs in a single window , giving you a clear and fast view of market momentum across multiple timeframes. Each RSI has its own configurable period , allowing you to adapt the indicator to your trading strategies and style. Key Features: 4 RSIs in one indicator – track multiple periods simultaneously. ️ Fully customizable periods – adjust each RSI individ
Hi Traders, The THV EMA Distance Monitor is a lightweight and flexible MT5 indicator designed to display the real-time distance between price and multiple Exponential Moving Averages (EMA) directly on the chart. The indicator allows traders to enable or disable up to five EMAs, each with a customizable period, making it adaptable to different trading strategies and market conditions. For each selected EMA, the distance from the current price is calculated and displayed in a clear on-chart panel.
FREE
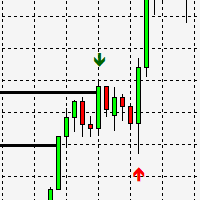
This MT5 indicator shows highs and lows of three timeframes (TF) of choice on one chart.
Any correct configuration of your required triple TF highs & lows can aid significantly in your understanding of live and past market structure. *** UPDATE - NEW CONFLUENCE: BOS DETECTION *** This indicator has the following feautures: Hierarchical structure of highs and lows in three timeframes of choice.
(E.g., if a 5 minute high is a 1 hour high and also a 4 hour high, it is marked as 4 a hour high). Line
(Special New Year promotion - free price!) The indicator displays the actual 'Scale in points per bar' (identical to the manual setting in the Terminal, see screenshot)
in the upper right corner of the chart.
The displayed value changes INSTANTLY whenever the chart scale is changed! (This is very convenient when planning screenshots).
In Settings: Change language (Russian/English), font size of the displayed text, text label offset coefficient from the graph corner, equally in X and Y directi
FREE

ATR Plus is an enhanced version of the classic ATR that shows not just volatility itself, but the directional energy of the market .
The indicator converts ATR into a normalized oscillator (0–100), allowing you to clearly see: who dominates the market — buyers or sellers when a trend begins when a trend loses strength when the market shifts into a range where volatility reaches exhaustion zones ATR Plus is perfect for momentum, trend-following, breakout and volatility-based systems. How ATR Plus
FREE
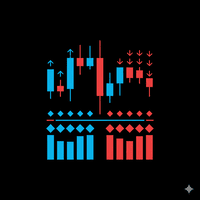
TrendPower All-In-One Strict v1.00 Description TrendPower All-In-One Strict is a comprehensive trend-following trading system designed for MetaTrader 5. It acts as a "confluence detector," meaning it filters market noise by requiring multiple technical indicators to agree before generating a signal. The indicator utilizes a "Strict" logic engine, meaning a signal is only generated when momentum, trend direction, and volatility filters all align perfectly. It displays data in a separate sub-win
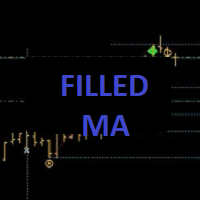
++++++++++++++++++++++++++++++++++ +++ Trend Tool ++++++++++++++++++++++++++++++++++ Hallo Trader, This is a trend tool that I use... based on four moving averages. Price below or above the EMA200 is indication for the long term trend. Also the direction of the slope counts. You can customise in settings if you want. The tool is aligned with my Forecast System and the Bounce Zones. - Forecast System --> https://www.mql5.com/en/market/product/156904 - Bounce Zones --> https://www.mql5.com/en/mar
FREE

MSX Hybrid Heiken Scalper Elevate Your Scalping Precision with a Next-Generation Non-Repaint Heiken Ashi Indicator The MSX Hybrid Heiken Scalper is a scientifically designed, non-repainting Heiken Ashi indicator optimized for M5 to H1 scalping on MetaTrader 5. It introduces a robust closed-bar smoothing method that preserves trend clarity while filtering minor price noise — all without using traditional EMA/WMA/HMA smoothing that causes repainting. Reliable Closed Candle Logic
Each candle’s
FREE
N/B: All our product purchase comes with our free ‘’DAILY SCALPER EA’’ - bit.ly/4qlFLNh Whatsapp Developer for yours after successful purchase
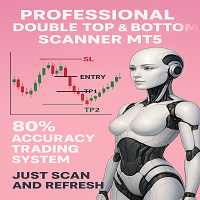
PROFESSIONAL DOUBLE TOP/BOTTOM PATTERN SCANNER
The Ultimate Reversal Trading System for Forex & Crypto Traders
TRANSFORM YOUR TRADING WITH INSTANT PATTERN RECOGNITION
Are you tired of missing profitable reversal setups? Exhausted from staring at charts for hours, trying to spot double tops and bottoms? Frustrated with false breakouts and misse
Hi Traders, The Volume Spike Alert Indicator is a lightweight, non-lagging tool designed to help traders identify unusual volume activity in real time. This indicator calculates the average tick volume over a user-defined number of previous bars and compares it with the current candle’s volume. When the current volume exceeds the average by a specified percentage, the indicator triggers alerts, allowing traders to quickly spot potential breakouts, institutional activity, or strong market interes
FREE

Quantum Frequency Indicator MT5 Universal Market Frequency Analyzer for MT5 Trade Forex, Crypto, Stocks & Indices With Advanced Frequency-Based Signals Overview The Quantum Frequency Indicator (QFI) MT5 Version is a next-generation analytical tool designed to detect the hidden frequency structures within financial markets. Based on 14 years of research into market vibrations, price cycles and energy flow patterns, QFI provides traders with highly refined Buy and Sell zones across all major
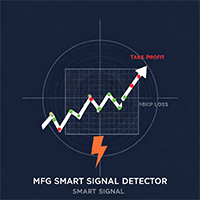
MFG SMART SIGNAL DETECTOR v3.10 - Professional Breakout Trading System Transform Your Trading with Our Proprietary Breakout Detection Technology The MFG SMART SIGNAL DETECTOR v3.10 is a sophisticated MetaTrader 5 indicator that revolutionizes how traders approach market breakouts. Built with cutting-edge algorithms and exclusive market analysis techniques, this indicator identifies high-probability trading opportunities that most traders completely miss. Why Choose MFG SMART SIGNAL DETECTOR? Pro
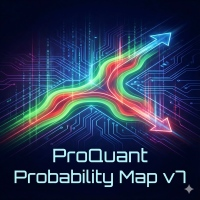
ProQuant Probability Map: A Dual-Quant Prediction System to Navigate the Future Say goodbye to blind guessing. Let historical data be your compass. The ProQuant Probability Map is an advanced quantitative tool exclusively designed for MetaTrader 5. Unlike traditional lagging indicators (such as RSI or MACD), it calculates historical price distribution probabilities in real-time, directly projecting a "Heatmap" of potential future price levels onto the right side of your chart. Version 7 introduc

Hi Traders, Info Panel with PnL Coloring is a compact yet powerful on-chart dashboard for MT5.
It delivers real-time insights into Buy/Sell volume, symbol-based PnL, overall account performance, margin status, and detailed candle metrics.
With dynamic color-coding and a live candle countdown, this panel helps you monitor your essential trading information and market conditions instantly so that you can make decisions with greater clarity and precision. Abbreviations (current candle information)
FREE

RITZ Candle Kaufman’s AMA is a precision market-flow indicator built around Kaufman’s Adaptive Moving Average (KAMA / AMA) — a dynamic smoothing algorithm that automatically adjusts to changing volatility.
This enhanced version interprets AMA momentum directly into smart candle-color signals , giving traders a clean, noise-filtered view of trend strength and directional bias. Where most indicators repaint or react too slowly, RITZ Candle AMA delivers stable, non-repainting color shifts based on
FREE

APT – Advance Pivot Trader Indicator for MetaTrader 5 APT – Advance Pivot Trader is a technical indicator developed for MetaTrader 5.
The indicator is based entirely on mathematical and algorithmic calculations and is designed to analyze market structure using pivot-based logic. The indicator does not use grid techniques, martingale strategies, or position sizing methods. It provides analytical information to support structured and disciplined trading decisions. Timeframe and Risk Guidance The
FREE

his indicator automatically identifies key support and resistance levels by analyzing volume patterns. Unlike traditional S/R tools that rely only on price, Volume S/R finds levels where the market truly reacted. DETECTION LOGIC: - High Volume Zones: Price levels where strong buying/selling occurred - Low Volume Zones: Areas of weak interest - potential breakout or reversal zones
SMART FILTERING: - Nearby levels are automatically merged to avoid chart clutter - Maximum levels limit keeps yo
FREE

A custom indicator that displays a real-time countdown showing how much time remains before the current candle closes and the next one opens. Equipped with a 10-second audio countdown , providing a visual–auditory reminder so traders don’t miss critical moments before a candle closes and can execute decisions with precision. Highly useful for traders who rely on precise timing whether for entries, exits, or analyzing momentum that forms exactly at candle open and close.
FREE

N/B: All our product purchase comes with our free ‘’DAILY SCALPER EA’’ - bit.ly/4qlFLNh Whatsapp Developer for yours after successful purchase
PATTERN 123 PRO - REVOLUTIONARY TRADING SIGNALS INDICATOR
WHY 98% OF TRADERS FAIL - AND HOW WE FIXED IT
Traders lose money not because they can't read charts, but because they can't filter NOISE from REAL OPPORTUNITIES. They see patterns everywhere, but which ones actually work? Which signals are still valid by the time they spot them?
WE

This ForexTrading Sessions indicator is a powerful visual tool for MetaTrader 5 that highlights the three major forex trading sessions (Asian, London, and New York) on your chart with the Asian Mid-line. 1. Trading Session Visualization Asian Session : 00:00 - 09:00 GMT (blue/aqua color) London Session : 08:00 - 17:00 GMT (magenta color) New York Session : 13:00 - 22:00 GMT (orange color) 2. Time Zone Adaptation TimeZoneShift input allows you to adjust sessions to your local time Example:
FREE

This indicator is a hybrid SMC + Trend + Oscillator tool that draws market-structure objects on the chart and also plots trend shift lines + arrows and a colored oscillator histogram.
It includes these modules:
Phantom Shift (ATR trend shift / trailing bands)
Swing Structure (BOS/CHoCH + swing points)
Internal Structure (iBOS/iCHoCH)
Order Blocks (swing + internal)
Equal Highs / Equal Lows (EQH / EQL)
Fair Value Gaps (FVG)
Premium / Discount zones (range zones)
Phantom Oscillator (MA
FREE

Supply and demand in trading describes how buyer (demand) and seller (supply) actions set asset prices, with high demand/low supply raising prices (premium) and low demand/high supply lowering them (discount); traders identify these imbalances as "zones" on charts (e.g., Rally-Base-Rally for demand, Drop-Base-Drop for supply) to find potential entry/exit points, aiming to buy at discount demand zones and sell at premium supply zones, using volume and price action to confirm institutional acti
FREE

Candle color RSI (Relative Strength Index) indicators change candlestick colors on the price chart to visually show RSI conditions like overbought/oversold levels or bullish/bearish momentum, using colors like red for overbought/bearish and green for oversold/bullish, helping traders spot reversals or strength at a glance without looking at the separate RSI pane. These custom indicators often color candles red above 70 (overbought), green below 30 (oversold), and keep default colors in between
FREE

Institutional OrderFlow Insight Smart Money Concepts (SMC) Indicator for MetaTrader 5 Professional trading tool that reveals institutional order flow, market structure, and smart money activity through advanced Smart Money Concepts (SMC) analysis. SMART MONEY CONCEPTS SUITE Market Structure Analysis: Break of Structure (BOS) Detection - Identify trend continuation Change of Character (CHOCH) Recognition - Spot trend reversals Swing Point Analysis - Professional high/low detectio

Power To Move (PTM) – The Market Energy Engine Stop guessing direction. Start measuring Power. Recommended Experience Level: Beginner to Advanced Trading is not just about Up or Down; it is about Energy.
A market without energy is a trap. Power To Move (PTM) is a statistical "Physics Engine" for your chart. It integrates Price Action, Volume, Momentum, and Range into a single Energy Vector. Instead of lagging indicators, PTM tells you the current thermodynamic state of the market. It det

EUR/USD PRO — Institutional Composite Indicator
A professional-grade indicator optimized specifically for EUR/USD, integrating institutional analysis concepts into a single tool. This system combines DXY MTF analysis, session-based VWAP, ADR/ATR metrics, market structure (BOS/CHOCH), SMC (FVG/OB), cross-asset correlations, and a confluence panel with a floating signal. It features a Neumorphic UI with movable panels, pip-calculated spread display, and structured logging. Designed for universal

True B Bands
A Bollinger Bands indicator for MetaTrader 5 with squeeze detection, volatility measurement, and real-time panel. Overview
Displays price position, volatility level, and consolidation conditions. Helps traders identify low-volatility phases before price moves. Charts Plots - Upper Band (Red) - Middle Band (Blue SMA) - Lower Band (Green) Key Features
- Show/Hide Button Toggle panel visibility
- On-Chart Panel Shows signal, position, volatility, squeeze status
- Alerts Band t

PhotonAurum Beam – Proprietary Price Pulse Indicator Descriptions PhotonAurum Beam reveals the silent rhythm of price — a proprietary visual intelligence system developed by Bob’s Channel for elite traders who see what others miss. 98% Accuracy!!! Forget lagging indicators and noisy alerts. PhotonAurum Beam silently scans the market in real time, then marks critical turning zones the moment they form — with surgical precision and zero repainting. This isn’t just another signal tool. It’s your
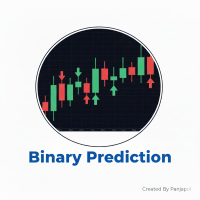
Binary Prediction: The Ultimate Decision Support Tool for Binary Options Traders Binary Prediction is a meticulously developed indicator tailored specifically to meet the demands of Binary Options trading. It is designed to simplify complex market analysis, providing clear, reliable trading signals for both novice and experienced traders looking to enhance their decision-making process. Core Features & Advantages: Dedicated Binary Options Algorithm: The core logic is fine-tuned to capture c

**News Monitor Allert**
Trading the financial markets without being aware of the economic calendar is a critical mistake that leads to unnecessary losses. Even the best technical strategy can fail instantly during a high-impact news release. This utility provides the ultimate solution, acting as a safeguard for your capital.
One of the most powerful features of this indicator is its ease of use. Unlike many other tools on the market, **you do not need to configure any external links, download

The "One-Click" Breakout Monitor Never Miss a Breakout Again. Price Alert Line is designed for traders who need speed and simplicity. Instead of navigating complex menus to set price alerts, this tool places a button directly on your chart. With a single click, you can deploy a horizontal line that monitors price action and alerts you immediately when the price crosses it. New Feature (Smart UI): The control buttons now automatically adapt to match your line colors. If you set your resistance

Edri Extreme Points Buy & Sell A reversal-based entry indicator designed to identify high-probability turning points in the market. How to Use Green arrow (Buy signal): Appears below the candle when conditions favour a potential bullish reversal. Consider entering long positions. Red arrow (Sell signal): Appears above the candle when conditions favour a potential bearish reversal. Consider entering short positions. Optional Mean Reversion Bands Enable this feature in the settings to display dyna
MetaTrader mağazası, geçmiş verilerini kullanarak test ve optimizasyon için alım-satım robotunun ücretsiz demosunu indirebileceğiniz tek mağazadır.
Uygulamaya genel bakışı ve diğer müşterilerin incelemelerini okuyun, doğrudan terminalinize indirin ve satın almadan önce alım-satım robotunu test edin. Yalnızca MetaTrader mağazasında bir uygulamayı tamamen ücretsiz olarak test edebilirsiniz.
Alım-satım fırsatlarını kaçırıyorsunuz:
- Ücretsiz alım-satım uygulamaları
- İşlem kopyalama için 8.000'den fazla sinyal
- Finansal piyasaları keşfetmek için ekonomik haberler
Kayıt
Giriş yap
Gizlilik ve Veri Koruma Politikasını ve MQL5.com Kullanım Şartlarını kabul edersiniz
Hesabınız yoksa, lütfen kaydolun
MQL5.com web sitesine giriş yapmak için çerezlerin kullanımına izin vermelisiniz.
Lütfen tarayıcınızda gerekli ayarı etkinleştirin, aksi takdirde giriş yapamazsınız.