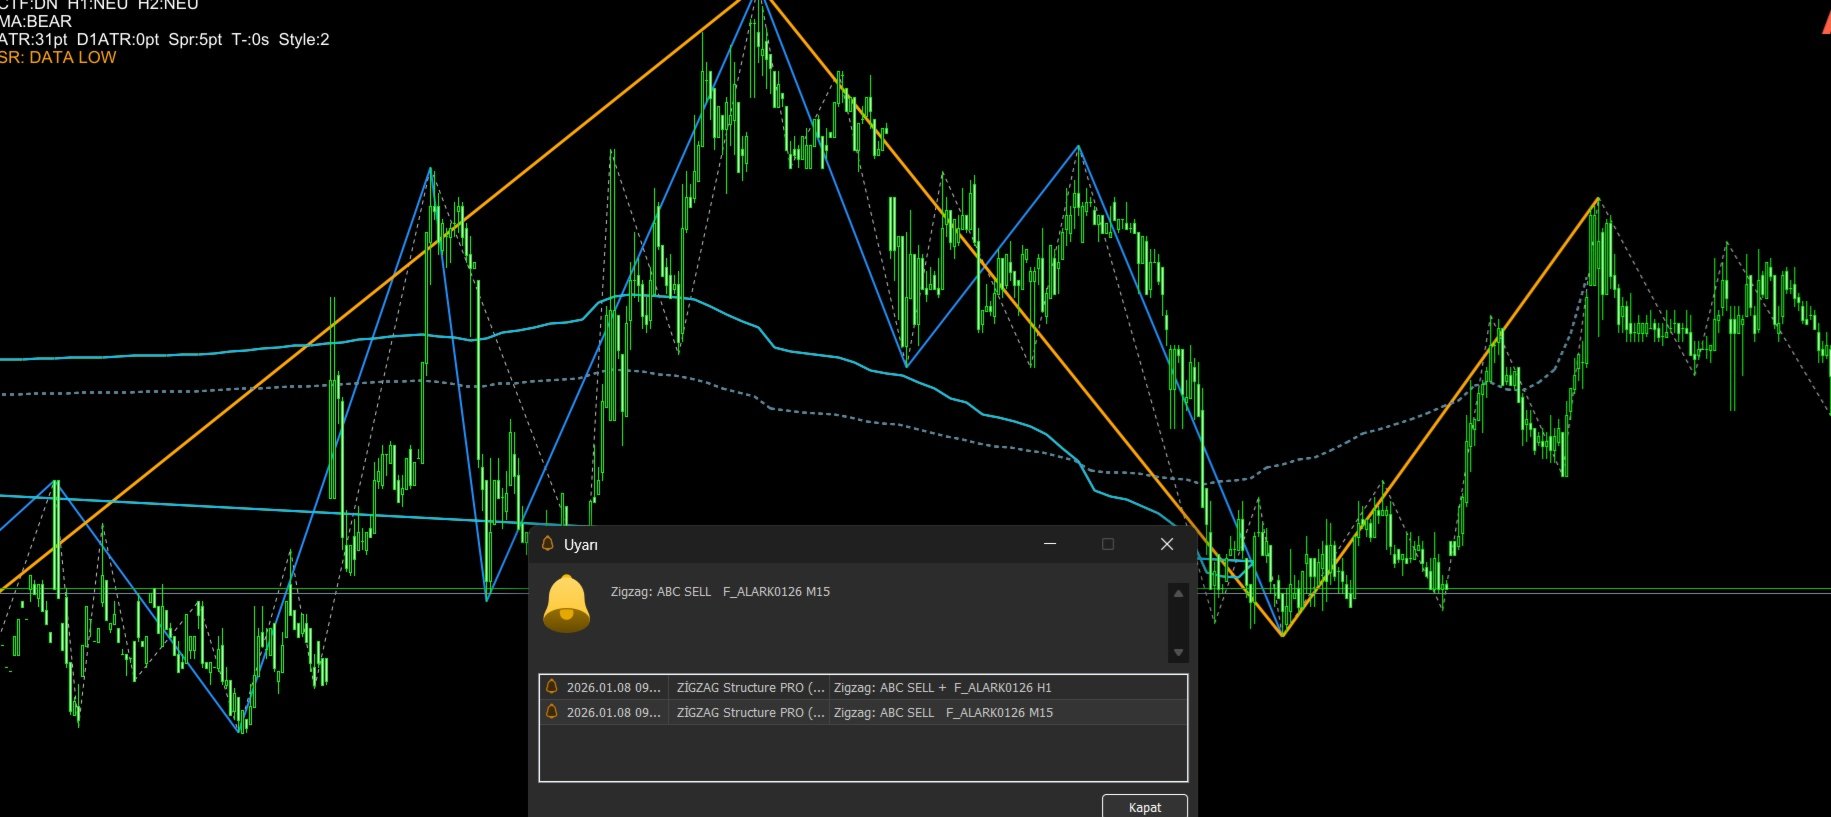
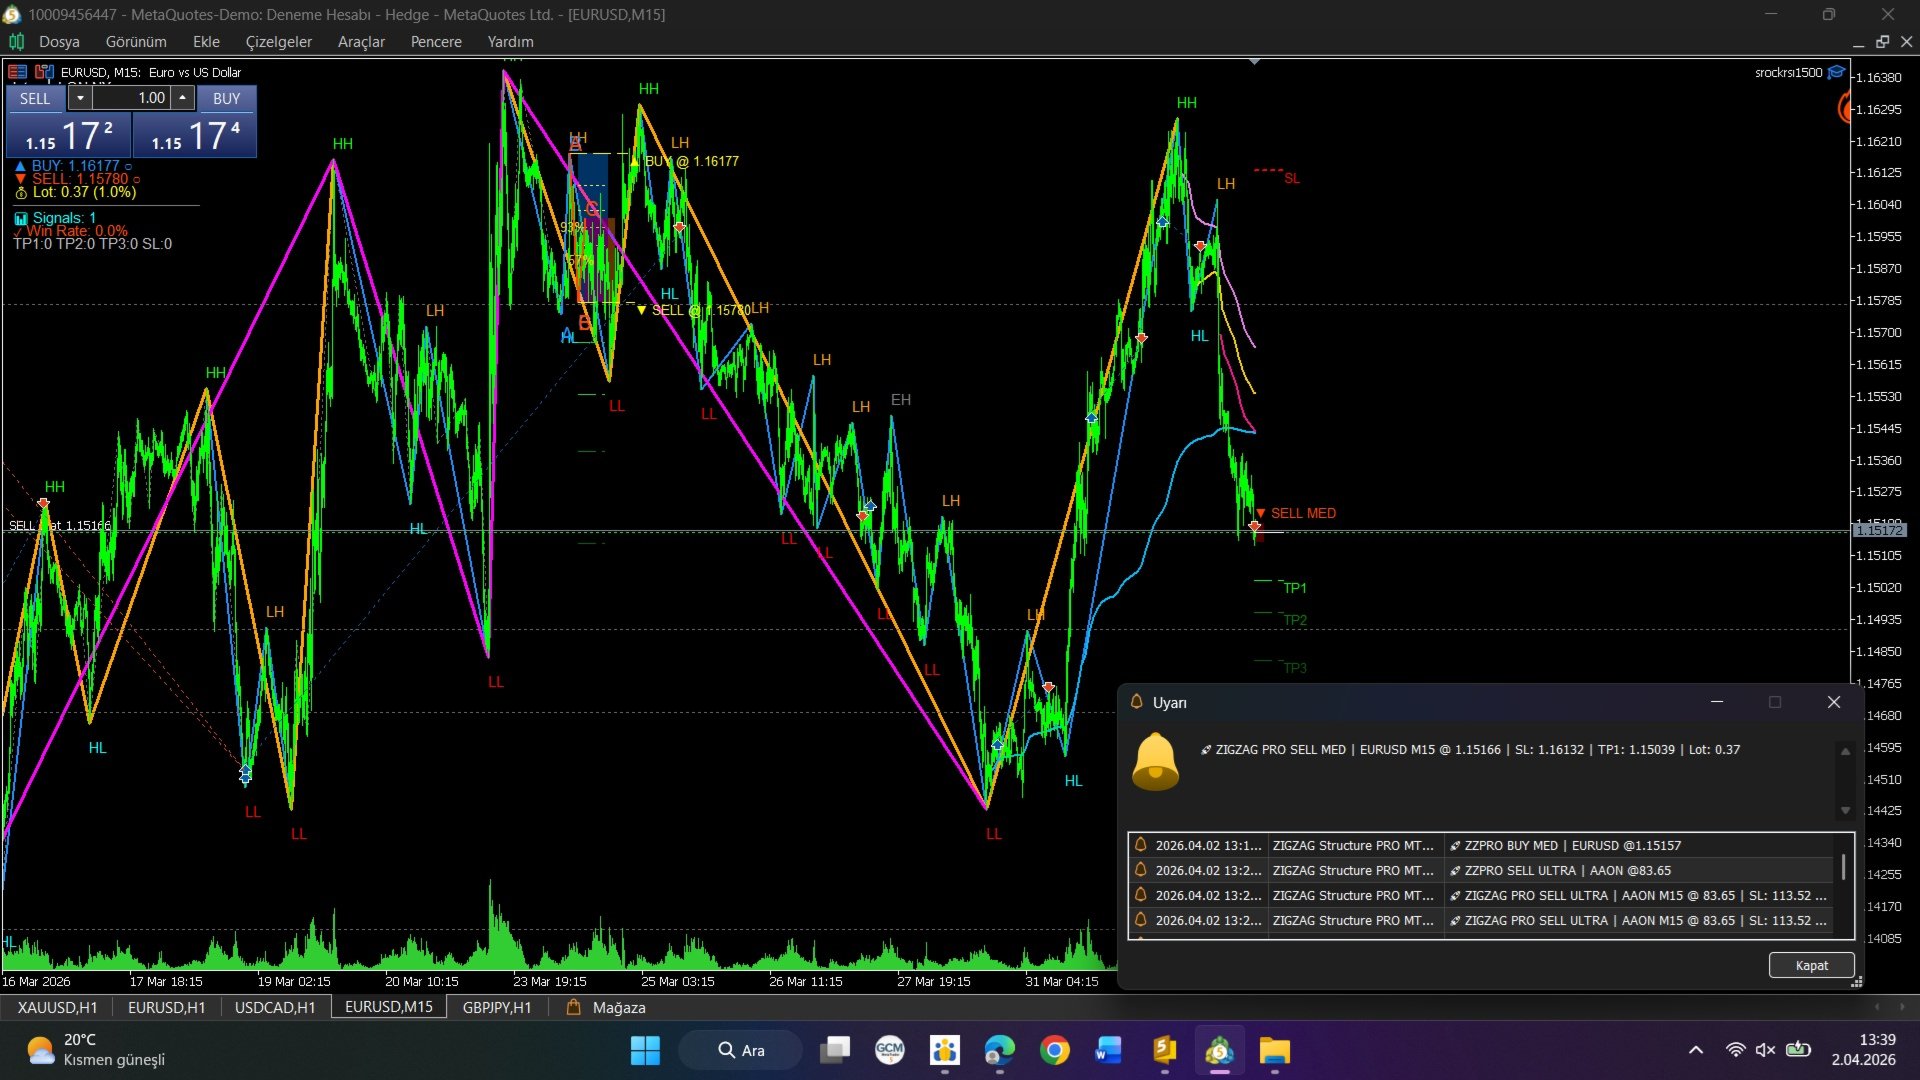
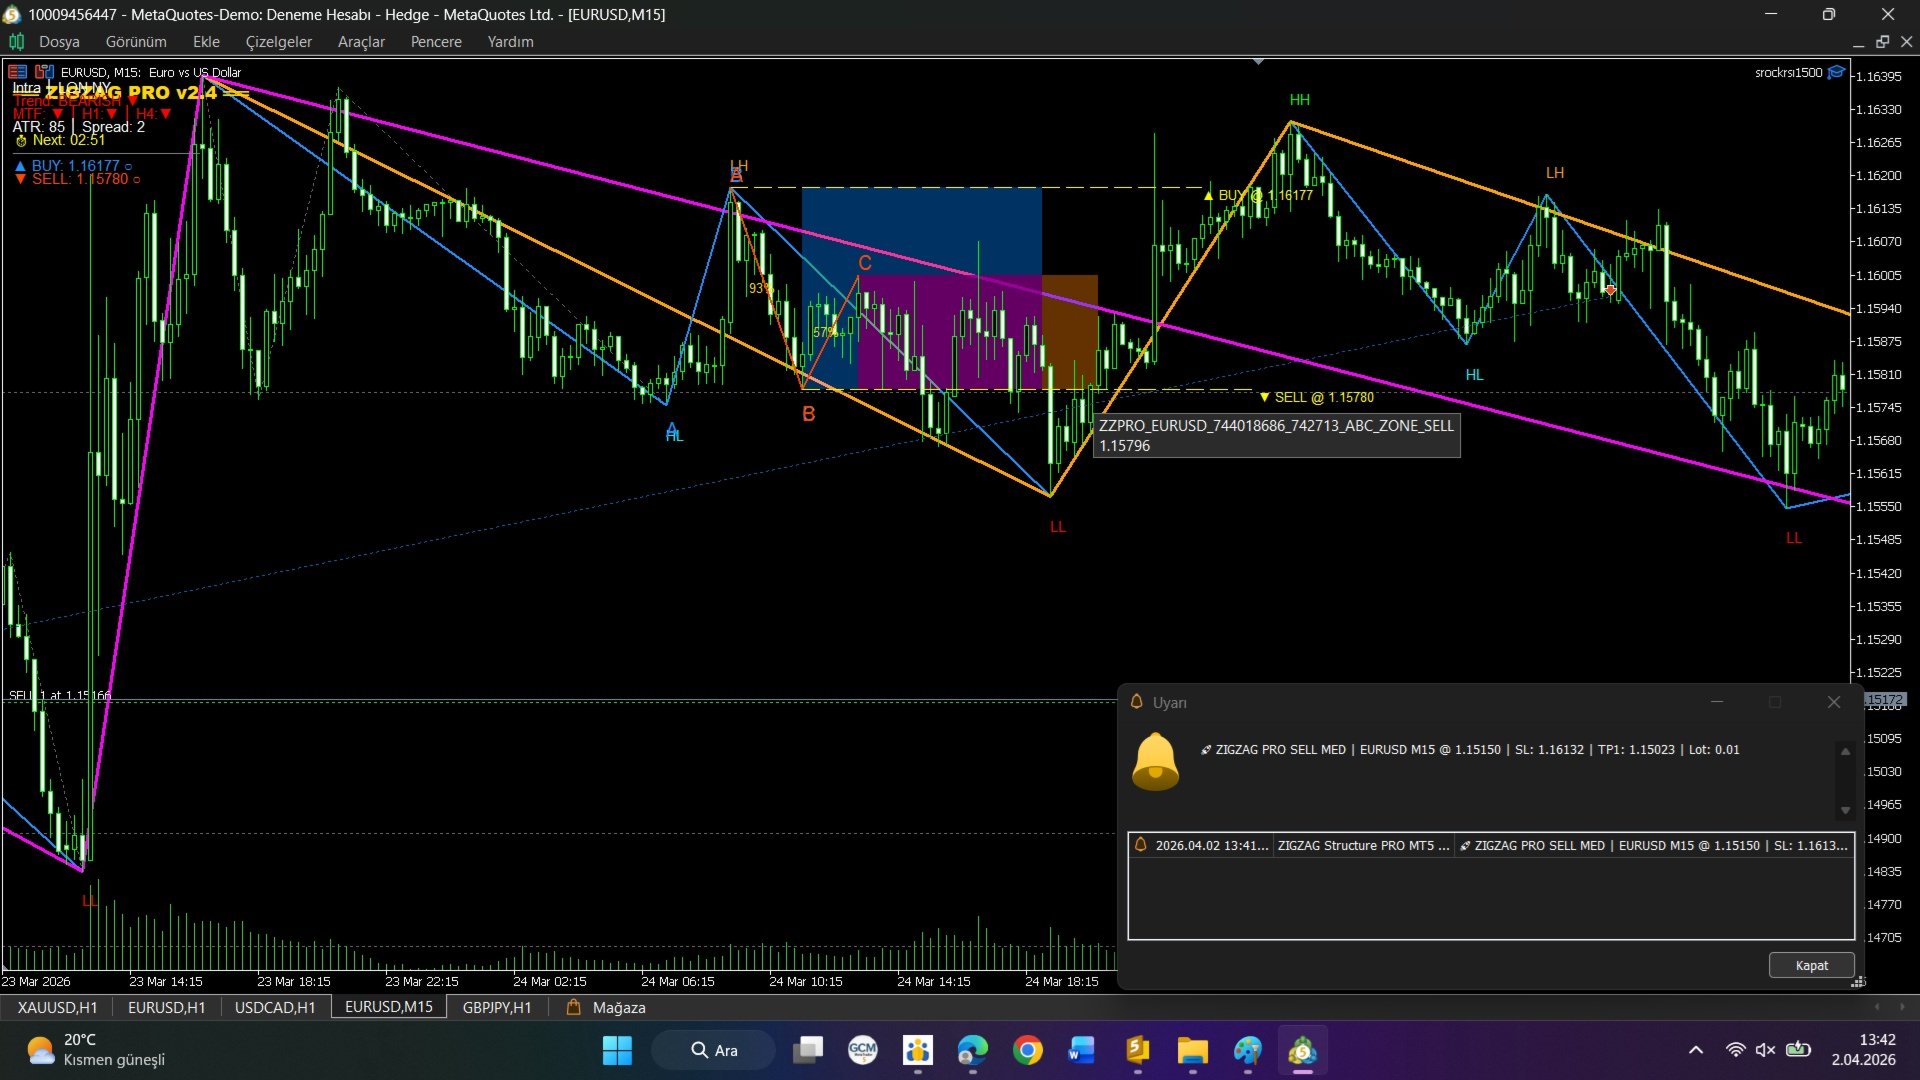
Zigzag Structure

📌 ZİGZAG Structure PRO MT5

Multi-Level Market Structure & VWAP Indicator

🔍 Genel Tanım

ZİGZAG Structure PRO, piyasa yapısını (Market Structure) otomatik olarak analiz eden,
çok seviyeli ZigZag, ABC formasyonu, AVWAP, MTF trend bias, Smart MA filtreleri ve gelişmiş dashboard içeren profesyonel bir Price Action göstergesidir.

Gösterge, manuel işlem yapan trader’lar için net yapı, yüksek performans ve filtrelenebilir sinyaller sunar.

🧠 Temel Analiz Sistemleri

🔹 Çok Seviyeli ZigZag (L1 – L4)

  • 4 ayrı ZigZag seviyesi (L1, L2, L3, L4)

  • Her seviye için ayrı:

    • Depth

    • Deviation (point)

    • Backstep

  • AUTO Trading Style:

    • Scalping

    • Intraday

    • Intraday Week

    • Swing

    • Position

  • Zaman dilimine göre otomatik preset seçimi

  • İsteğe bağlı CUSTOM ayarlar

🔹 Market Structure (Piyasa Yapısı)

  • HH / HL / LH / LL yapıları ZigZag üzerinden tespit edilir

  • Yapı, çok seviyeli trend okumaya uygundur

  • HTF (yüksek zaman dilimi) yapı seviyeleri destek/direnç olarak çizilir

  • Yakın seviyeler otomatik merge edilir (temiz grafik)

🔹 ABC Düzeltme Formasyonu

  • Otomatik ABC pattern algılama

  • A-B-C bacakları minimum swing mesafesi ile filtrelenir

  • B noktası kırıldığında:

    • BUY / SELL okları

    • Grafik üstü metin etiketi

  • Agresif veya muhafazakâr tetikleme modu:

    • Anlık kırılım

    • Mum kapanışı onaylı

📊 AVWAP (Anchored VWAP) Sistemi

  • L2 ve L3 ZigZag pivotlarından otomatik AVWAP

  • LOW ve HIGH anchor seçenekleri

  • AVWAP:

    • Dinamik destek/direnç

    • Mean-reversion & continuation analizi

  • Canlı mumda real-time güncelleme

  • Ghost / eski çizgi kalıntılarını önleyen reset sistemi

📐 MTF Trend Bias (Çok Zaman Dilimi Trend Filtresi)

  • Mevcut zaman dilimi (CTF)

  • H1 ve H4 (isteğe bağlı)

  • EMA eğimi (slope) ile trend yönü:

    • UP / DOWN / NEUTRAL

  • ABC sinyalleri için:

    • Trend uyum filtresi

    • Güç seviyesi göstergesi (+ / ++)

📈 Smart MA Sistemi

İki farklı adaptif ortalama birlikte kullanılır:

🔹 Step MA (ATR tabanlı)

  • ATR’ye göre dinamik adım

  • Volatiliteye uyumlu

🔹 VIDYA (CMO adaptif)

  • Momentum bazlı ağırlıklandırma

  • Yavaşlayan trendleri filtreler

➡️ Smart MA, ABC sinyalleri için opsiyonel yön filtresi olarak çalışır.

🧩 Gelişmiş Filtre Sistemi (Opsiyonel)

Kullanıcı isterse sinyalleri şu filtrelerle sıkılaştırabilir:

  • AVWAP yakınlığı

  • HTF destek/direnç yakınlığı

  • MTF trend uyumu

  • Smart MA yönü

👉 Tüm filtreler aç/kapatılabilir
👉 Varsayılan ayarlar gevşek (oklar görünür)

🚨 Sinyaller ve Uyarılar

  • Grafik üzerinde BUY / SELL okları

  • Metin etiketleri (ABC BUY / SELL)

  • Alert seçenekleri:

    • Popup

    • Ses

    • Push notification

    • E-mail

  • Spam koruması (aynı mumda tekrar sinyal yok)

🖥 Dashboard (Kontrol Paneli)

Gerçek zamanlı bilgi paneli:

  • CTF / H1 / H4 trend durumu

  • Smart MA yönü

  • ATR (güncel)

  • D1 ATR

  • Spread

  • Mum kapanışına kalan süre

  • Aktif trading style

⚡ Performans & Profesyonel Mimari

  • Object delete/redraw YOK → sadece move/update

  • Handle’lar cache edilir

  • HTF yapı sadece yeni HTF mumda hesaplanır

  • AVWAP anchor cache sistemi

  • Maksimum pivot & obje sınırları

  • Aynı grafikte çoklu instance çakışma koruması

👤 Kimler İçin Uygun?

  • Price Action trader’ları

  • Market structure kullananlar

  • ABC + trend continuation stratejisi kullananlar

  • Scalper / intraday / swing trader’lar

  • Manuel işlem + sinyal desteği isteyenler

⚠️ Önemli Bilgi

  • Bu ürün Expert Advisor (EA) değildir

  • Otomatik işlem açmaz

  • Analiz ve karar desteği amaçlıdır

  • Risk yönetimi kullanıcıya aittir

✅ Özet

ZİGZAG Structure PRO,
piyasa yapısını, trend yönünü ve düzeltme formasyonlarını tek bir göstergede,
yüksek performanslı ve profesyonel şekilde sunan ileri seviye bir Market Structure aracıdır.


Önerilen ürünler
WAPV Weis Wave Chart Forex
Eduardo Da Costa Custodio Santos
MT5 için Weis Wave Chart Forex bir Fiyat ve Hacim göstergesidir. Fiyat ve Hacim okuması, Richard Demille Wyckoff tarafından oluşturulan üç yasaya dayalı olarak geniş çapta dağıtıldı: Arz ve Talep, Neden ve Etki ve Çabaya Karşı Sonuç. 1900'de R.Wyckoff, analizlerinde dalga grafiğini zaten kullanmıştı. Yıllar sonra, 1990 civarında, David Weis Otomatikleştirilmiş R. Wyckoff'un dalga grafiği ve bugün size David Weis'in dalga grafiğinin evrimini sunuyoruz. Varlıkta üretilen dalga ile ilgili Hacim mik
Weis Wave Volume Indicator for MetaTrader 5 (MT5) Check all of our products here: All Products Specifications Platform: MetaTrader 5 (MT5) Type: Custom Technical Trading Indicator Level: Intermediate Timeframes: All Timeframes (Multi-Timeframe Support) Trading Styles: Scalping, Day Trading, Swing Trading, Position Trading Markets: Forex, Stocks, Commodities, Indices, and Cryptocurrencies What Does This Indicator Do? The Weis Wave Volume Indicator for MT5 is a powerful Price Action + V
Contact me for instruction, any questions! Introduction V Bottoms and Tops  (or Fibonacci Retracement)  are popular   chart patterns   among traders due to their potential for identifying trend reversals. These patterns are characterized by sharp and sudden price movements, creating a V-shaped or inverted V-shaped formation on the   chart . By recognizing these patterns, traders can anticipate potential shifts in market direction and position themselves accordingly.  V pattern is a powerful bul
The indicator is the advanced form of the MetaTrader 4 standard Fibonacci tool. It is unique and very reasonable for serious Fibonacci traders. Key Features Drawing of Fibonacci retracement and expansion levels in a few seconds by using hotkeys. Auto adjusting of retracement levels once the market makes new highs/lows. Ability to edit/remove any retracement & expansion levels on chart. Auto snap to exact high and low of bars while plotting on chart. Getting very clear charts even though many ret
Introduction to X3 Chart Pattern Scanner X3 Cherart Pattern Scanner is the non-repainting and non-lagging indicator detecting X3 chart patterns including Harmonic pattern, Elliott Wave pattern, X3 patterns, and Japanese Candlestick patterns. Historical patterns match with signal patterns. Hence, you can readily develop the solid trading strategy in your chart. More importantly, this superb pattern scanner can detect the optimal pattern of its kind. In addition, you can switch on and off individu
Wolfe Wave Scanner MT5
Reza Aghajanpour
5 (7)
**  All Symbols  x  All Timeframes  scan just by pressing scanner button ** *** Contact me  to send you instruction and add you in "Wolfe Wave Scanner group" for sharing or seeing experiences with other users. Introduction: A Wolfe Wave is created with five-wave patterns in price. It shows supply and demand and a fight towards a balance price. T hese waves of price actions can help traders identify the boundaries of   the trend . Also  It helps forecast how the price will move in the near futur
Better RSI With Tester
Mohammad Taher Halimi Tabrizi
Category: Trend Indicator Platform: MetaTrader 5 Type: Entry Indicator Timeframes: All Trader Styles: Scalping, Day Trading, Swing Trading, Binary Options Markets: All Description This indicator is an enhanced version of the Relative Strength Index (RSI) with additional features for visual clarity and cycle detection. It is designed to provide traders with a clearer view of momentum conditions and potential turning points. Main features: Improved RSI Visualization – The indicator displays RSI va
Very special indicator of Joe Dinapoli which is a derivative  of a Detrended Oscillator. Through a set of parametric equations, a predicting oscillator is created that forecasts, one period ahead of time, overbought and oversold conditions. The resulting predictor values are expressed as bands on the bar chart, both above and below the market. It may be mistaken as a Bollinger Band but has no resemblance to it whatsoever. The Predictor bands may be used in a variety of ways to aid in entering an
Contact me for instruction, any questions! - Lifetime update free - Non-repaint - I just sell my products in Elif Kaya Profile, any other websites are stolen old versions, So no any new updates or support. Introduction Breakout Trend Scanner indicator works based on the Elliott Wave in technical analysis describes price movements in the financial market that are related to changes in trader sentiment and psychology and finds end of movement and breakout trend. The Elliott Wave pattern that is f
MT5 için Market Structure Break Out'u tanıtıyoruz – Profesyonel MSB ve Unbroken Zone göstergeniz. MT4 versiyonu da mevcut, buradan kontrol edin: https ://www .mql5 .com /en /market /product /109958 Bu gösterge sürekli olarak güncellenmektedir. Piyasadaki yapı temelli giriş ve çıkış noktalarını yüksek doğrulukla sağlamayı amaçlıyoruz. Şu anda 1.1 sürümündeyiz, aşağıda şu anda katılırsanız yapılmış olan son değişiklikler bulunmaktadır: Alış & Satış Hedefleri:   Hem alış hem de satış pozisyonları
The Accumulation / Distribution is an indicator which was essentially designed to measure underlying supply and demand. It accomplishes this by trying to determine whether traders are actually accumulating (buying) or distributing (selling). This indicator should be more accurate than other default MT5 AD indicator for measuring buy/sell pressure by volume, identifying trend change through divergence and calculating Accumulation/Distribution (A/D) level. Application: - Buy/sell pressure: above
SI Bollinger Bantları Ok Stratejisi (RSI Bollinger Bands Arrow Strategy) RSI Bollinger Bantları Ok Stratejisi, RSI ve Bollinger Bantlarının kombinasyonunu kullanarak yüksek olasılıklı dönüş noktalarını belirlemek için tasarlanmış temiz ve etkili bir teknik göstergedir. Bu strateji, RSI göstergesini Bollinger Bantları ile birlikte kullanarak: Fiyat, üst Bollinger Bandının üzerindeyken satar . Fiyat, alt Bollinger Bandının altındayken alır . Sinyaller, yalnızca her iki göstergenin de aynı piyasa k
Rubdfx Fiyat Takibi Fiyat fiyat bağlılığını göstermek için kullanılır, fiyat neredeyse hiç kanal dışına çıkmaz ve çoğu zaman fiyat kanal limitlerine dokunduğunda tepki verir. Satış yapabileceğiniz en yüksek ve en düşük fiyatları belirler. ve sırasıyla satın al Scalping & swing ticareti için uygun Bir mum kapandıktan sonra görünen okları çizer. Oklar, sırasıyla düşüş ve yükseliş eğilimi için yükseliş veya düşüş baskısını gösterir. Bir ok gördüğünüzde, mumun bir okla kapanıp kapanmayacağını gör
Pattern Trader No Repaint Indicator MT5 Version Indicator searches for 123 Pattern, 1234 Pattern, Double Top, Double Bottom Patterns , Head and Shoulders, Inverse Head and Shoulders, ZigZag 1.618 and Father Bat Pattern. Pattern Trader indicator uses Zig Zag Indicator and Improved Fractals to determine the patterns. Targets and Stop Loss Levels are defined by Fibonacci calculations.  Those levels must be taken as a recommendation. The trader may use different tools like Moving Avarages,
"Hunttern harmonic pattern finder" base on the dynamic zigzag with the notification and prediction mode This version of the indicator identifies 11 harmonic patterns and predicts them in real-time before they are completely formed. It offers the ability to calculate the error rate of Zigzag patterns depending on a risk threshold. It moreover sends out a notification once the pattern is complete. The supported patterns: ABCD BAT ALT BAT BUTTERFLY GARTLEY CRAB DEEP CRAB CYPHER SHARK THREE DRIV
The indicator determines the state of the market: trend or flat. The state of the market is determined by taking into account volatility. The flat (trading corridor)is displayed in yellow. The green color shows the upward trend. The red color shows the downward trend. The height of the label corresponds to the volatility in the market. The indicator does not redraw . Settings History_Size   - the amount of history for calculation. Period_Candles  - the number of candles to calculate the indicat
Introduction Harmonic Patterns are best used to predict potential turning point. Traditionally, Harmonic Pattern was identified manually connecting peaks and troughs points in the chart. Manual harmonic pattern detection is painfully tedious and not suitable for everyone. You are often exposed under subjective pattern identification with manual pattern detection. To avoid these limitations, Harmonic Pattern Plus was designed to automate your harmonic pattern detection process. The functionality
This is Gekko's Cutomized Relative Strength Index (RSI), a customized version of the famous RSI indicator. Use the regular RSI and take advantage two entry signals calculations and different ways of being alerted whenever there is potential entry or exit point. Inputs Period: Period for the RSI calculation; How will the indicator calculate entry (swing) signals: 1- Produces Exit Signals for Swings based on RSI entering and leaving Upper and Lower Levels Zones; 2- Produces Entry/Exit Signals for
WAPV Weis Wave Chart MT5
Eduardo Da Costa Custodio Santos
MT5 için Weis Dalga Tablosu bir Fiyat ve Hacim göstergesidir. Fiyat ve Hacim okuması, Richard Demille Wyckoff tarafından oluşturulan üç yasaya dayalı olarak geniş çapta dağıtıldı: Arz ve Talep, Neden ve Etki ve Çabaya Karşı Sonuç. 1900'de R.Wyckoff, analizlerinde dalga grafiğini zaten kullanmıştı. Yıllar sonra, 1990 civarında, David Weis Otomatikleştirilmiş R. Wyckoff'un dalga grafiği ve bugün size David Weis'in dalga grafiğinin evrimini sunuyoruz. Varlıkta üretilen dalga ile ilgili Hacim miktar
Cumulative Volume Delta MAX MTF Pro v3.0 - The Ultimate Volume-Based Trading Edge     One Indicator to Rule Them All: See What the Market REALLY Thinks   Stop guessing - Start knowing what institutional players are doing before price shows you. The CVD MAX MTF Pro indicator represents the pinnacle of volume analysis technology, transforming complex volume data into clear, actionable trading signals across multiple timeframes. This sophisticated tool doesn't just show you volume - it reveals th
SMT (Smart Money Technique) Divergence refers to the price divergence between correlated assets or their relationship to inversely correlated assets.  By analyzing SMT Divergence, traders can gain insights into the market's institutional structure and identify whether smart money is accumulating or distributing assets.  Every price fluctuation should be confirmed by market symmetry, and any price asymmetry indicates an SMT Divergence, suggesting a potential trend reversal. MT4 Version -  https:/
Gekko MACD Plus
Rodrigo Galeote
3 (3)
Type: Oscillator This is Gekko's Cutomized Moving Average Convergence/Divergence (MACD), a customized version of the famous MACD indicator. Use the regular MACD and take advantage of several entry signals calculations and different ways of being alerted whenever there is potential entry point. Inputs Fast MA Period: Period for the MACD's Fast Moving Average (default 12); Slow MA Period: Period for the MACD's Slow Moving Average (default 26); Signal Average Offset Period: Period for the Signal A
Unlock powerful breakout opportunities The 123 Pattern is one of the most popular, powerful and flexible chart patterns. The pattern is made up of three price points: a bottom, a peak or valley, and a Fibonacci retracement between 38.2% and 71.8%. A pattern is considered valid when the price breaks beyond the last peak or valley, moment at which the indicator plots an arrow, rises an alert, and the trade can be placed. [ Installation Guide | Update Guide | Troubleshooting | FAQ | All Products ]
Weis Wave Scouter
Jean Carlos Martins Roso
MetaTrader 5 için geliştirilen Weis Wave Scouter ile gelişmiş hacim analizinin gücünü keşfedin! Bu devrim niteliğindeki gösterge, Wyckoff yönteminin ve Hacim Yayılımı Analizinin (VSA) kanıtlanmış ilkelerini birleştiriyor. Operasyonlarında doğruluk ve derinlik arayan yatırımcılar için tasarlanmıştır ve kümülatif hacim dalgası analizi yoluyla piyasanın taktiksel bir okumasını sunar. Weis Wave Scouter, Classic, NightVision ve OceanBreeze gibi özelleştirilebilir renk temaları ile renkli histogramlar
ATrend
Zaha Feiz
4.82 (17)
ATREND: Nasıl Çalışır ve Nasıl Kullanılır ### Nasıl Çalışır "**ATREND**" göstergesi, MT5 platformu için tasarlanmış olup, traderlara sağlam alım ve satım sinyalleri sağlamak amacıyla teknik analiz metodolojilerinin bir kombinasyonunu kullanır. Bu gösterge, öncelikle volatilite ölçümü için Ortalama Gerçek Aralık (ATR) kullanır ve potansiyel piyasa hareketlerini belirlemek için trend tespit algoritmalarıyla birleştirir. Satın aldıktan sonra bir mesaj bırakın ve özel bir bonus hediyesi kazanın. ##
The   ICT Unicorn Model   indicator highlights the presence of "unicorn" patterns on the user's chart which is derived from the lectures of   "The Inner Circle Trader" (ICT) . Detected patterns are followed by targets with a distance controlled by the user.   USAGE (image 2) At its core, the ICT Unicorn Model relies on two popular concepts, Fair Value Gaps and Breaker Blocks. This combination highlights a future area of support/resistance. A   Bullish Unicorn Pattern   consists out of:
AI Forecast MT5
Leonardo Antonio Camacaro Armas
The "AI Forecast" indicator is the result of a unique experiment in which I asked an AI how to create the best indicator to anticipate the market. The AI suggested measuring the past history of the price and its reactions to different levels, and then calculating the probabilities of the price reaction in the future. With this idea, I designed with the help of another AI the "AI Forecast" indicator, which adapts to any MetaTrader chart and shows you three lines: one for entry and two for possi
Matreshka
Dimitr Trifonov
5 (2)
Matreshka self-testing and self-optimizing indicator: 1. Is an interpretation of the Elliott Wave Analysis Theory. 2. Based on the principle of the indicator type ZigZag, and the waves are based on the principle of interpretation of the theory of DeMark. 3. Filters waves in length and height. 4. Draws up to six levels of ZigZag at the same time, tracking waves of different orders. 5. Marks Pulsed and Recoil Waves. 6. Draws arrows to open positions 7. Draws three channels. 8. Notes support and re
True Weis Wave
Atila Goncalves Firmino
A version based on David Waves' description in his book 'Trade About to Happen' of his adaptation of the Wyckoff wave chart. The indicator directionally accumulates volume, adding to each brick or candle close, with color indication for up and down. it can be used it with tick or real volume, it also changes color when the accumulated value of the previous wave is exceeded, being the trade signal. Yellow color is used for doji candlestick, it will continue with accumulation without zero the sum
The   Fibonacci Confluence Toolkit   is a technical analysis tool designed to help traders identify potential price reversal zones by combining key market signals and patterns. It highlights areas of interest where significant price action or reactions are anticipated, automatically applies Fibonacci retracement levels to outline potential pullback zones, and detects engulfing candle patterns. Its unique strength lies in its reliance solely on price patterns, eliminating the need for user-define
Bu ürünün alıcıları ayrıca şunları da satın alıyor
Azimuth Pro
Ottaviano De Cicco
5 (4)
LAUNCH PROMO Azimuth Pro price is initially set at 299$ for the first 100 buyers. Final price will be 499$ . THE DIFFERENCE BETWEEN RETAIL AND INSTITUTIONAL ENTRIES ISN'T THE INDICATOR — IT'S THE LOCATION. Most traders enter at arbitrary price levels, chasing momentum or reacting to lagging signals. Institutions wait for price to reach structured levels where supply and demand actually shift. Azimuth Pro maps these levels automatically: swing-anchored VWAP, multi-timeframe structure lines, an
RelicusRoad Pro: Kantitatif Piyasa İşletim Sistemi ÖMÜR BOYU ERİŞİMDE %70 İNDİRİM (SINIRLI SÜRE) - 2.000+ TRADER'A KATILIN Neden çoğu trader "mükemmel" indikatörlere rağmen başarısız olur? Çünkü tekil kavramları boşlukta trade ederler. Bağlamı olmayan bir sinyal kumardır. Sürekli kazanmak için KONFLÜANS (UYUM) gerekir. RelicusRoad Pro basit bir ok indikatörü değildir. Tam bir Kantitatif Piyasa Ekosistemi dir. Tescilli volatilite modellemesini kullanarak fiyatın ilerlediği "Adil Değer Yolu"nu har
ARIPoint
Temirlan Kdyrkhan
ARIPoint is a powerful trading companion designed to generate high-probability entry signals with dynamic TP/SL/DP levels based on volatility. Built-in performance tracking shows win/loss stats, PP1/PP2 hits, and success rates all updated live. Key Features: Buy/Sell signals with adaptive volatility bands Real-time TP/SL/DP levels based on ATR Built-in MA Filter with optional ATR/StdDev volatility Performance stats panel (Success, Profit/Loss, PP1/PP2) Alerts via popup, sound, push, or email Cu
" Dynamic Scalper System MT5 " göstergesi, trend dalgaları içinde işlem yapmak için scalping yöntemi için tasarlanmıştır. Başlıca döviz çiftleri ve altın üzerinde test edilmiştir, diğer işlem araçlarıyla uyumluluğu mümkündür. Ek fiyat hareketi desteğiyle trend boyunca pozisyonların kısa vadeli açılması için sinyaller sağlar. Göstergenin prensibi. Büyük oklar trend yönünü belirler. Küçük oklar şeklinde scalping için sinyaller üreten bir algoritma trend dalgaları içinde çalışır. Kırmızı oklar yü
TrendMaestro5
Stefano Frisetti
note: this indicator is for METATRADER4, if you want the version for METATRADER5 this is the link:  https://www.mql5.com/it/market/product/108106 TRENDMAESTRO ver 2.5 TRENDMAESTRO recognizes a new TREND from the start, he never makes mistakes. The certainty of identifying a new TREND is priceless. DESCRIPTION TRENDMAESTRO identifies a new TREND in the bud, this indicator examines the volatility, volumes and momentum to identify the moment in which there is an explosion of one or more of these da
Öncelikle, bu Ticaret Aracının Non-Repainting, Non-Redrawing ve Non-Lagging Gösterge olduğunu vurgulamakta fayda var, bu da onu profesyonel ticaret için ideal hale getiriyor. Çevrimiçi kurs, kullanıcı kılavuzu ve demo. Akıllı Fiyat Hareketi Kavramları Göstergesi, hem yeni hem de deneyimli tüccarlar için çok güçlü bir araçtır. İleri ticaret fikirlerini, Inner Circle Trader Analizi ve Smart Money Concepts Ticaret Stratejileri gibi 20'den fazla kullanışlı göstergeyi bir araya getirerek bir araya
The Institutional Secret Method  represents a paradigm shift in market analysis, moving away from lagging indicators and into the realm of Topological Finance . It is engineered to decode the hidden geometry of price movement by calculating the most efficient path—the Geodesic —between current price action and institutional liquidity targets. The system views the market as a physical landscape where price is naturally drawn toward massive pools of liquidity (Stops). It uses two primary calculati
Göstergemiz, piyasada ilgi gösterilen bölgeleri vurgular ve ardından emir birikim bölgelerini gösterir. Büyük ölçekli bir emir defteri (order book) gibi çalışır. Bu, büyük sermaye için geliştirilmiş bir göstergedir. Performansı olağanüstüdür. Piyasada ne tür bir ilgi olursa olsun, onu görürsünüz . (Bu, tamamen yeniden yazılmış ve otomatikleştirilmiş bir versiyondur – artık manuel analiz gerekmez.) İşlem Hızı (Transaction Speed) , piyasada büyük emirlerin nerede ve ne zaman biriktiğini gösteren v
ARIScalping
Temirlan Kdyrkhan
ARIScalp is a powerful trading companion designed to generate high-probability entry signals with dynamic TP/SL/DP levels based on volatility. Built-in performance tracking shows win/loss stats, PP1/PP2 hits, and success rates all updated live. Key Features: Buy/Sell signals with adaptive volatility bands Real-time TP/SL/DP levels based on ATR Built-in MA Filter with optional ATR/StdDev volatility Performance stats panel (Success, Profit/Loss, PP1/PP2) Alerts via popup, sound, push, or email Cus
Weis Wave with Alert MT5
Trade The Volume Waves Single Member P.C.
4.94 (17)
Rental/Lifetime Package Options and Privileges  Rent Monthly Six Months   Yearly/Lifetime Weis Wave with Speed with Alert+Speed Index x x x Manual  x x x Quick Set up Video x x x Blog x x x Lifetime Updates x x x Setup and Training Material x x Discord Access Channel "The SI traders"          x Rectangle Break Alert Tool      x How to trade with it:    http://www.tradethevolumewaves.com   ** If you purchase please contact me to setup your  : Training Room and  complete manual access.  Wei
Jita Indicator Pro MT5 | All Timeframes Professional Trend Agreement System – Premium Edition ($500) What Is Jita Indicator Pro? Jita Indicator Pro is a structured trend-confirmation system designed for serious traders who value precision, alignment, and controlled signal behavior. It combines: Advanced band-based trend direction logic ATR-driven structural trigger engine Dual-confirmation agreement system Locked history update design This indicator prints signals only when multiple conditions
Pointer Trend Switch — precision trend reversal indicator Pointer Trend Switch is a high-precision arrow indicator designed to detect key moments of trend reversal based on asymmetric price behavior within a selected range of bars. It identifies localized price impulses by analyzing how far price deviates from the opening level, helping traders find accurate entry points before a trend visibly shifts. This indicator is ideal for scalping, intraday strategies, and swing trading, and performs equa
IVISTscalp5
Vadym Zhukovskyi
5 (6)
What's new about iVISTscalp5 forecast indicator (Version 10)? iVISTscalp5 is a unique nonlinear forecasting for a week ahead system for any financial instrument which executes fast scalping using time levels. iVISTscalp5 is a tool for easy study and understanding of financial market. 1) iVISTscalp5 forecast indicator has been completely rewritten into another programming language (C++), which has accelerated data loading and processing. As a result, a different graphical display of forecasts
Rtc ML Ai Predictor
Muhammad Faisal Sagala
Rtc ML Ai | Predictor CORE MACHINE LEARNING ENGINE Adaptive ML Market Predictor – Multi-Bar Trend & Candle Forecast What This Indicator Does This indicator is a  real-time market prediction engine  designed to analyze price behavior and estimate  future market tendencies . Unlike conventional indicators, this system  does not rely on static parameters or historical curve-fitting , but adapts its internal state dynamically during live market operation. Instead of using static rules, the indic
ÜCRETSİZ AUX Göstergesini, EA desteğini ve tam kılavuzu alın, lütfen ziyaret edin – https://www.mql5.com/en/blogs/post/763955 Trend'i Belirle. Deseni Oku. Girişi Zamanla. 30 Saniyede 3 Adım! Kolayca işlem yapın — analiz gerektirmez, Akıllı yardımcınız iş akışınızı basitleştirmeye hazır Artık grafik yüklemesi yok. Akıllı yönelim tespiti ile güvenle işlem yapın. Tüm para birimleri, kripto, hisse senetleri, metaller, endeksler ve herhangi bir zaman dilimi ile uyumludur. Sadece tıklayın ve yürütün
Recommended TimeFrame >= H1. 100% Non Repainted at any moment.  Use it carefully, only with Trend Direction. Trading Usage: 2 Variants: as Range System or as BreakOut System (Both Only With Trend Direction)::: (Always use StopLoss for minimise Risk); [1] as Range System: (Recommended) in UP TREND:  - BUY in Blue Line , then if price goes down by 50 points (on H1) open Second BUY.   Close in any Profit you wish: TrailingStop(45 points) or Close when Price touches upper Gold Line. in DOWN TREND
Elliott Wave Trend was designed for the scientific wave counting. This tool focuses to get rid of the vagueness of the classic Elliott Wave Counting using the guideline from the template and pattern approach. In doing so, firstly Elliott Wave Trend offers the template for your wave counting. Secondly, it offers Wave Structural Score to assist to identify accurate wave formation. It offers both impulse wave Structural Score and corrective wave Structure Score. Structural Score is the rating to sh
MT4 / MT5 için Astronomi Göstergesini Tanıtıyoruz: En İleri Göksel Ticaret Arkadaşınız Ticaret deneyiminizi göksel seviyelere yükseltmeye hazır mısınız? MT4 için devrim niteliğindeki Astronomi Göstergemizi arayın. Bu yenilikçi araç karmaşık algoritmaları kullanarak eşsiz astronomik içgörüler ve hassas hesaplamalar sunmak için geleneksel ticaret göstergelerini aşmaktadır. Bilgi Evreni Parmaklarınızın Ucunda:   Göksel verilerin hazinelerini açığa çıkaran kapsamlı bir paneli gözlemleyin. Gezegenl
Piranha version 2
Maria Strudov
5 (1)
"Piranha" - an autonomous trading system that determines overbought and oversold levels on the chart. Red and blue zones represent overbought and oversold levels respectively. Entry points are marked with arrows: a downward arrow in the red zone for "sell" and an upward arrow in the blue zone for "buy". The Take profit level is indicated by the green moving average. Key features: Adjusting the Take profit level as the green moving average changes position. Averaging ability when a new market e
Prices move for many reasons and these can vary from one operator to another: software, private and institutional traders simultaneously contribute to the formation of the price, making predictive art very difficult. However, there are measurable factors that bind the price to an underlying trend in line with the physical reality that the financial asset represents: these are the macroeconomic indicators. Large investors use this information wisely to set their strategies. Understanding these m
WARNING: This indicator is distributed EXCLUSIVELY on MQL5.com MT4 version:   https://www.mql5.com/it/market/product/160363 MT5 version:   https://www.mql5.com/it/market/product/160410 ============================================================================================= MAX RIBBON ver 1.00 The indicator that shows you the TREND clearly and unambiguously! ============================================================================================= DESCRIPTION MAX RIBBON is an advanced tre
The iChannels
BeeXXI Corporation
5 (2)
Ultra-fast recognition of parabolic channels (as well as linear, horizontal and wavy channels) throughout the depth of history, creating a hierarchy of channels. Required setting: Max bars in chart: Unlimited This indicator is designed primarily for algorithmic trading, but can also be used for manual trading.  This indicator will have a very active evolution in the near future and detailed descriptions on how to apply to create robots
AlgoEAs Trend Dashboard V1 Indicator for MT5 Introduction: This is a Dashboard Indicator based on 7 built in Multi Timeframe indicators. This strategy gives Buy/Sell Ideas based on 9 trend states. Easy to view gas guage to view current trend. Has as optional Alerts to enable with 9 messages. Run on M15 chart, with M15, H1, and H4 indicator time frames. Great tool! Features: Non-Repainting Dashboard For Desktop MT5 Only, Works On Any Mt5 Pair Great for Intraday and Swing Trading Easy view gas
[ MT4 Version ]  [ Kill Zones ]  [ SMT Divergences ] How to trade using Order Blocks:  Click here User Interface Performance:  During testing in the strategy tester, the UI may experience lag. Rest assured, this issue is specific to the testing environment and does not affect the indicator's performance in live trading. Elevate your trading strategy with the  Order Blocks ICT Multi TF  indicator, a cutting-edge tool designed to enhance your trading decisions through advanced order block analysis
IQ FX Gann Levels a precision trading indicator based on W.D. Gann’s square root methods . It plots real-time, non-repainting support and resistance levels to help traders confidently spot intraday and scalping opportunities with high accuracy. William Delbert Gann (W.D. Gann) was an exceptional market analyst, whose trading technique was based on a complex blend of mathematics, geometry, astrology, and ancient mathematics which proved to be extremely accurate. Setup & Guide:  Download  MT4 Ver
MATADOR SILVER – XAGUSD MT5 M5 Timeframe Scalp Signals MATADOR SILVER   is a professional   signal and decision-support indicator   developed specifically for   XAGUSD (Silver)   scalping on the   M5 timeframe , designed for real market conditions and disciplined execution. This indicator   does NOT open, manage, or close trades automatically . It provides   structured BUY & SELL signals , intelligent filtering, and alerts, allowing traders to execute trades using their   own strategy and risk
WVAP Scalping
Domantas Juodenis
VWAP Scalping Pro – Advanced VWAP & Market Profile System Professional-Grade VWAP + Market Profile Technology for Precision Trading VWAP Scalping Pro is an advanced analytical tool that integrates Volume-Weighted Average Price (VWAP) analysis with professional Market Profile visualization. It provides traders with institutional-style insights into price structure, volume distribution, and session dynamics — ideal for scalping, intraday, and swing trading strategies. Key Features Triple VWAP St
+++++++++++++++++++++++++++++++++++++++++++++++++++++++++++++++++++++++++++++++++++++++++++++++++ +++ Link to EURUSD Only Free Version -->  https://www.mql5.com/en/market/product/156904?source=Unknown +++++++++++++++++++++++++++++++++++++++++++++++++++++++++++++++++++++++++++++++++++++++++++++++++ Hallo Trader, This is a traditional GANN & FIBONACCI strategy based on detection of an impulsive move in the opposite direction. This is called a Breakout. At the moment of Breakout, the indicator draw
Big Player Range
Thalles Nascimento De Carvalho
5 (3)
BigPlayerRange – MT5 için En İyi Gösterge BigPlayerRange , MetaTrader 5 üzerinde Mini Endeks ve Mini Dolar için en iyi gösterge olarak kabul edilir. Bu güçlü araç, büyük oyuncuların stratejik faaliyet alanlarını vurgulayarak kurumsal teknik analizde yüksek hassasiyet sunar. BigPlayerRange Nasıl Kullanılır: Gösterge, alış bölgelerini (yeşil çizgi) ve satış bölgelerini (kırmızı çizgi) gösterir. Fiyat bu alanların dışına kapandığında trend oluşma olasılığı yüksektir. Yeşil çizginin üzerinde
Historical Similarity Matcher Indicator (HI.SI.MA) Try it free today — demo version now available!   https://www.mql5.com/en/market/product/167114 Overview The Historical Similarity Matcher is a technical analysis indicator for MetaTrader 5. It scans historical price data to find segments that show statistical similarity to a user-selected reference period on the chart.
Filtrele:
İnceleme yok
İncelemeye yanıt