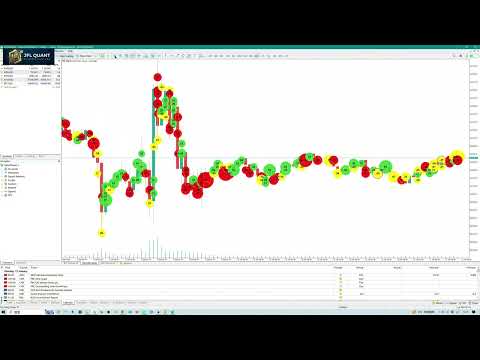
Orderflow Smart Flip
- Göstergeler
- Sürüm: 2.6
- Güncellendi: 9 Ocak 2026
- Etkinleştirmeler: 5

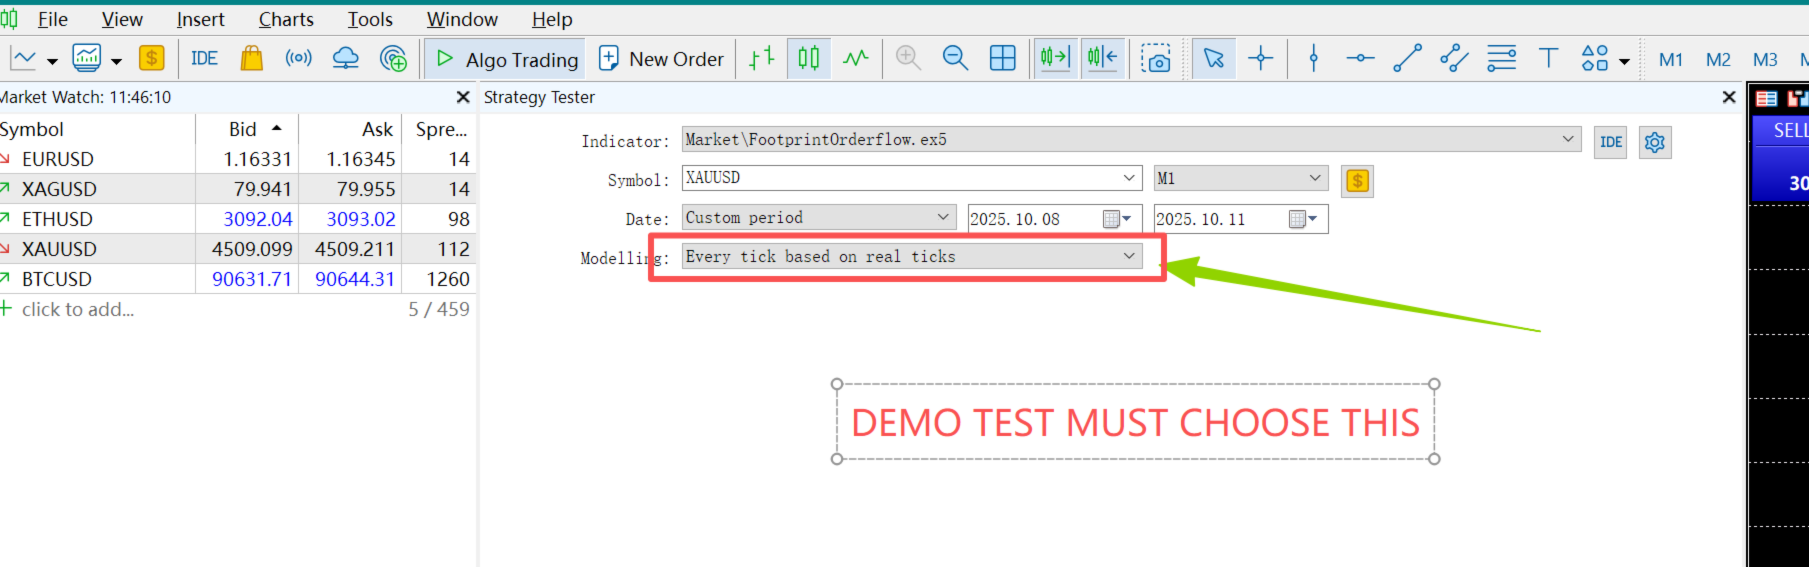
Orderflow Smart Flip (DEMO version,modleling must choose " Every tick based on real ticks")
— Insight into Institutional Footprints, Capturing Reversals, Making Every Line Data-Driven.
Important notice: Before placing an order, please contact me first, and I will provide you with professional answers and services
Product Introduction
Say Goodbye to Guesswork. Embrace the Data Truth.[The last two screenshots show scenarios where the OrderFlow Bubbles Pro indicator is used in combination.]
Orderflow Smart Flip is not just another drawing tool; it is an institutional behavior analysis system built on Tick-level microscopic data. Acting like an X-ray for the market, it penetrates the surface of candlesticks. By calculating Volume Accumulation and Order Imbalance tick-by-tick in real-time, it automatically identifies key price levels where institutional money is heavily defending positions(Support level, resistance level).
It doesn't just tell you where support and resistance are; it features a proprietary "Smart Flip" algorithm. When a key level is effectively breached, the indicator automatically changes the line's color and extends it, signaling that former resistance has transformed into strong support (S/R Flip).
Combined with exclusive "Fakeout Filtering" and "Absorption Detection" features, it helps you filter out the vast majority of market noise, bull traps, and bear traps.
Don't just look at the chart; understand the money behind the chart.
Core Feature Highlights
-
Automatic Identification of Institutional Key Levels
-
Based on tick data, the indicator dynamically calculates the local average volume. It automatically captures "Big Order Nodes" where trading volume is several times higher than the average. Only walls built with real money constitute true support and resistance.
-
-
Smart S/R Flip (Support/Resistance Interchange)
-
Dynamic State Machine: No more dead static lines! When the price is below the line, it shows as Red (Resistance). Once strongly broken and stabilized, the line instantly transforms into Gold (Support), precisely indicating opportunities for pullback entries.
-
Volume Thresholds: Built-in grading mechanism. Only when a strong resistance (with massive volume turnover) is broken will a Flip signal be triggered. Weak and invalid lines are automatically culled.
-
-
Fakeout Filtering System
-
Live Edge Protection: When a candlestick just pierces a key level, the indicator won't immediately misjudge it as a reversal. Instead, it initiates an "Observation Period" (default: 3 bars).
-
Close Price Confirmation: If the price merely spikes through (wick) and quickly reclaims the level, the indicator judges it as a "Test" rather than a "Breakout." The line color remains unchanged, helping you avoid "Liquidity Hunts."
-
-
Real-Time Volume Accumulation
-
Snowball Data Recording: The text labels on the lines show not just the volume at the moment of creation, but the real-time cumulative volume of that price zone over its entire lifespan. As the level is tested repeatedly, you will see the volume data grow, visually displaying the "thickness" of the level.
-
-
Absorption Detection
-
When massive aggressive buy orders attack a resistance level, but the price fails to rise (close price cannot break through), the indicator marks the spot with Cyan Borders and Dots. This indicates that sellers are passively "absorbing" the buying pressure via limit orders—an excellent reversal signal.
-
-
Visual Denoising & Layer Management
-
Auto-Fade: Once a key level is thoroughly invalidated, the line's opacity is automatically reduced by 50%. It remains as a historical reference but ensures it does not distract from the current market view.
-
Smart Avoidance: Text labels automatically calculate center positions and intelligently detect overlaps, ensuring a clean and organized chart.
-
Parameter Guide & Configuration
The parameters are divided into five sections to meet needs ranging from high-frequency scalping to swing trading.
1. Core Strategy
Determines "Which lines get drawn."
-
InpVolMultiplier (Default: 2.0): Sensitivity Switch.
-
Meaning: A line is generated only when the volume at a specific price > (Local Average Volume x This Multiplier).
-
Usage: Lower values = More lines (for Scalping); Higher values (e.g., 3.0+) = Only core major levels (for Swing).
-
-
InpLocalAvgRange (Default: 5): Adaptive Range.
-
Meaning: The number of bars before and after the current bar used to calculate the average volume.
-
Usage: Keep default. It ensures accurate identification of relative big orders during both quiet sessions (Asian) and active sessions (US).
-
-
InpDetectAbsorb (Default: true): Absorption Detection Switch.
-
If enabled, failed attacks with high volume will be highlighted with Cyan dots and borders.
-
2. Flip Filtering
Determines "Which lines qualify for S/R interchange."
-
InpEnableFlip (Default: true): Core Switch. When enabled, Resistance turns to Support, and Support turns to Resistance.
-
InpFlipVolMultiplier (Default: 4.0): Flip Threshold.
-
Important: To prevent chart clutter, it is recommended to set this value higher than InpVolMultiplier .
-
Logic: Only very strong resistance (e.g., volume is 4x the average) qualifies to generate a Flip line upon breakout. Weak resistance simply terminates upon breakout.
-
3. Breakout Confirmation
Determines "How to distinguish between a True Breakout and a Fakeout."
-
InpBreakoutConfirmBars (Default: 3): Confirmation Period.
-
Meaning: After the price crosses a line, it must not return for the next 3 bars to be confirmed as a true breakout and trigger a color change.
-
Usage: Set to 0 for instant color change (High Risk); Set to 2-4 for Robust Mode.
-
-
InpUseVolFilter (Default: true): Volume Filter.
-
Meaning: If the breakout occurs on low volume, it is treated as a Fakeout, and the line does not change color.
-
4. Colors & Style
-
InpColorSup / InpColorRes: Colors for original Support (Green) and Resistance (Red).
-
InpColorFlipBuy (Default: Gold): Resistance turned Support. Seeing a Gold line means a buying opportunity on a pullback after a main force breakout.
-
InpColorFlipSell (Default: Dark Orange): Support turned Resistance.
-
InpOpacity (Default: 160): Opacity for active lines.
-
InpOpacityBroken (Default: 40): Opacity for Invalid Lines. Broken lines become very faint, serving only as history.
5. Common Configuration Examples
Scenario A: Intraday Scalping
-
Goal: See more micro-structures, fast reaction.
-
Config:
-
InpVolMultiplier = 1.5
-
InpFlipVolMultiplier = 2.5
-
InpBreakoutConfirmBars = 1 (Fast confirmation)
-
Scenario B: Swing Trading (Recommended Default)
-
Goal: Filter noise, catch pullbacks in major trends.
-
Config:
-
InpVolMultiplier = 2.5
-
InpFlipVolMultiplier = 5.0 (Only strong flips)
-
InpBreakoutConfirmBars = 3
-
How to Read the Chart
-
Green Solid Bar: Strong Support below current price.
-
Action: Look for long entries on pullbacks.
-
-
Red Solid Bar: Strong Resistance above current price.
-
Action: Look for short entries on rallies.
-
-
Golden Bar (Flip Buy): Golden Opportunity.
-
Original Red resistance was broken by a solid bullish candle and confirmed without falling back. It transforms into Gold.
-
Meaning: Bulls are extremely strong. A pullback to the Gold zone is a high-probability trend-following buy point.
-
-
Cyan Dot/Border (Absorption):
-
Price touches a line and a Cyan marker appears.
-
Meaning: If absorption appears at Resistance, expect a drop. If absorption appears at Support, expect a rise.
-
-
Text Labels:
-
Vol: 5000 : Cumulative volume traded at this price zone is 5000 lots.
-
Delta: 800 : (Aggressive Buy - Aggressive Sell) = 800, indicating strong buying pressure.
-
Installation & Notes
-
Data Requirement: This indicator calculates based on Tick data.
-
On the first load, the indicator needs to download historical Tick data. Depending on your internet speed, this may take a few seconds to a minute. Please wait for the progress status on the screen.
-
It is recommended to use a broker that provides real Tick data (ECN accounts are preferred).
-
-
Chart Settings: It is suggested to uncheck "Chart on foreground" in your chart properties, or rely on the indicator's built-in dual-layer technology for the best visual experience.
-
Timeframe Switching: The indicator has a built-in data synchronization protection mechanism. When switching timeframes (e.g., from M5 to H1), the indicator automatically resets and recalculates the local averages for the new timeframe to ensure data accuracy.


This is a genius product! Its operational logic is completely different from similar indicators, based on order flow footprint charts. The algorithm is ingenious, and the judgment of support and resistance is very accurate. The developer's support is excellent. This is the third indicator I have purchased from this developer, and I strongly recommend it!