YouTube'dan Mağaza ile ilgili eğitici videoları izleyin
Bir alım-satım robotu veya gösterge nasıl satın alınır?
Uzman Danışmanınızı
sanal sunucuda çalıştırın
sanal sunucuda çalıştırın
Satın almadan önce göstergeyi/alım-satım robotunu test edin
Mağazada kazanç sağlamak ister misiniz?
Satış için bir ürün nasıl sunulur?
MetaTrader 5 için yeni teknik göstergeler - 18

This indicator is a hybrid SMC + Trend + Oscillator tool that draws market-structure objects on the chart and also plots trend shift lines + arrows and a colored oscillator histogram.
It includes these modules:
Phantom Shift (ATR trend shift / trailing bands)
Swing Structure (BOS/CHoCH + swing points)
Internal Structure (iBOS/iCHoCH)
Order Blocks (swing + internal)
Equal Highs / Equal Lows (EQH / EQL)
Fair Value Gaps (FVG)
Premium / Discount zones (range zones)
Phantom Oscillator (MA
FREE

Multi Signal Radar 2.0 – BUY SELL Signal Indicator MT4 MT5 (Non-Repaint) Clean, Confidence-Based BUY & SELL Signals Multi Signal Radar 2.0 is a clean and intelligent trading signal indicator designed to highlight high-probability BUY and SELL opportunities without cluttering your chart. All calculations are performed internally, while the chart remains minimal — only arrows, a real-time confidence dashboard, and a candle countdown timer are displayed .
This makes Multi Signal Radar ideal fo

ESTruePivot – Advanced Pivot & Fractal Noise Filter ESTruePivot is a next-generation pivot detection engine designed to identify true market turning points with exceptional precision. It removes weak fractals, filters chart noise, and highlights only the most meaningful peaks and bottoms — making it ideal for professional price-action and structural analysis. Unlike traditional fractal indicators or ZigZag tools, ESTruePivot uses an advanced smart-replacement algorithm that continuously evaluate
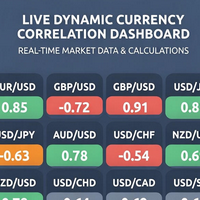
Live Dynamic Currency Correlation Dashboard Stop Trading Blind. See Live Market Correlations in Real-Time. The most advanced correlation tool for MetaTrader 5. Calculate live correlations from actual market data. Click any pair to open its chart instantly. Make smarter trading decisions with real-time insights. Why This Changes Everything Traditional correlation tools show outdated historical data. This dashboard calculates correlations live from your broker's price feed every 5 minutes. Watc

Overview:
This is a trend-following "Sell Only" scalping indicator designed for high-volatility markets (like Synthetic Indices). It identifies strong downtrends and looks for overbought spikes (exhaustion) to trigger immediate sell entries. Works best on Crash 300 Market 5M. 1. Indicator Settings: 2 0-period Exponential Moving Average (EMA) . Min bars between arrows: 1. The rest of the settings leave as default 2. Trade Management:
Stop Loss level : (Default: 20,000 points above entry).

RED ZONE Monitor Loss-Cut & Break-Even Risk Monitor for Averaging Traders (MT5) RED ZONE Monitor is a risk management indicator for traders who use
averaging, scaling-in, or multiple open positions . It visually displays: The loss-cut (liquidation) risk zone The break-even price Based on current open positions, lots, and margin conditions This indicator does not provide entry signals.
It does not promise profits. It shows where your account actually fails if price moves against you. What RED ZO

Indicator Description: 5 EMA with Ichimoku-like Color Filling is a technical analysis indicator for MetaTrader 5 that combines five Exponential Moving Averages (EMAs) with visual fill areas similar to the Ichimoku Cloud concept. Key Features: Five EMA Lines : EMA1 (13-period): Fastest moving average EMA2 (21-period): Medium-fast moving average EMA3 (34-period): Base/reference moving average EMA4 (55-period): Medium-slow moving average EMA5 (233-period): Slowest moving average (often used as a

Dynamic Market Oscillator (DMO) – Clean Dynamic Horizontal Levels Marker The Dynamic Market Oscillator is a versatile, minimalist overlay indicator that automatically drawing clean, real-time horizontal price levels with markers and extendable dashed rays. It is perfect for traders who want an uncluttered chart while instantly seeing the most important ongoing support and resistance zones. Works perfectly on ALL markets : Forex pairs (EURUSD, GBPUSD, USDJPY, exotics) Cryptocurrencies (BTCUSD, E

Binary Connect (THI Reversal) is a professional Signal Indicator designed for Binary Options and Scalping. It helps traders identify high-probability reversal points using a combination of RSI and Bollinger Bands . ️ Please Note: This product is a Technical Indicator that displays entry arrows on the chart. It is NOT an Expert Advisor (EA) and does not place trades automatically on its own. Key Features: Clear Signals: Displays visual "Call" (Green) and "Put" (Red) arrows on the chart. No Re
FREE

Binary Connect Turbo is a professional indicator designed for Binary Options trading, specifically optimized for the M5 Timeframe . It combines powerful reversal logic (RSI + Bollinger Bands) with a smart Martingale Dashboard to help you make data-driven decisions. This tool is perfect for traders who need Early Signal Detection . Arrows appear on the current candle to give you enough time to prepare for the trade entry. It also features a built-in Large Countdown Timer and a News Guard System t

Market Structure Order Block Dashboard MT5 , MT5 için bir indikatördür . Piyasa yapısı ve ICT / Smart Money Concepts yaklaşımına odaklanır: HH/HL/LH/LL , BOS , ChoCH , ayrıca Order Blocks , Fair Value Gaps (FVG) , likidite (EQH/EQL, sweeps), seanslar / Kill Zones ve entegre Volume Profile ile kompakt bir confluence dashboard sunar. Önemli: Bu bir analiz aracıdır . İşlem açmaz (EA değildir). Alıcı Bonusu
Satın aldıktan sonra mağazamdan seçerek 2 bonus indikatör ücretsiz alabilirsiniz. Bonusları
MT4 Sürümü: https://www.mql5.com/tr/market/product/125434 MT5 Sürümü: https://www.mql5.com/tr/market/product/157662
MT4 ASİSTANI: https://www.mql5.com/tr/market/product/107986
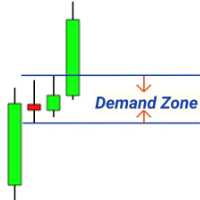
RALLİ TABAN RALLİSİ (RBR), DÜŞÜŞ TABAN RALLİSİ (DBR), DÜŞÜŞ TABAN DÜŞÜŞ (DBD), DÜŞÜŞ TABAN DÜŞÜŞ (RBD), ADİL DEĞER AÇIĞI (FVG) / DENGESİZLİK, GİZLİ TABAN
Finans piyasalarının dinamik dünyasında hassasiyet ve güvenle gezinmeniz için en iyi aracınız olan "Arz Talep MT4" Göstergesi'ni sunuyoruz. Bu son teknoloji Gösterge,
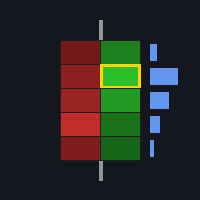
FOOTPRINTORDERFLOW: The Authoritative Guide ( This indicator is also compatible with economic providers that do not offer DOM data and BID/ASK data, It also supports various foreign exchange transactions, DEMO version,modleling must choose " Every tick based on real ticks" ) Important notice: Before placing an order, please contact me first, and I will provide you with professional answers and services
1. Overview FOOTPRINTORDERFLOW is an advanced Order Flow analysis tool designed for MetaTra

Bu gösterge, temiz ve doğru sinyalleri tercih eden traderlar için tasarlanmış, basit ama son derece güvenilir bir trend yönü tahmin aracıdır. Ana Özellikler Trend tahmin okları – fiyat hareketine göre Buy/Sell sinyalleri. Az ama yüksek doğrulukta sinyal – genelde günde 1 sinyal. Exit sinyalleri – en uygun kapanış zamanı için Exit okları. Repaint yok – oklar asla değişmez. Buffer desteği – özel araçlar veya EA için uygun. Uyarılar dahil – popup, ses ve push bildirimleri. Ayarlanabilir ok boyutu –

=== Scalper Hunting nedir? ===
Scalper Hunting, genel piyasa koşullarını birden fazla teknik indikatörle birleştirerek otomatik olarak alım–satım sinyalleri üreten bir MT5 indikatörüdür.
Birden fazla indikatörü üst üste koyup çeşitli filtreler uygulayarak yalnızca yüksek potansiyelli kurulumlara odaklanır ve böylece daha az gürültüyle, daha net bir şekilde işlem yapmanıza yardımcı olur. Tek bir “şanslı işlem” için değil, uzun vadeli ve sürdürülebilir bir yaklaşımı desteklemek için tasarlanmıştır

Interactive AVWAP Pro — TradingView-Style Analysis Interactive AVWAP Pro is the most convenient Anchored Volume-Weighted Average Price (AVWAP) indicator for MetaTrader 5/4. Forget standard, clumsy tools. We brought the intuitive drag-and-drop functionality of TradingView right into your MT5/4 terminal. The Advantage of a Professional Tool Stop cluttering charts with vertical lines and fiddling with awkward settings. Interactive AVWAP Pro gives you unparalleled speed and accuracy in analysis.
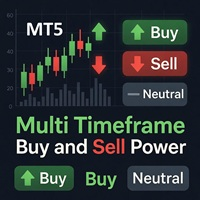
Multi Timeframe Buy and Sell Power
The "Multi Timeframe Buy and Sell Power" indicator for MetaTrader 5 is a versatile tool designed to provide traders with a clear visual representation of market pressure across nine standard timeframes, from M1 to MN1. By aggregating buy and sell strength percentages derived from recent price action and tick volume, it helps identify potential trends, reversals, and neutral market conditions in real-time. The indicator displays this information in a compact da
FREE

ATR Smart Levels – Piyasanın gerçekten nereye gidebileceğini net şekilde gösterir Birçok trader strateji yüzünden değil, yanlış giriş seviyeleri yüzünden kaybeder: çok erken giriş, aralığın ortası, düşük R:R. ATR Smart Levels bunu tek bir araçla çözer. Gösterge, mevcut fiyatın üstünde ve altında 3 adet ATR hedef bölgesi (TP1, TP2, TP3) çizer. Ne yapar? Seçilen zaman diliminde ATR hesaplar. Yukarı hedef bölgeler oluşturur. Aşağı hedef bölgeler oluşturur. Piyasanın gerçek hareket potansiyelini gös
FREE
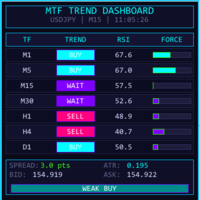
MTF TREND DASHBOARD - Çoklu Zaman Dilimi Trend Analiz Aracı 7 zaman diliminde (M1, M5, M15, M30, H1, H4, D1) trend yönünü aynı anda gösteren güçlü bir görsel panel. === ANA ÖZELLİKLER === EMA kesişimi ile gerçek zamanlı çoklu zaman dilimi trend tespiti Aşırı alım/aşırı satım renk kodlamasıyla RSI değerleri Dinamik trend güç çubukları Genel piyasa eğilim sinyali (Strong Buy/Sell, Bias, Weak, Neutral) Spread, ATR, Alış/Satış fiyatlarının canlı gösterimi Özelleştirilebilir neon renklerle modern koy
İkili opsiyonlar için sinyal indikatörü; Forex ve diğer piyasalarda da etkili bir şekilde kullanılabilir. M1–M5 üzerinde kısa vadeli grid (ızgara) işlemleri için uygundur ve pozisyonları kademeli olarak artırmaya yönelik sinyaller içerir. Ücretsiz sürüm yalnızca XAUUSD paritesinde çalışır. MetaTrader 5 için tam sürüm burada: https://www.mql5.com/en/market/product/156185 İndikatör iki seviyeli bir adaptasyon kullanır: başlangıçtan itibaren “hızlı/yumuşak” olarak ayarlanabilen temel hız profili ve
FREE
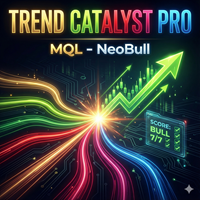
Trend Catalyst Pro 7 kat Onay, Akıllı Uyarılar, Haber Özeti ve MetaTrader 5 için Entegre Gösterge Paneli ile Profesyonel Çoklu Trend Göstergesi. Trend Catalyst Pro, yedi kanıtlanmış piyasa göstergesinin sinyallerini tek bir net skora birleştirir. Her göstergeyi ayrı ayrı analiz etmek yerine, grafik mumunda görünür bir sonuç elde edersiniz: "6/7 LONG" veya "7/7 SHORT" gibi oklar ve metin Sinyal gücüne göre renk kodlu mumlar Tüm değerleri gerçek zamanlı olarak açıkça gösteren bir gösterge paneli
FREE

Dynamic Trend Fill Pro , iki kanal sistemi arasındaki dinamik ilişkiyi kullanarak piyasa yapısını görselleştiren gelişmiş bir trend göstergesidir.
Klasik hareketli ortalamalar yatay piyasalarda ciddi gecikme gösterir. Piyasa gürültüsü (Noise) ile gerçek momentum (Signal) arasındaki farkı hesaplayarak, indikatör yumuşatma katsayısını otomatik olarak ayarlar—trendde hızlı, yatayda ise dengeli. Gösterge iki kanal katmanından oluşur.
Sarı dolgu bölgesi , kısa-orta vadeli trendin genişlemesini veya

Ultimate MACD MTF Pro , klasik MACD'nin modern ticaret için yeniden tasarlanmış, güçlü ve güncellenmiş bir sürümüdür. Bu indikatör size Çoklu Zaman Dilimli (MTF) MACD, dinamik histogram renkleri, sinyal kesişim işaretleri ve momentuma dayalı akıllı çizgi rengi değişimleri sunar. Net sinyaller, erken trend tespiti ve profesyonel düzeyde görsel netlik isteyen yatırımcılar için üretilmiştir. Temel Özellikler Çoklu Zaman Dilimli MACD (MTF) Mevcut grafik zaman dilimi arasında kolayca geçiş yapın
FREE

İndikatör: Currency Strength Meter Pro Piyasa Genişliği Görselleştirmesi Artıları: Karmaşık grafikler yerine temiz bir "Panel" görünümü sunar. Hangi paritenin güçlü veya zayıf olduğu anında görülür. Faydaları: Zaman kazandırır ve karar vermeyi hızlandırır. Otomatik Sıralama Artıları: Pariteleri "En Güçlü"den "En Zayıf"a otomatik sıralar. Faydaları: Günün/Haftanın Kazananlarını ve Kaybedenlerini hemen gösterir. Akıllı Para Birimi Mantığı Artıları: Farklı baz dövizli pariteleri (örn. EURUSD ve USD

Fine Timeframes, MT5 için bir dakika altı zaman dilimi göstergesidir. 1 ila 30 saniyelik aralıklarla grafikler oluşturarak, dakika ve saatlik grafiklerde görünmeyen piyasa hareketlerine erişmenizi sağlarken, tüm işlem işlevlerini korur: Standart zaman dilimlerinde olduğu gibi pozisyon açıp kapatabilirsiniz. Fine Timeframes yalnızca canlı tiklerde çalışır ve Strateji Test Cihazı için tasarlanmamıştır; demo sürümünü indirin ve göstergeyi EURUSD ve AUDUSD'de gerçek piyasa koşullarında test edin. Te

TrendBite v1.5 - Profesyonel Trend Takip İndikatörü Geliştirici: 8aLt4
Versiyon: 1.5
Platform: MetaTrader 5 Genel Bakış TrendBite v1.5, piyasadaki trend değişimlerini tespit etmek ve yatırımcılara net alım-satım sinyalleri sunmak için tasarlanmış gelişmiş bir teknik analiz indikatörüdür. Bollinger Bantları algoritmasını temel alarak, trend dönüşlerini hassas bir şekilde yakalayan bu araç, hem yeni başlayanlar hem de deneyimli traderlar için idealdir. Temel Özellikler Trend Tespiti Otom
FREE
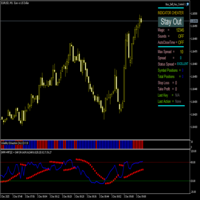
WPR+MFI Fusion Parabolic SAR Açıklama:
Gösterge, iki osilatörü (Williams Percent Range ve Money Flow Index) Parabolic SAR trend göstergesiyle tek bir pencerede birleştirir. WPR ve MFI değerleri ortalaması alınır ve elde edilen çizgi temel alınarak Parabolic SAR oluşturulur. Çalışma Prensibi: Avg(WPR,MFI) Çizgisi - WPR (0-100 aralığına dönüştürülmüş) ve MFI arasındaki ortalama değer Parabolic SAR Noktaları - Avg(WPR,MFI) çizgisinin değerleri üzerine inşa edilir Sinyaller: Seviye Geçişleri: Ç
FREE
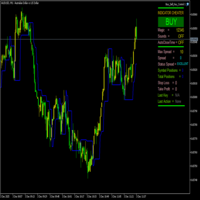
FractalBreakoutLevels Genel Bakış:
Bu gösterge, fiyat hareketlerinin analizine dayalı olarak dinamik fiyat seviyelerini çizer. İşlemler için referans olarak kullanılabilecek kilit seviyeleri belirlemek üzere geçmiş fiyat verilerini birleştirir. Çalışma Prensibi:
Gösterge, mevcut ve geçmiş fiyat verileri arasındaki ilişkiyi inceleyerek piyasa yapısını analiz eder. Değişen piyasa koşullarına uyum sağlayan sürekli bir çizgi çizer ve dinamik bir destek/direnç seviyesi görevi görür. Seviye Oluşum İ
FREE

Buyer Seller Arrows – Güvenle İşlem Yapın! M1’den MN1’e kadar tüm zaman dilimlerinde alıcı ve satıcı gücünü görsel olarak analiz edebileceğiniz devrim niteliğinde bir araç. Bu indikatör, renk kodlu yüzdeler ve oklar sayesinde size piyasa dinamiklerini anında gösterir . Ana Özellikler: Yeşil yukarı oklar = alıcıların üstünlüğü Kırmızı aşağı oklar = satıcıların üstünlüğü Her zaman dilimi için yüzde gücü (M1, M5, M15, M30, H1, H4, D1, W1, MN1) Renk kodlaması ile hızlı yön bulma (parlak yeşil
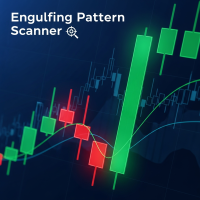
Sürüm 4.4
Çoklu zaman dilimi doğrulamasıyla Yutan Mum Formasyonlarını tespit etmek için profesyonel gösterge.
Temel Özellikler:
Esnek Zaman Dilimi Yapılandırması
Onay için tamamen özelleştirilebilir alt zaman dilimleri
Herhangi bir kombinasyon kullanın: M1-M5-M15, M5-M15-H1, M15-H1-H4 vb.
Herhangi bir işlem stiline ve stratejisine uyum sağlar
Üç Seviyeli Sinyal Onayı
Zayıf onay (özel TF) - sarı oklar
Orta onay (özel TF) - mavi oklar
Güçlü onay (özel TF) - yeşil/kırmızı oklar
Yeniden
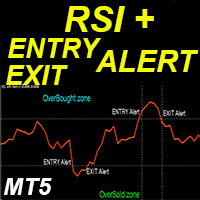
MT5 için "Uyarılı RSI" Kripto Forex Göstergesi, Yeniden Çizilme Yok.
- RSI, alım satım için en popüler osilatörlerden biridir. - Hem PC hem de Mobil cihazlarda hem de dahili olarak şu uyarılar mevcuttur: Aşırı Satış/Aşırı Alım bölgesine giriş ve Aşırı Satış/Aşırı Alım bölgesinden çıkış. - Uyarıların etkinleştirilmesi için ayarlanabilir tetik seviyeleri. - Bu gösterge, momentum alım satım sistemleri için mükemmeldir. - Güçlü Aşırı Alım bölgesinden (70'in üzerinde) Satış, güçlü Aşırı Satış bölge

Session Momentum Dashboard – Gelecek Tarzı Trading Analizi Asya/Londra/New York oturumlarını analiz eden, Kill Zone tespiti, Asya aralığı kırılımı ve gerçek zamanlı momentum puanlaması sunan profesyonel bir trading paneli. Session Momentum Dashboard Piyasa oturumlarını ve Kill Zone’ları takip eden ICT/Smart Money traderları için hepsi-bir-arada bir araç. Ana özellikler: 3 ana oturumun analizi Asya, Londra ve New York için gerçek zamanlı durum. Kill Zone tespiti Londra Kill Zone (07:00–09:00) New
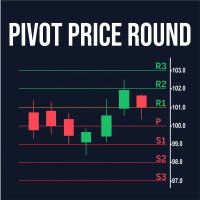
Pivot Round Price, klasik Pivot Points (Classic Pivots) formüllerine dayanan bir indikatördür ve kullanılan standart matematiğin herhangi bir bölümünü değiştirmeden destek, direnç ve merkez pivotun orijinal hesaplamalarını tamamen korur. Bu indikatörün farkı ve en önemli avantajı, seviyelerin otomatik olarak yuvarlanmış fiyatlara ayarlanmasıdır; bu, çok sayıda ondalık basamağı olan varlıklarda görselleştirmeyi kolaylaştırır ve seviyeleri gerçek grafikte çok daha anlamlı hale getirir. Fiyat yuvar
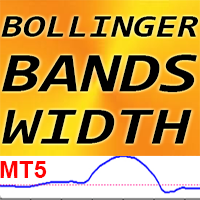
MT5 için "Bollinger Bant Genişliği" Kripto_Forex Göstergesi, Yeniden Boyama Yok.
-BB Genişliği göstergesi, standart Bollinger Bantları göstergesiyle birlikte kullanılmak üzere tasarlanmıştır. -Bu işlem aracı, Bollinger Bantları göstergesini kullanan her yatırımcı için olmazsa olmazdır, çünkü kombinasyonları Kırılmalarda işlem yapmak için çok etkilidir. -BB Genişliği göstergesi, Bollinger Bantları arasındaki mesafeyi (açıklığı) gösterir.
BB Genişliği NASIL KULLANILIR (Resimdeki örneğe bakın):

Ichimoku Multi-Layer Trend Oscillator Pro Ichimoku Multi-Layer Trend Oscillator Pro, Ichimoku hesaplamalarını dört güçlü osilatör katmanına dönüştüren, gelişmiş bir trend okuma ve giriş/çıkış sistemidir. Bu katmanlar, trend gücü, momentum ve en güvenli giriş/çıkış noktalarının net bir görsel temsilini sağlar. Gösterge ayrıca, eksiksiz bir alım satım karar paketi oluşturmak için isteğe bağlı RSI , MACD , EMA ve ATR onaylarını da içerir. Benzersiz Çok Katmanlı Osilatör Yapısı Sistem, her biri f
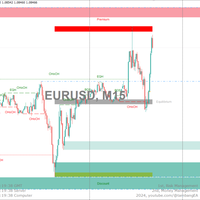
MT4 Sürümü: https://www.mql5.com/en/market/product/125756 MT5 Sürümü: https://www.mql5.com/en/market/product/157655
Bu hepsi bir arada gösterge, gerçek zamanlı "Piyasa Yapısı"nı (dahili ve swing BOS/CHoCH), emir bloklarını, prim ve iskonto bölgelerini, eşit en yüksek ve en düşük seviyeleri ve çok daha fazlasını görüntüler... yatırımcıların grafiklerini yaygın olarak kullanılan fiyat hareketi metodolojileriyle otomatik olarak işaretlemelerine olanak tanır. Adil Değer Farkı betiğimizin yayınlanm
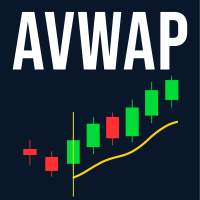
Avwap
Başlıca özellikler: Otomatik Günlük VWAP (her gün sunucu saatine göre 00:00’da mükemmel şekilde yeniden başlar)
Hesaplama için 8 fiyat tipi: Close, (H+L+C)/3, (H+L)/2, (O+C)/2, (O+H+L+C)/4 ve daha fazlası
Anchored VWAP modu: sadece dikey çizgiyi geçmişteki herhangi bir noktaya sürükleyin, VWAP o andan itibaren anında yeniden hesaplanır
Dikey çizginin rengi, kalınlığı ve tarzı %100 özelleştirilebilir (çapayı nasıl görmek istediğinizi siz seçersiniz)
Grafikte etiket veya metin yok
Son derece
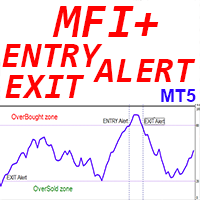
MT5 için "Uyarılı MFI" Kripto Forex Göstergesi, Yeniden Boyama Yok.
- Para Akış Endeksi (MFI), aşırı satım ve aşırı alım bölgelerini belirlemek için fiyat ve hacim verilerini kullanan teknik bir osilatördür. - Hem PC hem de Mobil cihazlarda yerleşik Uyarılar: Aşırı Satış/Aşırı Alım bölgelerine giriş ve Aşırı Satış/Aşırı Alım bölgelerinden çıkış. - Uyarıların etkinleştirilmesi için ayarlanabilir tetik seviyeleri. - MFI osilatörü, yükseliş ve düşüş fiyat momentumu hakkında bilgi sağlar. - MFI 80
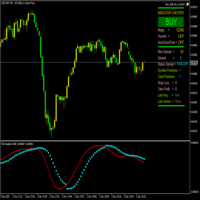
ParabolicSariTriX , Trend göstergesi TriX (Üçlü Üstel Hareketli Ortalama) ile Parabolik Dur ve Ters Dönüş sistemini (Parabolic SAR) birleştiren hibrit bir göstergedir. Gösterge ayrı bir pencerede görüntülenir ve trend dönüş sinyallerine dayalı olarak giriş ve çıkış noktalarını belirlemek için tasarlanmıştır. Piyasa eğilimi değiştikçe TriX çizgisine göre konum değiştiren SAR noktaları şeklinde net görsel sinyaller sağlar. SAR noktaları şu şekilde konumlanır: Düşüş eğilimi sırasında : TriX çizgisi
FREE
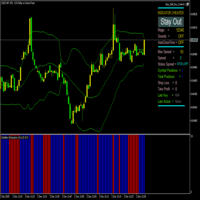
Volatility Exhaustion Göstergesi Kullanıcılar İçin Açıklama Volatility Exhaustion, özel bir volatilite analiz teknolojisi kullanan benzersiz bir göstergedir. Mevcut aktivitenin tarihsel verilere kıyasla aşırı seviyelere ulaştığı piyasadaki kritik anları belirler. Temel Özellikler: Basit Yorumlama : Gösterge ikili sinyal sistemi kullanır
Çok Yönlülük : Tüm zaman dilimlerinde ve araçlarda çalışır
Etkililik : Yatay ve trend piyasalarda özellikle kullanışlıdır
Görsel Netlik : Net renk ayrımı ile
FREE

Price Edge – Piyasa Hareket Etmeden Önce Fiyatı Görün Ticarette, bir saniye bile kârlı bir işlem ile kaçırılmış bir fırsat arasındaki farkı yaratabilir .
MetaTrader 5 (MT5) üzerinde Price Edge ile artık hiçbir fiyat değişimini kaçırmayacaksınız. Price Edge sadece bir gösterge değil, ticarette sizin avantajınız.
Gerçek zamanlı fiyat güncellemeleri sunar, böylece kararlarınız her zaman doğru, hızlı ve güvenli olur. Neden Price Edge’i Seçmelisiniz Live Price Indicator MT5 – teklif fiyatını an
FREE
<b>Lui Auto TrendLine MTF Alert</b>, tek bir grafikte 9 zaman diliminde hassas trend çizgilerini otomatik olarak çizer. Zaman dilimleri arasında geçiş yapmayı bırakın - piyasa yapısının tamamını anında görün.
<b> ANA ÖZELLİKLER </b>
<b>Çoklu Zaman Dilimi Görüntüleme</b> • 9 Zaman Dilimi: M1, M5, M15, M30, H1, H4, D1, W1, MN1 • Tüm trend çizgilerini aynı anda görüntüleyin • Her zaman dilimini tek tıkla AÇIN/KAPATIN • Anında tanımlama için renk kodlu çizgiler
<b>3 Algılama Modu (L / S /

# SSL ST Strategy MT5 Indicator - Turkish Version
SSL ST Strategy MT5 Göstergesi, tüccarların ticaret grafiğinde alış ve satış sinyallerini açıkça tanımlamalarına yardımcı olmak için tasarlanmış bir teknik analiz aracıdır. Çizgiler ve oklar gibi görsel göstergeler, ayrıca ses, açılır pencere ve anında bildirimleri sunarak, ticaret fırsatı ortaya çıktığında tüccarları zamanında uyarır.
## Ana Avantajlar
- Renkli çizgiler (SSL1 ve Baseline) ve alış sinyalleri (yeşil üçgen) ve satış sinyalleri
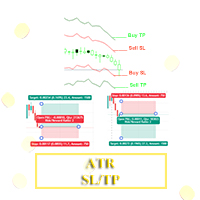
Merhaba Yatırımcılar! İşlemlerinin Stop Loss ve Take Kâr değerlerini belirlemek için Ortalama Gerçek Aralık (ATR) değerini kullanan yatırımcılar için bir uygulama geliştirdim. Bu göstergeyle, Take Kâr ve Stop Loss değerlerini istediğiniz çarpanla kolayca ayarlayabilirsiniz.
Bunu kullanmak için lütfen ATR Dönemini işlem tarzınıza göre ayarlayın, ardından Stop Loss Çarpanı ve Take Kâr Çarpanı'nı buna göre ayarlayın.
Mutlu İşlemler. İyi şanslar ve iyi ticaretler!!!
FREE

Capital Vault System , MetaTrader 5 için geliştirilmiş, piyasa yapısını tanımlamak ve piyasa oynaklığını (volatilite) adaptif olarak filtrelemek için tasarlanmış profesyonel bir teknik analiz paketidir. Statik göstergelerin aksine, bu sistem yönlü trendler ile doğrusal olmayan konsolidasyon aralıklarını ayırt etmek için üç matematiksel modeli — Maksimum Entropi Spektral Analizi (MESA) , Fraktal Boyut ve Harmonik Geometri — entegre eder. Yatırımcının piyasa koşullarına göre gerçek zamanlı pozisyo

Hamzai SR Levels Pro Gold Support Resistance, MT5 için tasarlanmış çok zaman dilimli bir göstergedir; M5’ten H4’e kadar en tepkili destek ve direnç seviyelerini otomatik olarak belirler, altın işlemlerine odaklanır ama her enstrümanda kullanılabilir. Geçmiş fiyat hareketlerini tarar, salınım zirve/diplerini kümeler ve her zaman dilimi için minimum mesafe koruyarak temiz yatay çizgiler çizer; grafiğin kalabalıklaşmasını önler. Entegre ok sinyalleri kırılma ve tepki formasyonlarını vurgular: alım

The Volume Impulse indicator identifies a specific chart pattern that develops on price bars and volume. It detects a proprietary reversal and trend pattern I designed. This signal is a strong indication of an imminent price movement in the indicated direction. Of course, I always recommend contextualizing the chart reading. For example, avoid buying when the stock is already at its monthly highs or shorting when it is at the current month’s lows. Combine it with support/resistance levels, overa

Murrey Math Institutional Frame , geleneksel göstergelerin ötesine geçen, MetaTrader 5 için geliştirilmiş bir teknik analiz çözümüdür. RSI veya Hareketli Ortalamalar gibi standart araçlar gecikmeli (lag) tepki verirken, bu sistem piyasanın gelecekteki geometrik yapısını yansıtmak için fraktal algoritmalar kullanır. Bu yazılım, grafik üzerinde objektif bir "Referans Çerçevesi" (Frame) oluşturarak, yatırımcının volatiliteyi ve matematiksel denge noktalarını fiyat oraya ulaşmadan önce görselleştir

Ticarette zamanlama bir avantaj değil — her şeydir. Karlı bir işlem ile kayıp bir işlem arasındaki fark çoğu zaman saniyelerle ölçülür.
Candle Sentinel , mevcut mumun kapanmasına ne kadar süre kaldığını gerçek zamanlı olarak göstererek size zamanı tamamen kontrol etme imkanı verir. Tahmin yok.
Kör bekleme yok.
Geç giriş yok. Sadece tam doğruluk . Neden Trader’lar Candle Sentinel’i Seçiyor Candle Sentinel sadece bir zamanlayıcı değil…
O, karar verme aracınız dır. Mum kapanışını tam olarak bi
FREE

Synthetic Pro Detector is built for traders who want real results and don’t have time to waste. Forget ordinary indicators: this tool was designed to detect powerful market moves on Deriv Synthetic Indexes, Metals (Gold, Silver), and Forex with surgical precision. Smart impulse detection, direct Buy/Sell signals, and automatic SL/TP levels — all calculated in seconds. This indicator works for you: it filters noise, reduces false signals, and delivers only opportunities with real profit potential

SMC LIQUIDITY Advanced Institutional-Grade Smart Money and Liquidity Analysis Suite for MT5 SMC LIQUIDITY is a comprehensive institutional toolkit engineered for traders who require precise liquidity mapping, market structure intelligence, smart money concepts, and order flow awareness in a single integrated interface. It is designed for professional workflow, multi-timeframe clarity, and seamless execution in fast-moving conditions. This indicator combines several institutional methodologies in
FREE
Multi-Timeframe High/Low Signal Confirmation Indicator Important Information Product Type Technical signal indicator (no automated trading) Strategy Concept Higher timeframe High/Low touch with lower timeframe candle confirmation Risk Level User-controlled (signals only, no trade execution) Prop-Firm Compatibility Fully compatible (no trading actions) Setup Difficulty Beginner-friendly, configurable parameters Product Overview FlexTF Signal Sender is a multi-timeframe High/Low confirmation indic
FREE
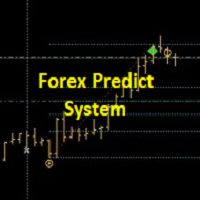
+++++++++++++++++++++++++++++++++++++++++++++++++++++++++++++++++++++++++++++++++++++++++++++++++ +++ Link to EURUSD Only Free Version --> https://www.mql5.com/en/market/product/156904?source=Unknown +++++++++++++++++++++++++++++++++++++++++++++++++++++++++++++++++++++++++++++++++++++++++++++++++ Hallo Trader, This is a traditional GANN & FIBONACCI strategy based on detection of an impulsive move in the opposite direction. This is called a Breakout. At the moment of Breakout, the indicator draw

Market Intelligence Hub
contattatemi per ricevere template da usare conAI Descrizione generale
Market Intelligence Hub è un indicatore professionale di analisi multi-asset progettato per MetaTrader 5.
Trasforma la complessità dei mercati globali in una visione operativa chiara e sintetica, utile sia per trader discrezionali che per analisti quantitativi.
Monitora oltre 25 strumenti suddivisi in cinque categorie chiave (USD, EUR, Risk Assets, Safe Haven, Volatility) e fornisce un quadro completo
Timeframe Simulator Indicator This indicator redraws candlestick structures from a higher timeframe onto your current chart. It helps visualize higher-period price action without switching timeframes, making it easier to analyze trends and key levels while trading on lower timeframes. Main features: Customizable Candles – Adjust the appearance of higher timeframe candles (bull/bear colors, wick style, gaps, and history length). Higher Timeframe Lines – Optionally display dynamic high, low,
FREE
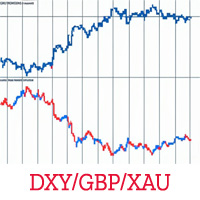
Overview Unlock a fresh perspective on your charts with the KS Invert Chart Pro Indicator – a powerful, zero-lag tool designed exclusively for MetaTrader 5. This innovative indicator inverts bars or candles mathematically (by multiplying price data by -1), revealing hidden patterns, contrarian opportunities, and inverse correlations that traditional views might miss. Perfect for advanced traders employing correlation strategies, multi-timeframe analysis, or hedge monitoring. Whether you're spott
FREE
BREAKOUT RANGE STRATEGY KASPER - Your Key to Profitable Breakout Trading!
STOP Missing Explosive Breakout Moves!
This professional indicator automatically detects consolidation zones and alerts you the INSTANT price breaks out - giving you the edge to catch powerful trends from the very beginning!
WHY TRADERS LOVE THIS INDICATOR:
Automatic Range Detection - No guesswork! The indicator finds consolidation zones for you Crystal-Clear Visual Zones - Beautiful gray zones show exa

Gold Beast XAUUSD – The Ultimate Gold Arrow Indicator
After 6+ years and tens of thousands of real trades, this is the FINAL and most powerful Gold arrow system ever released.
Gold Beast XAUUSD : • Arrows ( confirmed only at candle close ) • Blue upward arrow = BUY • Red downward arrow = SELL • Pure EMA × RSI crossover – zero lag, zero fake outs • Pre-loaded with the best XAUUSD settings (EMA 7 – the Gold holy grail) • Push, Email + Sound alerts included
Default Beast Settings (already loade

EmasFijas Multi-Timeframe EMA Indicator for MetaTrader 5 Product Description English: EmasFijas displays EMAs (Exponential Moving Averages) from any timeframe on your current chart. Perfect for multi-timeframe analysis without switching charts. Features an intuitive visual dropdown panel to quickly select any of the 21 available MT5 timeframes. Español: EmasFijas muestra EMAs (Medias Móviles Exponenciales) de cualquier temporalidad en tu gráfico actual. Perfecto para análisis multi-temporalidad

New Trend Stage -is a unique next-generation indicator that creates dynamic projections of market movement based on real data of the current day. These are not classical channels. This is an enhanced system of proprietary geometry built on the principles of time offsets, range dynamics, and adaptive levels.
The indicator automatically identifies and calculates the true range for the past N hours relative to each extremum and constructs precise, direction-based projections of future price moveme
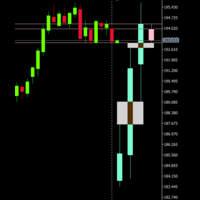
If you like this product, please give it a 5 star rating as a token of appreciation. This indicator projects Higher-Timeframe (HTF) candles onto the current chart and optionally shows their OHLC lines and Fair Value Gaps (FVGs) using ICT 3-candle logic.
Projects multiple higher timeframe candles.
Accurately preserves HTF OHLC on any lower timeframe.
Allows spacing adjustment between projected candles.
Optionally displays OHLC horizontal reference lines.
Automatically detects and draws HTF Fair
FREE

ATR Progress Control
Trading is all about probability, and if you don't know how much range the price has left today, you're trading blind.
This indicator is your dashboard that answers the most important question before a trade: does it make mathematical sense to enter the market right now? It's a tool for professional volatility analysis that helps filter out false entries and avoid trades when the move is already exhausted.
What's the problem?
Imagine that the average daily movement (ATR
This is a free helper indicator for MT5 that will help traders setup their constant volume charts depending on their trading style. It will calculate the number of ticks that your constant volume chart should have depending on the following trading styles: Scalper Active Day trader Day trader Swing trader Position trader Instruction video attached.
Enjoy!
FREE
If you like this product, please give it a 5 star rating as a token of appreciation.
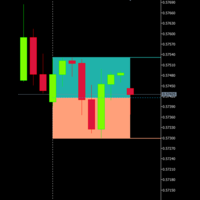
This indicator draws the premium and discount zones of a single candle from any timeframe on your chart.
You choose which candle (current or previous) using CandleOffset, and the indicator automatically retrieves that candle’s high, low, and midpoint.
It then visually displays:
Premium Zone (Upper 50%)
A shaded rectangle from the candle’s midpoint to high.
Discount Zone (Lower 50%)
A shaded rectangle from th
FREE
This is MT5 version only. For MT4 visit: https://www.mql5.com/en/market/product/156000/
Detailed blog post with screenshots: https://www.mql5.com/en/blogs/post/765529
Features Overview Bull and Bear Power Visualization: Histograms or Lines or Bands Combined Bull/Bear Power (BBP) Mode: To see the net power balance Customize Colors: for instant pattern recognition Smoothing (Optional): reduces noise for cleaner signals Additional Filter Options: Price Divergence visualization to spot potential

TrendView Zero — Zero Setup. Zero Complexity. Maximum Clarity. Over time, we received valuable feedback from traders who tested TrendView Ultimate, our most advanced indicator. Many loved its power and depth, but also shared a common challenge: “It’s incredibly powerful, but it gives SO much information that I don’t always know what to configure.” This inspired the creation of TrendView Zero, a fully automated, streamlined version that keeps only the information that matters most. It provide
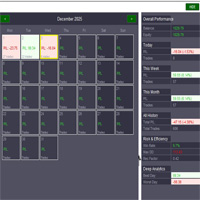
KS Trading Book With Performance Calendar This MetaTrader 5 indicator revolutionizes how traders track and analyze their performance by transforming raw trade data into a dynamic, visual trading journal and calendar—right on your chart. No more manual spreadsheets or expensive third-party tools (which can cost $30–$100/month). It automatically collects every trade, updates in real-time every 3 seconds, and delivers actionable insights to boost discipline, spot patterns, and refine your strategy

Hi Traders, Distilled from professional traders' experience, this is the only Fibonacci tool you will ever need. Unlock the power of advanced swing-based Fibonacci analysis with this custom MT5 indicator. Designed for precision and clarity, it automatically identifies the nearest Swing High (SH) and Swing Low (SL) on your selected timeframe and draws key Fibonacci retracement and extension levels directly on your chart. Key Features : Automatic Swing Detection: Finds the most relevant Swing Hi

Imbalance Volume Trend is a professional indicator for MetaTrader that combines Fair Value Gap (FVG) / Imbalance zones with volume imbalance analysis and a trend engine based on imbalances . The indicator automatically finds bullish and bearish Fair Value Gaps, paints them on the chart as colored rectangles and calculates the percentage of volume domination of buyers over sellers (or vice versa) inside the breakout candle that created the imbalance. On top of that, it builds a trend of imbalance
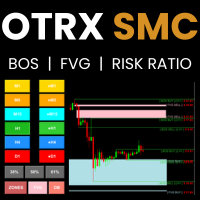
Unlock the power of Smart Money Concepts (SMC) with precision and financial clarity. OTRX SMC is not just a technical indicator; it is a complete professional trading system designed for traders who follow institutional footprints. Unlike standard indicators that clutter your chart with noise, OTRX SMC focuses on the three pillars of Price Action: Structure (BOS) , Flow (FVG) , and Origin (OB) . The unique advantage of OTRX SMC is its Real-Time Risk Calculator . For every mapped structure or zon
MetaTrader mağazası, MetaTrader platformu için uygulama satın almak adına rahat ve güvenli bir ortam sunar. Strateji Sınayıcıda test etmek için Uzman Danışmanların ve göstergelerin ücretsiz demo sürümlerini doğrudan terminalinizden indirin.
Performanslarını izlemek için uygulamaları farklı modlarda test edin ve MQL5.community ödeme sistemini kullanarak istediğiniz ürün için ödeme yapın.
Alım-satım fırsatlarını kaçırıyorsunuz:
- Ücretsiz alım-satım uygulamaları
- İşlem kopyalama için 8.000'den fazla sinyal
- Finansal piyasaları keşfetmek için ekonomik haberler
Kayıt
Giriş yap
Gizlilik ve Veri Koruma Politikasını ve MQL5.com Kullanım Şartlarını kabul edersiniz
Hesabınız yoksa, lütfen kaydolun
MQL5.com web sitesine giriş yapmak için çerezlerin kullanımına izin vermelisiniz.
Lütfen tarayıcınızda gerekli ayarı etkinleştirin, aksi takdirde giriş yapamazsınız.