 MetaTrader 5
 Uzmanlar
 Göstergeler
 Kütüphaneler
 Yardımcı programlar
 Widget'lar
 Kurallar
YouTube'dan Mağaza ile ilgili öğretici videoları izleyin
Bir alım-satım robotu veya gösterge nasıl satın alınır?
Uzman Danışmanınızı
sanal sunucuda çalıştırın
sanal sunucuda çalıştırın
Satın almadan önce göstergeyi/alım-satım robotunu test edin
Mağazada kazanç sağlamak ister misiniz?
Satış için bir ürün nasıl sunulur?
MetaTrader 5 için yeni Teknik Göstergeler - 21
 Teknik göstergelerden gelen sinyaller, borsa ve Forex piyasalarında işlemler açılması ve kapatılmasında çok önemli bir rol oynar. Göstergeler, fiyat değişikliklerini tahmin etmeyi amaçlayan, finansal sembol fiyatının matematiksel dönüşümüdür.
Piyasa davranışını daha iyi tahmin etmek ve bundan kar elde etmek için teknik göstergeleri test edin.
Teknik göstergelerden gelen sinyaller, borsa ve Forex piyasalarında işlemler açılması ve kapatılmasında çok önemli bir rol oynar. Göstergeler, fiyat değişikliklerini tahmin etmeyi amaçlayan, finansal sembol fiyatının matematiksel dönüşümüdür.
Piyasa davranışını daha iyi tahmin etmek ve bundan kar elde etmek için teknik göstergeleri test edin. 
GOLD TRACK — MT5 Gold Track is a technical analysis indicator designed primarily for XAUUSD / GOLD trading on MetaTrader 5. It combines multiple market conditions into a structured signal system, helping traders identify potential bullish and bearish setups without relying on a single indicator. Key Features EMA Trend Analysis RSI Momentum Confirmation ️ ATR Volatility Analysis ️ Candle Confirmation ️ H1 Multi-Timeframe Confirmation Market Structure Analysis Liquidity Anal

ModGod Scalp Pullback - Precision Trend & Reversion Engine
LAUNCH PROMOTION: Only $49 for the first 10 copies! The official price will be $490. Buy before the price goes up!
The ModGod Scalp Pullback is an advanced, all-in-one indicator designed for professional scalpers and day traders. It combines the extreme smoothness of Triangular Moving Averages (TMA) with Heikin-Ashi trend filtering to provide highly accurate pullback entries and extreme exhaustion reversals. By mapping the natu

Zone Levels MTF
Zone Levels MTF draws support and resistance zones from two timeframes on one chart and shows complete trade levels for each timeframe: Entry, Stop Loss, TP1, TP2 and TP3.
MAIN FEATURES - Two timeframes on one chart (default M5 and M15). Each timeframe can be enabled or disabled. - Reversal zones: zones where the market changed direction. Up to 5 zones per side are kept on the chart until price closes through them. Older zones are shown with lighter colors. - Broken zone: the

Aura Breaker Block – automatic ICT breaker block indicator for MetaTrader 5.
Aura Breaker Block detects bullish and bearish breaker blocks the way Smart Money Concepts (SMC) and ICT traders define them, and draws them as clean neon zones directly on your chart. No more drawing zones by hand – the indicator finds the liquidity sweep, the market structure shift and the breaker candle for you.
WHAT IS A BREAKER BLOCK? A breaker block is a failed order block. Price sweeps liquidity (a lower low o

PRISM Multi-Deviation Bands for MT5 is a chart-analysis indicator for MetaTrader 5 that displays three exact rolling high/low price ranges directly on the active chart. The indicator is designed for traders who want a clear visual reference for recent price structure without adding multiple lagging studies or cluttering the chart. PRISM calculates the highest high and lowest low across three related lookback windows and draws those boundaries as visible chart levels. The default configuration us

HTF 3-Candle System for MetaTrader 5 The HTF 3-Candle System is an advanced multi-timeframe structural analysis indicator for MetaTrader 5. Adapted from institutional price-action methodologies (ICT/SMC), this tool dynamically breaks down higher timeframe price sequences (C1, C2, and C3) to evaluate market structure, identify high-probability setup patterns, and score potential trade setups in real time. Instead of relying on lagging indicators, the HTF 3-Candle System scores market conditions u

Market Path Forecast [BOSWaves] Market Path Forecast [BOSWaves] is an advanced predictive technical analysis indicator that combines market structure detection, statistical swing modeling, and dynamic target projection. It dynamically calculates future price paths and key target levels based on recent historical swing metrics and average true range (ATR) volatility.
MT5 Expert Advisor Collection Explore automated systems built for Gold & Bitcoin , covering breakout, scalping, momentum and multi-

Eazy Divergence is a non-repainting MT5 indicator designed to automatically detect and plot Regular and Hidden divergence signals in real time
Key Features Dual-Window Plotting: Displays divergence trendlines and text badges directly on both the main price chart and the RSI subwindow. 100% Non-Repainting: Uses left/right pivot strength confirmation so signals stay fixed once drawn. Full Multi-Timeframe Support: Adapts instantly to whatever chart timeframe you are viewing. Fully Customizable: Eas

Golden Flow Pro is an indicator for Gold (XAUUSD) on MetaTrader 5. It was built by a Gold trader to answer two questions on every chart: where are the stops sitting, and is there a real setup right now?
What it draws
- Liquidity lines: levels above equal highs and below equal lows, where stop losses and pending orders tend to build up. Price often reaches for these before the real move.
- Breaker zones: drawn from the body of the candle that breaks market structure.
- Fair value gaps: the stan

Session Statistics marks three trading sessions and the day's opening range on an intraday chart, and then measures what actually happened after each of those levels was broken, on the history of the chart you have it on.
What it draws
Three session ranges and the day's opening range, as outlines, for the most recent days. The session hours are yours to set in server time, and a range may cross midnight.
What it measures
For every range, on both sides, over the lookback you choose:
- how m

Z-Score Range Boxes Breakout Z-Score Range Boxes Breakout is a statistical price-action indicator designed to identify potential reversal zones and subsequent breakouts using a smoothed Z-Score of price. The indicator calculates how far the current price has moved from its recent mean relative to its standard deviation. When the smoothed Z-Score reaches statistically extreme levels, the indicator automatically creates a range box around the price action.
MT5 Expert Advisor Collection Explore aut

Lookahead Safe RSI Divergence Detector
Most RSI divergence indicators mark a pivot the moment it looks like a swing high or low, so the last signal on the chart can silently shift or disappear as new bars form. This indicator only confirms a pivot after the number of bars set in Pivot Confirm Lag have genuinely closed, so a confirmed signal never repaints or moves.
What it detects Bearish divergence: price forms a Higher High while RSI forms a Lower High. Bullish divergence: price forms a Low

Fahmi Volume Profile Dashboard combines a session volume profile, value-area signals with stop loss and three targets, a multi-timeframe trend matrix and a built-in statistics lab that measures how the signals performed on your own chart history , so you can judge the edge before you trade it. Volume profile Session volume profile built from M1 tick volume, drawn in two colors (buying / selling volume) POC, VAH and VAL of the developing session, value area highlighted Previous session POC, VAH a

Overlay up to two other symbols on your chart as lines or candles, with a compact mini-window showing range and % change for today and two custom periods.
Symbol Compare Overlay draws up to two other symbols directly on the current chart, so you can see how gold, indices, currencies or any other instrument move against each other without switching windows.
Main features - Up to two compare symbols, each shown as a line or as candles. - Two overlay modes: - Fit to visible range: each symbol

A volume-at-price heatmap with POC, value area, estimated buy/sell pressure, confirmed signals and alerts.
POC Volume Profile Heatmap is a MetaTrader 5 indicator that organizes historical volume across price levels. It identifies the Point of Control, displays the selected value area, and estimates buying and selling pressure at the POC.
The indicator is intended for traders who use volume-at-price structure to study acceptance, rejection and interaction around high-activity price levels. It c
FREE

What Gets Drawn Most level tools mark every swing they can find, and a chart with forty lines answers nothing. This one keeps a level only when price came back to it, and prints the evidence next to the line: the number of touches and the age in days. Lines above current price and lines below it are drawn in different colours, so the map reads at a glance without counting. What Puts A Level On The Chart A swing high is a bar whose high is not lower than its neighbours on both sides, within the n
FREE

TRENDORA — Currency Strength, Trend & Signal Intelligence for MT5 Trendora is a multi-currency, multi-timeframe market analysis and signal indicator for MetaTrader 5. Instead of looking at a single chart in isolation, Trendora analyzes the broader Forex environment through its Currency Strength Engine , evaluates trend conditions across multiple timeframes, monitors the current pair's activity, and combines this information with its signal engine in one clear visual workspace. The objective is s

Three Anchors On One Chart Most volume weighted average lines restart once a day. This one draws three at the same time: one anchored to the current trading session, one to the day, one to the week. Their spread tells you something a single line cannot. When the session line sits far under the weekly one, the week has been trading higher than today is; when all three sit together, the market has spent the week in one place. Why The Session Anchor Is Not Midnight The session line starts where the
FREE

Multi-timeframe trend and reversal indicator with closed-candle arrows, ATR trend bands, EMA, ADX and RSI confirmation, dashboard and alerts.
Overview
MultiTrend Sentinel is a MetaTrader 5 chart indicator for monitoring trend
direction and potential changes in direction. It combines an ATR-based trend
line with optional EMA and ADX filters, then checks two selectable confirmation
timeframes using EMA direction and optional RSI confirmation.
Signal arrows are confirmed on completed candles. Th
FREE

Nick Rypock Pro— Auto Optimization & Trend Analysis Nick Rypock Pro is an advanced trend-analysis indicator designed for traders who use Nick Rypock price analysis and want an adaptive way to evaluate market direction and potential trade levels. Instead of relying on a fixed configuration, the indicator includes a genetic auto-optimization system that searches through different parameter combinations and evaluates their historical performance according to the selected optimization criterion. Th

QCL Clouds is an adaptive market-regime indicator designed to present trend direction, momentum transitions, and dynamic price zones in a clean and easy-to-read format. Instead of displaying multiple overlapping lines, the indicator combines its calculations into one color-changing signal line, crossover dots, and a projected market cloud. HOW TO READ QCL CLOUDS • Blue Signal Line
Indicates that bullish conditions are currently dominant. • Orange Signal Line
Indicates that bearish conditions are

XAUUSD Ultimate Trading Suite
Welcome to the XAUUSD Ultimate Trading Suite, a professional, precision-engineered technical indicator designed exclusively for gold (XAUUSD) traders who want to treat trading as a disciplined professional investment mission rather than guesswork.
Built around clear market structure and absolute trend clarity, this suite provides instant institutional-grade alignment to help you capture high-probability market moves with confidence.
Key Features & Indicat

AureonFX XAUUSD Precision Entry Assistant AureonFX XAUUSD Precision Entry Assistant is a multi-factor MT5 indicator designed specifically for Gold / XAUUSD traders who want a clearer view of market direction, entry quality, volatility, liquidity, and potential trade zones. Instead of relying on a single signal, the indicator combines DXY pressure, multi-timeframe trend analysis, momentum, volatility, structure, liquidity, support/resistance, and entry-zone detection into one easy-to-read dashbo

Breakout Trap Detector is Designed and tested for XAUUSD (gold) on the M1 chart and BTCUSD (bitcoin) on the M15 chart.
Breakout Trap Detector shows two kinds of signals on your chart: a normal breakout signal, and a reversal signal when that breakout fails and the market turns the other way.
How it works
1) The setup The indicator watches the market with several built-in filters. When conditions line up, it marks a reference candle and draws a white line at its high (for a buy) or its low (

SMT Divergence Multi Pair compares the swing highs and swing lows of the chart symbol with up to two correlated symbols and marks where they disagree. This is the Smart Money Technique (SMT) divergence used in ICT and Smart Money Concepts trading: one market sweeps a previous high or low while its correlated market fails to confirm the move. Discount Ends Soon — Next Price: $99 HOW IT WORKS The indicator finds confirmed swing highs and lows on the chart symbol and compares each new swing with th

Full Description Read Gold’s Complete Picture in One Single Panel Stop switching between M5, M15, H1, H4, and D1 charts. XAU Confluence Matrix Free brings multi-timeframe analysis straight to your main chart in a clean, real-time table. Powered by the quantitative XAU_Engine , this indicator scans 5 timeframes simultaneously on closed candles to give you an accurate directional bias before entering any trade. What You See on Your Screen 5 Timeframes at a Glance: Automatically displays your curre
FREE

SignalArrows - Trading Signal Indicator SignalArrows is a MetaTrader 5 indicator designed to identify potential BUY and SELL signal conditions using moving-average crossover logic with additional confirmation filters. The indicator processes a signal through several stages before plotting an arrow on the chart: How It Works 1. Raw MA Cross Detection
The indicator first detects a crossover between the fast and slow moving averages. 2. Gap Confirmation
After a crossover, the indicator checks whe

The advantage most indicators ignore: Intermarket data.
Almost every market indicator does the exact same thing: it takes historical price data from the chart, applies a mathematical formula (a moving average, a momentum calculation, a channel), and displays it in a different color. The problem is that price in isolation tells only half the story.
If you trade Gold (XAUUSD), you know it doesn't move in a vacuum. It moves in a constant dance with the US Dollar. The true institutional edge lies

This indicator marks the candles where price runs through a liquidity level and turns back. It finds and ranks the levels by itself, so there is nothing to draw by hand. It is made for manual trading on any symbol and timeframe. What you see on the chart A buy or sell arrow on the candle that confirms the reversal. Arrows appear only after that candle has closed, and they do not repaint. For every signal: the level that was swept, a stop level and two target levels. A label with the type of leve

MT5 için giriş, stop ve hedef seviyeli ikili tepe, ikili dip ve omuz baş omuz indikatörü Bu MT5 indikatörü, kapanmış mumlar üzerinde dönüş formasyonlarını tespit eder: ikili tepe ve ikili dip (double top, double bottom, M ve W formasyonları), omuz baş omuz ve ters omuz baş omuz (head and shoulders, inverse head and shoulders). Her formasyon grafiğe yazılan üç fiyata dönüşür: boyun çizgisi kırılımındaki giriş, stop ve ölçülen hedef. Bir formasyon henüz oluşurken gösterilir, bir mumun kapanışında

RelicusRoad Signal Line, MetaTrader 4 ve MetaTrader 5 için bir trend filtresi göstergesidir; iki hareketli ortalama çizgisi çizer ve seçtiğiniz bir strateji filtresine göre her ikisinin de her mumunu yeşil, somon veya gri renklendirir. Çizgi, ortalamanın nerede olduğunu gösterir. Renk ise seçilen filtrenin o mum hakkında ne söylediğini gösterir. Varsayılan olarak Line 1, momentuma göre renklendirilen hızlı bir KAMA 9'dur; Line 2 ise Ichimoku'ya göre renklendirilen yavaş bir Hull hareketli ortala
FREE

RelicusRoad SuperTrend, MetaTrader 4 ve MetaTrader 5 için bir SuperTrend göstergesidir; yükseliş trendinde fiyatın altına, düşüş trendinde fiyatın üstüne ATR tabanlı bir izleyen çizgi çizer. Üzerine hiçbir şey eklenmemiş klasik SuperTrend hesaplamasıdır: yukarı taraf için bir çizgi, aşağı taraf için bir çizgi; ok, etiket veya panel yoktur. Nasıl çalışır Gösterge her mum için ortanca fiyatı, mumun tepe ve dibinin orta noktasını alır ve bunun üstüne ve altına seçilen sayıda Average True Range (ATR
FREE

RelicusRoad Daily High Low, MetaTrader 4 ve MetaTrader 5 için bir önceki gün en yüksek ve en düşük göstergesidir; gün içi bir grafiğin her mumunda dünün en yükseğini ve en düşüğünü, bugünün açılışını işaretler. Üç seviye, yeni bir periyot başladığında yeni değerlere atlayan renkli nokta serileri olarak çizilir; her periyodun sonunda küçük High, Low ve Open etiketleri bulunur. H1 ile H4 arası grafiklerde aynı işaretler bunun yerine geçen haftanın aralığını ve bu haftanın açılışını gösterir, D1'de
FREE

RelicusRoad Daily Pivots, MetaTrader 4 ve MetaTrader 5 için bir günlük pivot noktası göstergesidir; önceki günün aralığını Fibonacci seviyelerine böler ve eksi yüzde 100'den artı yüzde 200'e kadar bunun üstüne ve altına uzatır. Klasik floor pivotları yerine, önceki tamamlanmış aralık; dibin yüzde 0, tepenin ise yüzde 100 olduğu bir ölçek olarak ele alınır. On dokuz seviye, grafiğin sağ kenarında kompakt renkli işaretler olarak basılır, bu yüzden bugünün hareketinin büyüklüğü dünün aralığının bir
FREE

RelicusRoad Fractals, MetaTrader 4 ve MetaTrader 5 için bir fraktal göstergesidir; salınım tepelerini ve diplerini iki güçte işaretler: her iki yanında 7 mumluk bir Fast testi ve her iki yanında 15 mumluk bir Slow testi. Her iki yanda 7 mumluk bir pencere zaten birçok küçük kıvrımı süzer, Slow testi ise bunun iki katından fazlasını ister, bu yüzden daha kalın okları grafiğin çok daha geniş bir bölümünde tutan salınımları seçer. İki güç de birlikte gösterilir, bu yüzden küçük ve büyük salınımlar
FREE

RelicusRoad Support Resistance, MetaTrader 4 ve MetaTrader 5 için bir destek ve direnç göstergesidir; fraktal tepe ve diplerden arz ve talep bölgeleri oluşturur ve her birini gücüne ve son testlerine göre derecelendirir. Fiyatın üstünde ve altındaki bölgelerin kısa bir haritasını tutar; her biri derecesi, genişliği ve son test sayısıyla etiketlenir. Nasıl çalışır Tepe ve dip salınımları tek çizgiler yerine fiyat bölgelerinde toplanır. Bir salınım, yüksek veya düşük noktası iki yanındaki 7 mum ta

RelicusRoad Scalping Pivots, MetaTrader 4 ve MetaTrader 5 için bir salınım noktası ve Fibonacci seviyesi göstergesidir; 60 mumluk bir inceleme penceresinde dönüşümlü salınım tepelerini ve diplerini işaretler ve en son salınımın Fibonacci geri çekilmelerini ve uzantılarını etiketler. Addaki pivotlar bu salınım noktalarıdır, PP, R1 ve S1 gibi klasik floor pivot noktaları değildir. Gösterge, en yeni salınımın yanına bir yüzde etiketi sütunu basar, böylece elle bir Fibonacci aracı çizmeden geri çeki

RelicusRoad Dynamic Circles, MetaTrader 4 ve MetaTrader 5 için bir salınım tepe ve dip göstergesidir; dönüş noktalarını aynı anda üç inceleme uzunluğunda dairelerle işaretler: 9, 60 ve 156 mum. Küçük dönüşler ve büyük dönüşler aynı grafikte yer alır ama farklı görünür. Kısa aralık noktası küçük bir salınımı gösterir; daha büyük orta ve uzun aralık halkaları ise yalnızca fiyatın çok daha uzun bir pencerenin uç noktasını yaptığı yerde görünür. Her daire HH(60) veya LL(156) gibi kısa bir metin etik

Apollo Global Trends , herhangi bir döviz çiftindeki bir piyasa trendinin hareketini ve ayrıca metaller, endeksler, hisse senetleri, kripto para birimleri ve diğer ticaret araçları dahil olmak üzere kesinlikle herhangi bir ticaret aracını tahmin etmek için oluşturulmuş bir trend göstergesidir. Bu gösterge herhangi bir zaman dilimi için kullanılabilir. Gösterge hem uzun vadeli hem de kısa vadeli ticaret için uygundur. Gösterge, ana sistem veya göstergeleriniz için bir filtre görevi görebilir. Bu

An ICT / SMC indicator for MetaTrader 5. It waits for a liquidity sweep of PDH or PDL, then a market structure shift back inside the range, and plots the trade. Full documentation: Complete User Guide Chart Timeframe : 5 MIN
Symbols : EURUSD How the model works The indicator marks the previous day high (PDH) and previous day low (PDL) from the completed daily candle, then waits for a liquidity grab: buy-side liquidity taken above PDH or sell-side liquidity taken below PDL. A stop hunt into the l

Ichimoku Nexus Pro Goichi Hosoda'nın üç teorisinin tamamını tek bir grafikte toplayan Ichimoku Kinko Hyo: beş çizgi, dalga teorisi (I, V, N, P, Y ve W dalgaları), fiyat teorisi (N, V, E ve NT hedefleri) ve zaman teorisi (kihon suchi ve taito suchi zaman sayımları). Buna ek olarak: yeniden çizim yapmayan üst zaman dilimi bulutu, ölçülmüş Chikou Span, Kijun yatayken, Kumo inceyken veya fiyat bulutun içindeyken kesişim sinyallerini bekleten yatay piyasa filtresi ve Market Watch'taki tüm pariteleri
FREE

Order Block Scorecard grafiğinizde arz ve talep bölgelerini işaretler ve her bölge için kendi geçmiş verinizden ölçülmüş bir kayıt tutar: fiyat o bölgeye kaç kez girdi, bu testlerin kaçında bölge tuttu ve sonrasında fiyat en fazla ne kadar yol aldı. Bu üç sayı, önünüzdeki sembol ve zaman diliminde halihazırda olup biteni anlatır. Geçmiş davranışın kaydıdır, bir tahmin değildir. Bölge kuralı Tek bir kural, tamamı yazılı, böylece herhangi bir mumda gözle doğrulayabilirsiniz: Arz - bir düşüşten önc
FREE

Sembollerinizden hangileri son dönüşü alanların ortalama fiyatının üstünde işlem görüyor ve hangileri onu az önce kaybetti. Anchored VWAP Scanner çıpalı VWAP'ı yirmi sekize kadar sembol ve dört zaman diliminde çalıştırır, sembollerin birbiriyle dürüstçe karşılaştırılabildiği birimsiz bir uzaklığı sapma cinsinden yayımlar ve giriş için grafiği tablonun altında tutar. Her 10 satın almada fiyat 10 $ artar. Anchored VWAP Scanner tek dosyada iki üründür. Birincisi, önünüzdeki grafiğe çizilen Anchored

Currency Strength Anchor – seansa uyarlanabilir göreceli güç, günlük, haftalık ve aylık açılışa sabitlenmiştir. Yeniden boyama yoktur. Çoğu güç göstergesi, enstrümanları sabit bir geri dönüş süresi üzerinden karşılaştırır. Ancak işlem günü Asya seansından Avrupa’ya, oradan Amerika’ya geçtikçe bu karşılaştırmanın anlamı değişir: Asya seansı verilerine göre oluşturulan bir sıralama, Londra ve New York işlemdeyken pek bir şey ifade etmez. Currency Strength Anchor farklı bir referans kullanır. Her

FIBOWAVE
Aylık grafikten M5'e kadar yedi zaman diliminde aynı anda otomatik Elliott dalga sayımı; yürüyen düzeltmenin Fibonacci geri çekilme seviyeleri, 3., 5. ve C dalgalarının Fibonacci hedefi, sayımın geçersiz olduğu fiyat seviyesi ve bir 3. veya 5. dalga başladığında verilen uyarı ile birlikte. Elliott dalgalarını elle saymak yavaştır ve iki analist nadiren aynı sayıma ulaşır. FIBOWAVE sabit kurallara göre, her seferinde aynı şekilde sayar ve dalgaları, onların alt dalgalarını ve onların d

Fixed Range VP MT5 Sabit Aralık Hacim Profili (FRVP), MetaTrader 5 için tasarlanmış kurumsal düzeyde ve yüksek performanslı bir analiz aracıdır. Kullanıcı tarafından tanımlanan belirli bir zaman dilimindeki işlem faaliyetlerini haritalandırarak kritik yüksek hacim ve düşük hacim düğümlerini (nodes) açığa çıkarır. Alış ve satış verilerini birleştiren geleneksel hacim profillerinin aksine, bu gösterge toplam tik (tick) hacmini ayrı alış ve satış yapılarına böler. Bu ayrım, emir akışını (order flo
FREE

Crystal Trend Matrix Pro - Non-Repainting Trend Engine with TP1/TP2/TP3, Stop Loss and Multi-Market Scanners Catch the turn on a closed bar. Get the entry, the stop and three targets locked at the next open. See which timeframes and which markets agree, all from one chart. Finding the trend is the easy part. What costs traders money is everything around it: arrows that repaint after the fact, no clear stop, targets guessed by eye, weak signals traded with the same size as strong ones, and entrie

Destek ve Direnç Bölgelerim — MT5 için Arz ve Talep Bölgeleri Çoğu arz-talep göstergesi grafiğinizi karmaşık hale getirir ve sonra da bunun "analiz" olduğunu iddia eder.
Bu gösterge ise öyle değil. Destek ve Direnç Bölgem, arz ve talep bölgelerini otomatik olarak haritalandırır ve ardından bunları dikdörtgenin ne kadar güzel göründüğüne göre değil, gerçek piyasa davranışına göre sıralar. Ne elde edersiniz? Zayıf Bölge Yeni Bölge (test edilmemiş) Onaylanmış Bölge Kanıtlanmış Bölge Hain / kırık
FREE

The Ultimate SMC Indicator The Ultimate SMC Indicator , MetaTrader 5 için yerel olarak geliştirilmiş, kurumsal düzeyde bir trading framework'üdür. Grafik karmaşasını ve subjektif manuel çizimleri azaltmak amacıyla tasarlanmıştır. Piyasa yapısını gerçek zamanlı olarak otomatik şekilde haritalandırır, kurumsal likidite bölgelerini belirler, order flow verimsizliklerini takip eder ve çeşitli finansal enstrümanlarda yüksek olasılıklı işlem fırsatları için uyarılar sağlar. Temel Teknik Özellikler ve

MQL5 Blogları = https://www.mql5.com/en/blogs/post/775942 MT4 Sürümü = https://www.mql5.com/en/market/product/196315 MT5 Sürümü = https://www.mql5.com/en/market/product/196316
Reversal Probability (Dönüş Olasılığı), geçmişteki dönüş noktalarının yoğunlaştığı fiyat bölgelerini tespit etmek için tasarlanmış gelişmiş bir piyasa analiz göstergesidir.
Tek bir destek veya direnç seviyesine güvenmek yerine, gösterge onaylanmış piyasa pivotlarından dinamik bir Dönüş Olasılığı değeri oluşturur ve bunl

ContextAxis Supply Demand Trade Planner ContextAxis Supply Demand Trade Planner , grafikte yalnızca bir bölge göründüğü için işleme girmek yerine, arz ve talep bölgelerini yapılandırılmış şekilde okumaya yardımcı olmak için tasarlanmış bir karar destek göstergesidir. Gösterge; üst zaman dilimi arz-talep bölgelerini, çoklu zaman dilimi bağlamını, oluşum derecelendirmesini, kapanmış mum teyidini, teknik hedefleri, Risk:Reward filtresini ve pozisyon boyutu planlamasını tek bir iş akışında birleştir

MTF OPEN LINE PRO MT5 GENEL BAKIŞ MTF Open Line Pro MT5, farklı zaman dilimlerindeki referans açılışlarını ve kapanmış mumlarla onaylanan kurulum olaylarını tek grafikte düzenleyen, salt okunur bir MetaTrader 5 göstergesidir. Panel, giriş adları ve mesajlar İngilizcedir. SEVİYELER VE PROFİLLER Scalping M5, Day M15, Day H1 ve Custom profilleri kullanılabilir. Sekiz adede kadar slot; mevcut dönem açılışı, önceki dönem açılışı, yıl açılışı, broker seans açılışları, özel tarih ve saat çapası ile Ope

RelicusRoad Multi Timeframe Trendbar, MetaTrader 4 ve MetaTrader 5 için bir çoklu zaman dilimi trend göstergesidir; M1'den MN1'e dokuz zaman dilimi için Yükseliş trendi, Nötr veya Düşüş trendi durumunu grafik köşesinde renkli bir nokta satırı olarak gösterir. Her zaman dilimi, grafiğin sağ alt köşesinde üzerinde adı olan bir nokta alır. Renk size durumu söyler, böylece grafik değiştirmeden hangi zaman dilimlerinin uyuştuğunu görebilirsiniz. Nasıl çalışır Gösterge her zaman dilimi için, o zaman d
FREE

SingleArrow MTF — Market Description — tr SingleArrow MTF — Bağımsız ZigZag + Williams %R Diverjans Sinyali Tek dosya. Tek ok. Tek karar. SingleArrow MTF , MetaTrader 5 için profesyonel, kendi kendine yeten bir diverjans sinyal göstergesidir. Doğrusal zamanlı özel bir ZigZag motorunu, bacak ayrımıyla Williams %R diverjans filtresini, isteğe bağlı pivot koruma katmanını, çoklu zaman dilimi uyum panelini ve otomatik destek/direnci birleştirir — tümü tek dosyada derlenmiştir; harici gösterge, kütüp

Hangi tarafı tutacağına karar vermeden önce paranın nereye gittiğini soran bir takip eden zarar durdur. Alpha Trend MTF takibini ATR üzerine kurar ve tarafı para akışına bıraktıktan sonra sinyallerini çizginin iki mum önceki kendi kopyasıyla kesişmesinden alır, ki sıradan takip eden durdurmaları silkeleyen bir testerede onu sakin tutan da budur. Üst zaman diliminin sinyalleri her grafiğe çizilebilir ve yalnızca kapanmış üst mumlar okunur. Ücretsizdir: deneme süresi yok, kilitli işlev yok, yüksel
FREE

IRONFRAME SMC GOLD MT5 Smart Money Concepts, Piyasa Yapısı, Likidite Haritalama ve Deterministik Günlük Likidite Çekimi ÜRÜNE GENEL BAKIŞ Ironframe SMC Gold MT5, MetaTrader 5 için çok katmanlı bir özel göstergedir ve öncelikli olarak XAUUSD ile altın odaklı intraday analiz için tasarlanmıştır. Smart Money Concepts, order block'lar, arz ve talep, premium/discount konumlandırma, likidite süpürmeleri, diverjans, tükeniş, absorpsiyon, kırılım onayı, üst zaman dilimi bağlamı, mum formasyonu tanıma, p

Combined Fibonacci & Dashboards MT5 Combined Fibonacci and Dashboards, dinamik volatilite tabanlı Fibonacci düzeltme seviyelerini, otomatik fiyat reddi sinyali tespitini ve etkileşimli grafik yönetim panellerini birleştiren MetaTrader 5 için geliştirilmiş çoklu zaman dilimli (multi-timeframe) bir analiz paketidir. Sürekli ayarlama gerektiren manuel Fibonacci ızgaraları çizmek yerine bu gösterge, hareketli orta çizgiler ve volatilite bantlarını kullanarak iki farklı zaman diliminde Fibonacci tren
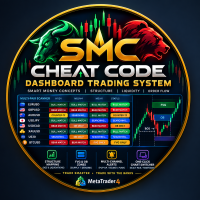
SMC Cheat Code Dashboard Trading System SMC Cheat Code Dashboard Trading System , MetaTrader 4 için geliştirilmiş kurumsal düzeyde bir piyasa yapısı göstergesidir. Smart Money Concepts (SMC) ve ICT yatırımcıları için tasarlanan bu araç; yüksek olasılıklı yapı kırılımlarını, önemli likidite bölgelerini ve birden fazla zaman dilimindeki dinamik emir akışı uyumunu otomatik olarak haritalayarak grafik karmaşasını ve subjektif analizi azaltır. Scalping, Day Trading veya Swing Trading stratejileri kul

Genaro RSI, fiyat ile RSI arasındaki ıraksamaları tespit eden ve osilatör çizgisinin rengini otomatik olarak değiştirerek grafiğin gerçek zamanlı okunmasını kolaylaştıran MetaTrader 5 için teknik bir göstergedir.
Yükseliş ıraksaması tespit edildiğinde (fiyat daha düşük bir dip yapar, RSI daha yüksek bir dip yapar), RSI çizgisi yeşile döner. Düşüş ıraksaması tespit edildiğinde (fiyat daha yüksek bir zirve yapar, RSI daha düşük bir zirve yapar), çizgi pembeye döner. Normal koşullarda çizgi mavi k
FREE

RelicusRoad Signal Cloud, MetaTrader 4 ve MetaTrader 5 için bir bulut göstergesidir; 12 ve 26 periyotluk EMA'lar arasındaki farka göre boyutlandırılmış bir fiyat bandını 21 mum ileriye yansıtır. Bant, kapanışın 3 periyotluk EMA'sı üzerinde merkezlenir ve kenarları kademeli hareket etsin diye yumuşatılır. İleriye kaydırıldığı için bulutun bir kısmı her zaman son mumun sağında durur ve fiyat daha sonra önceden çizilmiş bölüme ulaşır. Nasıl çalışır Gösterge her mum için, kapanışın 12 ve 26 periyotl
FREE

A lot of pivot indicators quietly redraw the levels you already traded. They build today's central pivot range from a bar that's still open, so the "support" you bought at 9am has moved by lunch and the screenshot you saved doesn't match the chart any more. CPR Trend Zones takes the range from the last closed day or week, and once a period has started its lines don't move. It also reads that range for you. At the start of each period it notes which side of the CPR price opened on, draws one leve

3-IN-1 BUNDLE CANDLE TRADING SYSTEM & STRATEGIES
Stop Guessing. Stop Chasing. Start Trading With a Clearer Plan!
PLEASE NOTE THIS, IT'S VERY IMPORTANT!
The Custom Indicators and Utility Expert Advisor That Come With This System Package Are Programmed To Work Only On MT5 Meta-Trader For Now But The Strategies Involved (Clearly Illustrated in the e-book and the videos) Can Be Implemented On MT4, MT5 & Other Trading Platforms.
Are you tired of entering a trade only to watch the market move agai

RelicusRoad Multi Timeframe Levels, MetaTrader 4 ve MetaTrader 5 için bir çoklu zaman dilimi destek ve direnç göstergesidir; H1, H4, D1, W1 ve MN1'in en son salınım tepesini ve dibini, işlem yaptığınız grafikte yatay çizgiler olarak çizer. Bu beş zaman diliminin her biri bir direnç çizgisi ve bir destek çizgisi katkıda bulunur, bu yüzden gün içi bir grafik en fazla on çizgi taşır. Her çizgi geldiği zaman dilimine göre renklendirilir, bu da grafik değiştirmeden yüksek zaman dilimi salınımlarını g
FREE

RelicusRoad Trading Sessions, MetaTrader 4 ve MetaTrader 5 için bir işlem seansı göstergesidir; M1, M5 ve M15 grafiklerinde Tokyo, Londra ve New York seanslarının açılış saatini noktalı dikey çizgilerle işaretler. Her seans açılışı, güncel gün ve önceki hafta içi günler için seansın renginde bir çizgi, küçük döndürülmüş bir ad etiketi ve bir olay işareti olarak gösterilir. Birinin üzerine gelmek seans adını ve açılış saatini gösterir. Gösterge yalnızca açılışları işaretler: seans aralıklarını, ç
FREE

Son dönüşten sonra girenlerin hepsinin ortalama fiyatı, siz bir çıpa koymak zorunda kalmadan çizilir. Anchored VWAP MTF son doğrulanmış salınımı kendisi bulur, oradan hacimle ağırlıklı ortalama fiyatı yürütür ve çevresine sapma bantları koyar, böylece bir yeniden test bir kopuştan ayırt edilir. Hiçbir yerinde takvim yoktur, bu yüzden her sembolde ve aracı kurumun her seans saatinde aynı davranır. Ücretsizdir: deneme süresi yok, kilitli işlev yok, yükseltme sayfası yok. Hacimle ağırlıklı ortalama
FREE

Genel Bakış
MetaTrader 5 için özel olarak tasarlanmış, ultra hafif, yüksek performanslı bir hacim dağılım göstergesi olan Anchored Volume Profile ile profesyonel düzeyde emir akışı (order flow) analizini deneyimleyin. Ham bellek tuvali (Canvas) mekaniği kullanılarak sıfırdan oluşturulan bu gösterge, standart dikdörtgen nesne profillerinde yaygın olarak görülen aşırı CPU gecikmesini (CPU lag), arayüz titremesini ve grafik donmasını tamamen ortadan kaldırır.
Terminalin yerel tik hacmini yönlü ma
FREE

Derinlemesine yumuşatılmış bir trend çizgisi, yirmi sekiz sembolde birden okunur. Cascade WMA Trend Scanner altı aşamalı kaskadı sembol başına dört zaman diliminde çalıştırır, tabloyu en son ne döndüyse ona göre sıralar ve kaç zaman diliminin uyuştuğunu tek sütunda söyler, altındaki grafik giriş için hazırdır. Her 10 satın almada fiyat 10 $ artar. Cascade WMA Trend Scanner tek dosyada iki üründür. Birincisi, önünüzdeki grafiğe çizilen Cascade WMA Trend'in kendisidir: zincirlenmiş çizgi ve dönüşl

MT5 için "Yuvarlak Seviyeler" Forex Göstergesi. - "Yuvarlak Seviyeler" göstergesi, destek/direnç seviyelerini dikkate alan yatırımcılar için olmazsa olmaz bir yardımcı göstergedir. - Fiyat, yuvarlanma seviyelerine büyük ölçüde saygı gösterir - fiyat yuvarlanma seviyelerinden çok sık geri döner. - H4 ve D1 zaman dilimleri için 1000 puanlık Adım kullanın. - H1 ve daha düşük zaman dilimleri için (gün içi işlemler için) 500 puanlık Adım kullanın. - Ayrıca, yuvarlanma seviyeleri, Kâr Al (yuvarlanma

SMC Ultimate MetaTrader 5 için kurumsal düzeyde Smart Money Concepts (SMC) / ICT karar motoru. Piyasa yapısını, likiditeyi, Order Block ve Fair Value Gap bölgelerini analiz eder; bunları skora, kodlanmış duruma ve onaylı Buy/Sell sinyallerine dönüştürür. Tamamen bağımsız çalışır (gösterge paneli, çizimler, uyarılar). Ayrıca kararlı 4 buffer sözleşmesi ve sabit 88 girdi ile güvenilir iCustom entegrasyonu sayesinde EA'ya hazırdır. İlk herkese açık sürüm (version 1.0) lansman fiyatı. Fiyat erken gü

RelicusRoad Action Levels, MetaTrader 4 ve MetaTrader 5 için bir destek ve direnç seviyeleri göstergesidir; ana ve ara fiyat seviyelerinden oluşan bir ızgarayı sembolün kendi volatilitesine ve geçmiş tepkilerine uydurur ve her seviyeyi dokunuş sayısıyla etiketler. Izgara sabit bir pip aralığı veya sade bir yuvarlak sayı ızgarası değildir. Aralığı ve kayması tamamlanmış mumlardan seçilir, her seviye fiyatın çevresinde nasıl davrandığına göre puanlanır ve güncel fiyata yakın yalnızca en güçlü sevi
MetaTrader Mağazası, MetaTrader platformu için uygulama satın almak adına rahat ve güvenli bir ortam sunar. Strateji Sınayıcıda test etmek için Uzman Danışmanların ve göstergelerin ücretsiz demo sürümlerini doğrudan terminalinizden indirin.
Performanslarını izlemek için uygulamaları farklı modlarda test edin ve MQL5.community Ödeme Sistemini kullanarak istediğiniz ürün için ödeme yapın.

Alım-satım fırsatlarını kaçırıyorsunuz:
- Ücretsiz alım-satım uygulamaları
- İşlem kopyalama için 8.000'den fazla sinyal
- Finansal piyasaları keşfetmek için ekonomik haberler
Kayıt
Giriş yap
Web sitesi politikasını ve kullanım şartlarını kabul edersiniz
Hesabınız yoksa, lütfen kaydolun