
Expert Advisor에 지표를 포함하기 위한 기성 템플릿(2부): 볼륨 및 빌 윌리엄스 지표

내용
- 소개
- 볼륨 지표(Volume Indicators)
- Bill Williams의 지표
- 가속 오실레이터(Accelerator Oscillator)
- 악어(Alligator)
- 오썸 오실레이터(Awesome Oscillator)
- 프랙탈(Fractals)
- 게이터 오실레이터(Gator Oscillator)
- 시장 촉진 지수(Market Facilitation Index)
- 대시보드 클래스 개선. 개요
- 결론
소개
이 문서에서는 EA에서 지표를 사용하기 위한 기성 템플릿에 대한 주제를 계속 이어갑니다. 여기서는 EA에 연결하고 거래량과 빌 윌리엄스의 지표를 사용하는 방법에 대해 알아보겠습니다. 이 시리즈의 첫 번째 글에서 만든 대시보드에 지표에서 받은 데이터를 표시하겠습니다. 패널도 개선되었습니다. 이 글의 마지막 부분에서 패널의 변경 사항과 개선 사항에 대해 간략하게 살펴보겠습니다.
우리가 살펴보는 각 지표에 대해 이 문서에서는 사용자 지정 프로그램에서 사용할 수 있는 기성 템플릿을 사용합니다:
- 입력 및 전역 변수,
- 변수 초기화 및 지표 핸들 만들기,
- 초기화,
- 지표에서 EA로 데이터를 수신,
- 획득한 데이터를 대시보드에 표시하는 예제입니다.
볼륨 지표(Volume Indicators)
볼륨 지표는 볼륨을 설명하는 지표입니다. 외환 시장에서 '볼륨'은 기간에 나타난 틱(가격 변동) 수를 의미합니다. 주식 유가증권의 경우 볼륨은 체결된 거래량(계약 또는 금액 기준)을 의미합니다.
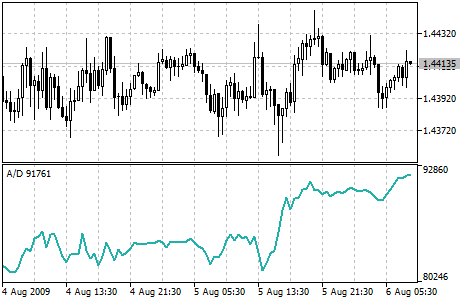
누적/배포(Accumulation/Distribution)
누적/분배 (A/D)는 가격과 볼륨의 변동에 따라 결정됩니다. 볼륨은 가격 변동 시 가중치 역할을 하며 계수(볼륨)가 높을수록 (이 기간 동안) 가격 변동이 지표 값에 미치는 기여도가 커집니다.
사실 이 지표는 더 일반적으로 사용되는 On Balance Volume) 지표의 또다른 버전입니다. 두 가지 모두 각각의 볼륨을 측정하여 가격 변화를 확인하는 데 사용됩니다.
누적/분산 지표가 커지면 특정 종목의 누적(매수)을 의미하며, 볼륨의 압도적인 점유율은 가격의 상승 추세와 관련이 있습니다. 지표가 하락하면 대부분의 거래가 가격 하락 중에 발생하므로 유가증권의 분산(매도)을 의미합니다.
누적/분산 지표와 유가증권 가격 사이의 차이는 다가오는 가격의 변화를 나타냅니다. 일반적으로 이러한 차이가 발생하는 경우 가격 추세는 지표가 움직이는 방향으로 이동합니다. 따라서 지표가 상승하고 있고 유가 증권의 가격이 하락하고 있다면 가격의 반전이 기대됩니다.
매개변수
iAD() 함수는 지표 핸들을 만드는 데 사용됩니다:
누적/분배 지표의 핸들을 반환합니다. 버퍼는 하나만 있습니다.
int  iAD(
   string               symbol,             // symbol name
   ENUM_TIMEFRAMES      period,             // period
   ENUM_APPLIED_VOLUME  applied_volume      // type of volume used for calculations
   );
symbol
[in] 금융 상품의 심볼 이름으로 지표 계산에 이 심볼의 데이터를 사용합니다. NULL은 현재 심볼을 의미합니다.
period
[in] 기간 값은 ENUM_TIMEFRAMES 열거형 값 중 하나이며 0은 현재 기간을 의미합니다.
applied_volume
[in] 사용한 볼륨. ENUM_APPLIED_VOLUME.
지정된 기술 지표의 핸들을 반환합니다. 실패하면 INVALID_HANDLE을 반환합니다. 사용하지 않는 지표에서 컴퓨터 메모리를 확보하려면 지표 핸들이 전달되는 IndicatorRelease() 를 사용하세요.
EA에서 입력 및 전역 변수를 선언하여 지표를 만듭니다:
//+------------------------------------------------------------------+
//|                                                 TestVolumeAD.mq5 |
//|                                  Copyright 2023, MetaQuotes Ltd. |
//|                                             https://www.mql5.com |
//+------------------------------------------------------------------+
#property copyright "Copyright 2023, MetaQuotes Ltd."
#property link      "https://www.mql5.com"
#property version   "1.00"
//--- enums
enum ENUM_LINE_STATE
  {
   LINE_STATE_NONE,        // Undefined state
   LINE_STATE_UP,          // Upward
   LINE_STATE_DOWN,        // Downward
   LINE_STATE_TURN_UP,     // Upward reversal
   LINE_STATE_TURN_DOWN,   // Downward reversal
   LINE_STATE_STOP_UP,     // Upward stop
   LINE_STATE_STOP_DOWN,   // Downward stop
   LINE_STATE_ABOVE,       // Above value
   LINE_STATE_UNDER,       // Below value
   LINE_STATE_CROSS_UP,    // Crossing value upwards
   LINE_STATE_CROSS_DOWN,  // Crossing value downwards
   LINE_STATE_TOUCH_BELOW, // Touching value from below
   LINE_STATE_TOUCH_ABOVE, // Touch value from above
   LINE_STATE_EQUALS,      // Equal to value
  };
//--- input parameters
input ENUM_APPLIED_VOLUME  InpVolume   =  VOLUME_TICK;   /* Applied Volume */
//--- global variables
int      handle=INVALID_HANDLE;  // Indicator handle
int      ind_digits=0;           // Number of decimal places in the indicator values
string   ind_title;              // Indicator description
ENUM_LINE_STATE 열거형은 지표 선의 상태(다른 지표 선 또는 모든 레벨의 선에 대한 모양과 위치)를 간단하게 얻기 위해 만들어졌습니다.
열거형에 대한 자세한 내용은 이전 글의 ATR 매개변수 섹션에서 확인하세요.
EA에서 대시보드를 사용할 때는 전역 변수를 선언하고 패널 클래스 파일을 포함하세요:
//+------------------------------------------------------------------+
//|                                                 TestVolumeAD.mq5 |
//|                                  Copyright 2023, MetaQuotes Ltd. |
//|                                             https://www.mql5.com |
//+------------------------------------------------------------------+
#property copyright "Copyright 2023, MetaQuotes Ltd."
#property link      "https://www.mql5.com"
#property version   "1.00"
//--- includes
#include <Dashboard\Dashboard.mqh>
//--- enums
enum ENUM_LINE_STATE
  {
   LINE_STATE_NONE,        // Undefined state
   LINE_STATE_UP,          // Upward
   LINE_STATE_DOWN,        // Downward
   LINE_STATE_TURN_UP,     // Upward reversal
   LINE_STATE_TURN_DOWN,   // Downward reversal
   LINE_STATE_STOP_UP,     // Upward stop
   LINE_STATE_STOP_DOWN,   // Downward stop
   LINE_STATE_ABOVE,       // Above value
   LINE_STATE_UNDER,       // Below value
   LINE_STATE_CROSS_UP,    // Crossing value upwards
   LINE_STATE_CROSS_DOWN,  // Crossing value downwards
   LINE_STATE_TOUCH_BELOW, // Touching value from below
   LINE_STATE_TOUCH_ABOVE, // Touch value from above
   LINE_STATE_EQUALS,      // Equal to value
  };
//--- input parameters
input ENUM_APPLIED_VOLUME  InpVolume   =  VOLUME_TICK;   /* Applied Volume */
//--- global variables
int      handle=INVALID_HANDLE;  // Indicator handle
int      ind_digits=0;           // Number of decimal places in the indicator values
string   ind_title;              // Indicator description
//--- variables for the panel
int      mouse_bar_index;        // Index of the bar the data is taken from
CDashboard *panel=NULL;          // Pointer to the panel object
초기화
지표의 전역 변수 값을 설정하고 핸들을 생성합니다:
//+------------------------------------------------------------------+
//| Expert initialization function                                   |
//+------------------------------------------------------------------+
int OnInit()
  {
//--- create timer
   EventSetTimer(60);

//--- Indicator
//--- Set the indicator name and the number of decimal places
   ind_title="A/D";
   ind_digits=0;
//--- Create indicator handle
   ResetLastError();
   handle=iAD(Symbol(),PERIOD_CURRENT,InpVolume);
   if(handle==INVALID_HANDLE)
     {
      PrintFormat("%s: Failed to create indicator handle %s. Error %ld",__FUNCTION__,ind_title,GetLastError());
      return INIT_FAILED;
     }

//--- Successful initialization
   return(INIT_SUCCEEDED);
  }
EA에 대시보드를 사용하는 기능이 있는 경우 여기에서 생성하세요:
//+------------------------------------------------------------------+
//| Expert initialization function                                   |
//+------------------------------------------------------------------+
int OnInit()
  {
//--- create timer
   EventSetTimer(60);

//--- Indicator
//--- Set the indicator name and the number of decimal places
   ind_title="A/D";
   ind_digits=0;
//--- Create indicator handle
   ResetLastError();
   handle=iAD(Symbol(),PERIOD_CURRENT,InpVolume);
   if(handle==INVALID_HANDLE)
     {
      PrintFormat("%s: Failed to create indicator handle %s. Error %ld",__FUNCTION__,ind_title,GetLastError());
      return INIT_FAILED;
     }

//--- Dashboard
//--- Create the panel
   panel=new CDashboard(1,20,20,199,225);
   if(panel==NULL)
     {
      Print("Error. Failed to create panel object");
      return INIT_FAILED;
     }
//--- Set font parameters
   panel.SetFontParams("Calibri",9);
//--- Display the panel with the "Symbol, Timeframe description" header text
   panel.View(Symbol()+", "+StringSubstr(EnumToString(Period()),7));
//--- Create a table with ID 0 to display bar data in it
   panel.CreateNewTable(0);
//--- Draw a table with ID 0 on the panel background
   panel.DrawGrid(0,2,20,6,2,18,97);

//--- Create a table with ID 1 to display indicator data in it
   panel.CreateNewTable(1);
//--- Get the Y2 table coordinate with ID 0 and
//--- set the Y1 coordinate for the table with ID 1
   int y1=panel.TableY2(0)+22;
//--- Draw a table with ID 1 on the panel background
   panel.DrawGrid(1,2,y1,3,2,18,97);

//--- Display tabular data in the journal
   panel.GridPrint(0,2);
   panel.GridPrint(1,2);
//--- Initialize the variable with the index of the mouse cursor bar
   mouse_bar_index=0;
//--- Display the data of the current bar on the panel
   DrawData(mouse_bar_index,TimeCurrent());

//--- Successful initialization
   return(INIT_SUCCEEDED);
  }
//+------------------------------------------------------------------+
초기화 해제
EA OnDeinit() 핸들에서 지표 핸들을 릴리즈합니다:
//+------------------------------------------------------------------+
//| Expert deinitialization function                                 |
//+------------------------------------------------------------------+
void OnDeinit(const int reason)
  {
//--- destroy timer
   EventKillTimer();

//--- Release handle of the indicator
   ResetLastError();
   if(!IndicatorRelease(handle))
      PrintFormat("%s: IndicatorRelease failed. Error %ld",__FUNCTION__,GetLastError());
//--- Clear all comments on the chart
   Comment("");
  }
대시보드를 사용할 때 생성된 대시보드 객체가 제거됩니다:
//+------------------------------------------------------------------+
//| Expert deinitialization function                                 |
//+------------------------------------------------------------------+
void OnDeinit(const int reason)
  {
//--- destroy timer
   EventKillTimer();

//--- Release handle of the indicator
   ResetLastError();
   if(!IndicatorRelease(handle))
      PrintFormat("%s: IndicatorRelease failed. Error %ld",__FUNCTION__,GetLastError());
//--- Clear all comments on the chart
   Comment("");

//--- If the panel object exists, delete it
   if(panel!=NULL)
      delete panel;
  }
데이터 검색
지표 핸들로 데이터를 가져오는 일반적인 함수는 다음과 같습니다. 함수들은 오실레이터를 EA에 연결하는 방법에 대한 문서에서 검토했습니다. 제시된 함수는 사용자 지정 프로그램에서 '있는 그대로' 사용할 수 있습니다:
//+------------------------------------------------------------------+
//| Return the indicator data on the specified bar                   |
//+------------------------------------------------------------------+
double IndicatorValue(const int ind_handle,const int index,const int buffer_num)
  {
   double array[1]={0};
   ResetLastError();
   if(CopyBuffer(ind_handle,buffer_num,index,1,array)!=1)
     {
      PrintFormat("%s: CopyBuffer failed. Error %ld",__FUNCTION__,GetLastError());
      return EMPTY_VALUE;
     }
   return array[0];
  }
//+------------------------------------------------------------------+
//| Return the state of the indicator line                           |
//+------------------------------------------------------------------+
ENUM_LINE_STATE LineState(const int ind_handle,const int index,const int buffer_num)
  {
//--- Get the values of the indicator line with the shift (0,1,2) relative to the passed index
   const double value0=IndicatorValue(ind_handle,index,  buffer_num);
   const double value1=IndicatorValue(ind_handle,index+1,buffer_num);
   const double value2=IndicatorValue(ind_handle,index+2,buffer_num);
//--- If at least one of the values could not be obtained, return an undefined value
   if(value0==EMPTY_VALUE || value1==EMPTY_VALUE || value2==EMPTY_VALUE)
      return LINE_STATE_NONE;
//--- Line upward reversal (value2>value1 && value0>value1)
   if(NormalizeDouble(value2-value1,ind_digits)>0 && NormalizeDouble(value0-value1,ind_digits)>0)
      return LINE_STATE_TURN_UP;
//--- Line upward direction (value2<=value1 && value0>value1)
   else if(NormalizeDouble(value2-value1,ind_digits)<=0 && NormalizeDouble(value0-value1,ind_digits)>0)
      return LINE_STATE_UP;
//--- Line upward stop (value2<=value1 && value0==value1)
   else if(NormalizeDouble(value2-value1,ind_digits)<=0 && NormalizeDouble(value0-value1,ind_digits)==0)
      return LINE_STATE_STOP_UP;
//--- Line downward reversal (value2<value1 && value0<value1)
   if(NormalizeDouble(value2-value1,ind_digits)<0 && NormalizeDouble(value0-value1,ind_digits)<0)
      return LINE_STATE_TURN_DOWN;
//--- Line downward direction (value2>=value1 && value0<value1)
   else if(NormalizeDouble(value2-value1,ind_digits)>=0 && NormalizeDouble(value0-value1,ind_digits)<0)
      return LINE_STATE_DOWN;
//--- Line downward stop (value2>=value1 && value0==value1)
   else if(NormalizeDouble(value2-value1,ind_digits)>=0 && NormalizeDouble(value0-value1,ind_digits)==0)
      return LINE_STATE_STOP_DOWN;
//--- Undefined state
   return LINE_STATE_NONE;
  }
//+------------------------------------------------------------------+
//| Return the state of the line relative to the specified level     |
//+------------------------------------------------------------------+
ENUM_LINE_STATE LineStateRelative(const int ind_handle,const int index,const int buffer_num,const double level0,const double level1=EMPTY_VALUE)
  {
//--- Get the values of the indicator line with the shift (0,1) relative to the passed index
   const double value0=IndicatorValue(ind_handle,index,  buffer_num);
   const double value1=IndicatorValue(ind_handle,index+1,buffer_num);
//--- If at least one of the values could not be obtained, return an undefined value
   if(value0==EMPTY_VALUE || value1==EMPTY_VALUE)
      return LINE_STATE_NONE;
//--- Define the second level to compare
   double level=(level1==EMPTY_VALUE ? level0 : level1);
//--- The line is below the level (value1<level && value0<level0)
   if(NormalizeDouble(value1-level,ind_digits)<0 && NormalizeDouble(value0-level0,ind_digits)<0)
      return LINE_STATE_UNDER;
//--- The line is above the level (value1>level && value0>level0)
   if(NormalizeDouble(value1-level,ind_digits)>0 && NormalizeDouble(value0-level0,ind_digits)>0)
      return LINE_STATE_ABOVE;
//--- The line crossed the level upwards (value1<=level && value0>level0)
   if(NormalizeDouble(value1-level,ind_digits)<=0 && NormalizeDouble(value0-level0,ind_digits)>0)
      return LINE_STATE_CROSS_UP;
//--- The line crossed the level downwards (value1>=level && value0<level0)
   if(NormalizeDouble(value1-level,ind_digits)>=0 && NormalizeDouble(value0-level0,ind_digits)<0)
      return LINE_STATE_CROSS_DOWN;
//--- The line touched the level from below (value1<level0 && value0==level0)
   if(NormalizeDouble(value1-level,ind_digits)<0 && NormalizeDouble(value0-level0,ind_digits)==0)
      return LINE_STATE_TOUCH_BELOW;
//--- The line touched the level from above (value1>level0 && value0==level0)
   if(NormalizeDouble(value1-level,ind_digits)>0 && NormalizeDouble(value0-level0,ind_digits)==0)
      return LINE_STATE_TOUCH_BELOW;
//--- Line is equal to the level value (value1==level0 && value0==level0)
   if(NormalizeDouble(value1-level,ind_digits)==0 && NormalizeDouble(value0-level0,ind_digits)==0)
      return LINE_STATE_EQUALS;
//--- Undefined state
   return LINE_STATE_NONE;
  }
//+------------------------------------------------------------------+
//| Return the indicator line state description                      |
//+------------------------------------------------------------------+
string LineStateDescription(const ENUM_LINE_STATE state)
  {
   switch(state)
     {
      case LINE_STATE_UP         :  return "Up";
      case LINE_STATE_STOP_UP    :  return "Stop Up";
      case LINE_STATE_TURN_UP    :  return "Turn Up";
      case LINE_STATE_DOWN       :  return "Down";
      case LINE_STATE_STOP_DOWN  :  return "Stop Down";
      case LINE_STATE_TURN_DOWN  :  return "Turn Down";
      case LINE_STATE_ABOVE      :  return "Above level";
      case LINE_STATE_UNDER      :  return "Under level";
      case LINE_STATE_CROSS_UP   :  return "Crossing Up";
      case LINE_STATE_CROSS_DOWN :  return "Crossing Down";
      case LINE_STATE_TOUCH_BELOW:  return "Touch from Below";
      case LINE_STATE_TOUCH_ABOVE:  return "Touch from Above";
      case LINE_STATE_EQUALS     :  return "Equals";
      default                    :  return "Unknown";
     }
  }
대시보드를 사용할 때 함수를 사용하여 패널에 데이터가 표시됩니다:
//+------------------------------------------------------------------+
//| Display data from the specified timeseries index to the panel    |
//+------------------------------------------------------------------+
void DrawData(const int index,const datetime time)
  {
//--- Declare the variables to receive data in them
   MqlTick  tick={0};
   MqlRates rates[1];

//--- Exit if unable to get the current prices
   if(!SymbolInfoTick(Symbol(),tick))
      return;
//--- Exit if unable to get the bar data by the specified index
   if(CopyRates(Symbol(),PERIOD_CURRENT,index,1,rates)!=1)
      return;

//--- Set font parameters for bar and indicator data headers
   int  size=0;
   uint flags=0;
   uint angle=0;
   string name=panel.FontParams(size,flags,angle);
   panel.SetFontParams(name,9,FW_BOLD);
   panel.DrawText("Bar data ["+(string)index+"]",3,panel.TableY1(0)-16,clrMaroon,panel.Width()-6);
   panel.DrawText("Indicator data ["+(string)index+"]",3,panel.TableY1(1)-16,clrGreen,panel.Width()-6);
//--- Set font parameters for bar and indicator data
   panel.SetFontParams(name,9);

//--- Display the data of the specified bar in table 0 on the panel
   panel.DrawText("Date",  panel.CellX(0,0,0)+2, panel.CellY(0,0,0)+2); panel.DrawText(TimeToString(  rates[0].time,TIME_DATE),     panel.CellX(0,0,1)+2, panel.CellY(0,0,1)+2,clrNONE,90);
   panel.DrawText("Time",  panel.CellX(0,1,0)+2, panel.CellY(0,1,0)+2); panel.DrawText(TimeToString(  rates[0].time,TIME_MINUTES),  panel.CellX(0,1,1)+2, panel.CellY(0,1,1)+2,clrNONE,90);
   panel.DrawText("Open",  panel.CellX(0,2,0)+2, panel.CellY(0,2,0)+2); panel.DrawText(DoubleToString(rates[0].open,Digits()),      panel.CellX(0,2,1)+2, panel.CellY(0,2,1)+2,clrNONE,90);
   panel.DrawText("High",  panel.CellX(0,3,0)+2, panel.CellY(0,3,0)+2); panel.DrawText(DoubleToString(rates[0].high,Digits()),      panel.CellX(0,3,1)+2, panel.CellY(0,3,1)+2,clrNONE,90);
   panel.DrawText("Low",   panel.CellX(0,4,0)+2, panel.CellY(0,4,0)+2); panel.DrawText(DoubleToString(rates[0].low,Digits()),       panel.CellX(0,4,1)+2, panel.CellY(0,4,1)+2,clrNONE,90);
   panel.DrawText("Close", panel.CellX(0,5,0)+2, panel.CellY(0,5,0)+2); panel.DrawText(DoubleToString(rates[0].close,Digits()),     panel.CellX(0,5,1)+2, panel.CellY(0,5,1)+2,clrNONE,90);

//--- Display the indicator data from the specified bar on the panel in table 1
   panel.DrawText(ind_title, panel.CellX(1,0,0)+2, panel.CellY(1,0,0)+2);
   double value=IndicatorValue(handle,index,0);
   string value_str=(value!=EMPTY_VALUE ? DoubleToString(value,ind_digits) : "");
   panel.DrawText(value_str,panel.CellX(1,0,1)+2,panel.CellY(1,0,1)+2,clrNONE,90);

//--- Display a description of the indicator line state
   panel.DrawText("Line state", panel.CellX(1,1,0)+2, panel.CellY(1,1,0)+2);
   ENUM_LINE_STATE state=LineState(handle,index,0);
   panel.DrawText(LineStateDescription(state),panel.CellX(1,1,1)+2,panel.CellY(1,1,1)+2,clrNONE,90);

//--- Redraw the chart to immediately display all changes on the panel
   ChartRedraw(ChartID());
  }
또한 대시보드를 사용할 때 패널 이벤트 핸들러는 OnChartEvent() EA 이벤트 핸들러에서 호출되며 커서 아래의 바 인덱스를 수신하는 이벤트도 처리됩니다:
//+------------------------------------------------------------------+
//| ChartEvent function                                              |
//+------------------------------------------------------------------+
void OnChartEvent(const int id,
                  const long &lparam,
                  const double &dparam,
                  const string &sparam)
  {
//--- Handling the panel
//--- Call the panel event handler
   panel.OnChartEvent(id,lparam,dparam,sparam);

//--- If the cursor moves or a click is made on the chart
   if(id==CHARTEVENT_MOUSE_MOVE || id==CHARTEVENT_CLICK)
     {
      //--- Declare the variables to record time and price coordinates in them
      datetime time=0;
      double price=0;
      int wnd=0;
      //--- If the cursor coordinates are converted to date and time
      if(ChartXYToTimePrice(ChartID(),(int)lparam,(int)dparam,wnd,time,price))
        {
         //--- write the bar index where the cursor is located to a global variable
         mouse_bar_index=iBarShift(Symbol(),PERIOD_CURRENT,time);
         //--- Display the bar data under the cursor on the panel
         DrawData(mouse_bar_index,time);
        }
     }

//--- If we received a custom event, display the appropriate message in the journal
   if(id>CHARTEVENT_CUSTOM)
     {
      //--- Here we can implement handling a click on the close button on the panel
      PrintFormat("%s: Event id=%ld, object id (lparam): %lu, event message (sparam): %s",__FUNCTION__,id,lparam,sparam);
     }
  }
EA를 컴파일하고 차트에서 실행하면 패널에서 지표 값과 선의 상태를 모니터링할 수 있습니다:

이 문서에 첨부된 파일에서 TestVolumeAD.mq5 테스트 EA를 확인할 수 있습니다.
자금 흐름 지수(Money Flow Index)
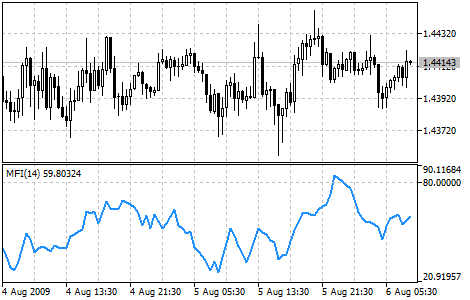
자금 흐름 지수 (MFI)는 자금이 증권에 투자되었다가 인출되는 비율을 나타내는 기술 지표입니다. 지표의 구성과 해석은 상대 강도 지수와 유사하지만 MFI에서는 볼륨이 중요하다는 점만 다릅니다.
자금 흐름 지수를 분석할 때는 다음 사항을 고려해야 합니다:
- 지표와 가격 움직임 사이의 차이. MFI가 하락하는 동안 가격이 상승하면(또는 그 반대의 경우) 가격 전환의 가능성이 높습니다;
- 자금 흐름 지수 값이 80을 넘거나 20 미만이면 시장의 잠재적 정점 또는 바닥을 의미합니다.
매개변수
iMFI() 함수는 지표 핸들을 만드는 데 사용됩니다:
int  iMFI(
   string               symbol,             // symbol name
   ENUM_TIMEFRAMES      period,             // period
   int                  ma_period,          // averaging period
   ENUM_APPLIED_VOLUME  applied_volume      // type of volume used for calculations
   );
symbol
[in] 금융 상품의 심볼 이름으로 지표 계산에 이 심볼의 데이터를 사용합니다. NULL은 현재 심볼을 의미합니다.
period
[in] 기간 값은 ENUM_TIMEFRAMES 열거형 값 중 하나이며 0은 현재 기간을 의미합니다.
ma_period
[in] 지표 계산을 위한 기간(바의 수).
applied_volume
[in] Used volume. ENUM_APPLIED_VOLUME.
지정된 기술 지표의 핸들을 반환합니다. 실패하면 INVALID_HANDLE을 반환합니다. 사용하지 않는 지표에서 컴퓨터 메모리를 확보하려면 지표 핸들이 전달되는 IndicatorRelease() 를 사용하세요.
EA에서 입력 및 전역 변수를 선언하여 지표를 만듭니다:
//+------------------------------------------------------------------+
//|                                                TestVolumeMFI.mq5 |
//|                                  Copyright 2023, MetaQuotes Ltd. |
//|                                             https://www.mql5.com |
//+------------------------------------------------------------------+
#property copyright "Copyright 2023, MetaQuotes Ltd."
#property link      "https://www.mql5.com"
#property version   "1.00"
//--- enums
enum ENUM_LINE_STATE
  {
   LINE_STATE_NONE,        // Undefined state
   LINE_STATE_UP,          // Upward
   LINE_STATE_DOWN,        // Downward
   LINE_STATE_TURN_UP,     // Upward reversal
   LINE_STATE_TURN_DOWN,   // Downward reversal
   LINE_STATE_STOP_UP,     // Upward stop
   LINE_STATE_STOP_DOWN,   // Downward stop
   LINE_STATE_ABOVE,       // Above value
   LINE_STATE_UNDER,       // Below value
   LINE_STATE_CROSS_UP,    // Crossing value upwards
   LINE_STATE_CROSS_DOWN,  // Crossing value downwards
   LINE_STATE_TOUCH_BELOW, // Touching value from below
   LINE_STATE_TOUCH_ABOVE, // Touch value from above
   LINE_STATE_EQUALS,      // Equal to value
  };
//--- input parameters
input uint                 InpPeriod   =  14;            /* Period         */
input ENUM_APPLIED_VOLUME  InpVolume   =  VOLUME_TICK;   /* Applied Volume */
input double               InpOverbough=  80;            /* Overbough level*/
input double               InpOversold =  20;            /* Oversold level */
//--- global variables
int      handle=INVALID_HANDLE;  // Indicator handle
int      period=0;               // RSI calculation period
int      ind_digits=0;           // Number of decimal places in the indicator values
double   overbough=0;            // Overbought level
double   oversold=0;             // Oversold level
string   ind_title;              // Indicator description
EA에서 대시보드를 사용할 때는 전역 변수를 선언하고 패널 클래스 파일을 포함하세요:
//+------------------------------------------------------------------+
//|                                                TestVolumeMFI.mq5 |
//|                                  Copyright 2023, MetaQuotes Ltd. |
//|                                             https://www.mql5.com |
//+------------------------------------------------------------------+
#property copyright "Copyright 2023, MetaQuotes Ltd."
#property link      "https://www.mql5.com"
#property version   "1.00"
//--- includes
#include <Dashboard\Dashboard.mqh>
//--- enums
enum ENUM_LINE_STATE
  {
   LINE_STATE_NONE,        // Undefined state
   LINE_STATE_UP,          // Upward
   LINE_STATE_DOWN,        // Downward
   LINE_STATE_TURN_UP,     // Upward reversal
   LINE_STATE_TURN_DOWN,   // Downward reversal
   LINE_STATE_STOP_UP,     // Upward stop
   LINE_STATE_STOP_DOWN,   // Downward stop
   LINE_STATE_ABOVE,       // Above value
   LINE_STATE_UNDER,       // Below value
   LINE_STATE_CROSS_UP,    // Crossing value upwards
   LINE_STATE_CROSS_DOWN,  // Crossing value downwards
   LINE_STATE_TOUCH_BELOW, // Touching value from below
   LINE_STATE_TOUCH_ABOVE, // Touch value from above
   LINE_STATE_EQUALS,      // Equal to value
  };
//--- input parameters
input uint                 InpPeriod   =  14;            /* Period         */
input ENUM_APPLIED_VOLUME  InpVolume   =  VOLUME_TICK;   /* Applied Volume */
input double               InpOverbough=  80;            /* Overbough level*/
input double               InpOversold =  20;            /* Oversold level */
//--- global variables
int      handle=INVALID_HANDLE;  // Indicator handle
int      period=0;               // RSI calculation period
int      ind_digits=0;           // Number of decimal places in the indicator values
double   overbough=0;            // Overbought level
double   oversold=0;             // Oversold level
string   ind_title;              // Indicator description
//--- variables for the panel
int      mouse_bar_index;        // Index of the bar the data is taken from
CDashboard *panel=NULL;          // Pointer to the panel object
초기화
지표의 전역 변수 값을 설정하고 핸들을 생성합니다:
//+------------------------------------------------------------------+
//| Expert initialization function                                   |
//+------------------------------------------------------------------+
int OnInit()
  {
//--- create timer
   EventSetTimer(60);

//--- Indicator
//--- Set and adjust the calculation period and levels if necessary
   period=int(InpPeriod<1 ? 14 : InpPeriod);
   overbough=InpOverbough;
   oversold=(InpOversold>=overbough ? overbough-0.01 : InpOversold);
//--- Set the indicator name and the number of decimal places
   ind_title=StringFormat("MFI(%lu)",period);
   ind_digits=Digits();
//--- Create indicator handle
   ResetLastError();
   handle=iMFI(Symbol(),PERIOD_CURRENT,period,InpVolume);
   if(handle==INVALID_HANDLE)
     {
      PrintFormat("%s: Failed to create indicator handle %s. Error %ld",__FUNCTION__,ind_title,GetLastError());
      return INIT_FAILED;
     }

//--- Successful initialization
   return(INIT_SUCCEEDED);
  }
EA에 대시보드를 사용하는 기능이 있는 경우 여기에서 생성하세요:
//+------------------------------------------------------------------+
//| Expert initialization function                                   |
//+------------------------------------------------------------------+
int OnInit()
  {
//--- create timer
   EventSetTimer(60);

//--- Indicator
//--- Set and adjust the calculation period and levels if necessary
   period=int(InpPeriod<1 ? 14 : InpPeriod);
   overbough=InpOverbough;
   oversold=(InpOversold>=overbough ? overbough-0.01 : InpOversold);
//--- Set the indicator name and the number of decimal places
   ind_title=StringFormat("MFI(%lu)",period);
   ind_digits=Digits();
//--- Create indicator handle
   ResetLastError();
   handle=iMFI(Symbol(),PERIOD_CURRENT,period,InpVolume);
   if(handle==INVALID_HANDLE)
     {
      PrintFormat("%s: Failed to create indicator handle %s. Error %ld",__FUNCTION__,ind_title,GetLastError());
      return INIT_FAILED;
     }

//--- Dashboard
//--- Create the panel
   panel=new CDashboard(1,20,20,229,243);
   if(panel==NULL)
     {
      Print("Error. Failed to create panel object");
      return INIT_FAILED;
     }
//--- Set font parameters
   panel.SetFontParams("Calibri",9);
//--- Display the panel with the "Symbol, Timeframe description" header text
   panel.View(Symbol()+", "+StringSubstr(EnumToString(Period()),7));
//--- Create a table with ID 0 to display bar data in it
   panel.CreateNewTable(0);
//--- Draw a table with ID 0 on the panel background
   panel.DrawGrid(0,2,20,6,2,18,112);

//--- Create a table with ID 1 to display indicator data in it
   panel.CreateNewTable(1);
//--- Get the Y2 table coordinate with ID 0 and
//--- set the Y1 coordinate for the table with ID 1
   int y1=panel.TableY2(0)+22;
//--- Draw a table with ID 1 on the panel background
   panel.DrawGrid(1,2,y1,4,2,18,112);

//--- Display tabular data in the journal
   panel.GridPrint(0,2);
   panel.GridPrint(1,2);
//--- Initialize the variable with the index of the mouse cursor bar
   mouse_bar_index=0;
//--- Display the data of the current bar on the panel
   DrawData(mouse_bar_index,TimeCurrent());

//--- Successful initialization
   return(INIT_SUCCEEDED);
  }
초기화 해제
EA OnDeinit() 핸들에서 지표 핸들을 릴리즈합니다:
//+------------------------------------------------------------------+
//| Expert deinitialization function                                 |
//+------------------------------------------------------------------+
void OnDeinit(const int reason)
  {
//--- destroy timer
   EventKillTimer();

//--- Release handle of the indicator
   ResetLastError();
   if(!IndicatorRelease(handle))
      PrintFormat("%s: IndicatorRelease failed. Error %ld",__FUNCTION__,GetLastError());
//--- Clear all comments on the chart
   Comment("");
  }
대시보드를 사용할 때 생성된 대시보드 객체가 제거됩니다:
//+------------------------------------------------------------------+
//| Expert deinitialization function                                 |
//+------------------------------------------------------------------+
void OnDeinit(const int reason)
  {
//--- destroy timer
   EventKillTimer();

//--- Release handle of the indicator
   ResetLastError();
   if(!IndicatorRelease(handle))
      PrintFormat("%s: IndicatorRelease failed. Error %ld",__FUNCTION__,GetLastError());
//--- Clear all comments on the chart
   Comment("");

//--- If the panel object exists, delete it
   if(panel!=NULL)
      delete panel;
  }
데이터 검색
지표 핸들로 데이터를 가져오는 일반적인 함수는 다음과 같습니다. 함수들은 오실레이터를 EA에 연결하는 방법에 대한 문서에서 검토했습니다. 제시된 함수는 사용자 지정 프로그램에서 '있는 그대로' 사용할 수 있습니다:
//+------------------------------------------------------------------+
//| Return the indicator data on the specified bar                   |
//+------------------------------------------------------------------+
double IndicatorValue(const int ind_handle,const int index,const int buffer_num)
  {
   double array[1]={0};
   ResetLastError();
   if(CopyBuffer(ind_handle,buffer_num,index,1,array)!=1)
     {
      PrintFormat("%s: CopyBuffer failed. Error %ld",__FUNCTION__,GetLastError());
      return EMPTY_VALUE;
     }
   return array[0];
  }
//+------------------------------------------------------------------+
//| Return the state of the indicator line                           |
//+------------------------------------------------------------------+
ENUM_LINE_STATE LineState(const int ind_handle,const int index,const int buffer_num)
  {
//--- Get the values of the indicator line with the shift (0,1,2) relative to the passed index
   const double value0=IndicatorValue(ind_handle,index,  buffer_num);
   const double value1=IndicatorValue(ind_handle,index+1,buffer_num);
   const double value2=IndicatorValue(ind_handle,index+2,buffer_num);
//--- If at least one of the values could not be obtained, return an undefined value
   if(value0==EMPTY_VALUE || value1==EMPTY_VALUE || value2==EMPTY_VALUE)
      return LINE_STATE_NONE;
//--- Line upward reversal (value2>value1 && value0>value1)
   if(NormalizeDouble(value2-value1,ind_digits)>0 && NormalizeDouble(value0-value1,ind_digits)>0)
      return LINE_STATE_TURN_UP;
//--- Line upward direction (value2<=value1 && value0>value1)
   else if(NormalizeDouble(value2-value1,ind_digits)<=0 && NormalizeDouble(value0-value1,ind_digits)>0)
      return LINE_STATE_UP;
//--- Line upward stop (value2<=value1 && value0==value1)
   else if(NormalizeDouble(value2-value1,ind_digits)<=0 && NormalizeDouble(value0-value1,ind_digits)==0)
      return LINE_STATE_STOP_UP;
//--- Line downward reversal (value2<value1 && value0<value1)
   if(NormalizeDouble(value2-value1,ind_digits)<0 && NormalizeDouble(value0-value1,ind_digits)<0)
      return LINE_STATE_TURN_DOWN;
//--- Line downward direction (value2>=value1 && value0<value1)
   else if(NormalizeDouble(value2-value1,ind_digits)>=0 && NormalizeDouble(value0-value1,ind_digits)<0)
      return LINE_STATE_DOWN;
//--- Line downward stop (value2>=value1 && value0==value1)
   else if(NormalizeDouble(value2-value1,ind_digits)>=0 && NormalizeDouble(value0-value1,ind_digits)==0)
      return LINE_STATE_STOP_DOWN;
//--- Undefined state
   return LINE_STATE_NONE;
  }
//+------------------------------------------------------------------+
//| Return the state of the line relative to the specified level     |
//+------------------------------------------------------------------+
ENUM_LINE_STATE LineStateRelative(const int ind_handle,const int index,const int buffer_num,const double level0,const double level1=EMPTY_VALUE)
  {
//--- Get the values of the indicator line with the shift (0,1) relative to the passed index
   const double value0=IndicatorValue(ind_handle,index,  buffer_num);
   const double value1=IndicatorValue(ind_handle,index+1,buffer_num);
//--- If at least one of the values could not be obtained, return an undefined value
   if(value0==EMPTY_VALUE || value1==EMPTY_VALUE)
      return LINE_STATE_NONE;
//--- Define the second level to compare
   double level=(level1==EMPTY_VALUE ? level0 : level1);
//--- The line is below the level (value1<level && value0<level0)
   if(NormalizeDouble(value1-level,ind_digits)<0 && NormalizeDouble(value0-level0,ind_digits)<0)
      return LINE_STATE_UNDER;
//--- The line is above the level (value1>level && value0>level0)
   if(NormalizeDouble(value1-level,ind_digits)>0 && NormalizeDouble(value0-level0,ind_digits)>0)
      return LINE_STATE_ABOVE;
//--- The line crossed the level upwards (value1<=level && value0>level0)
   if(NormalizeDouble(value1-level,ind_digits)<=0 && NormalizeDouble(value0-level0,ind_digits)>0)
      return LINE_STATE_CROSS_UP;
//--- The line crossed the level downwards (value1>=level && value0<level0)
   if(NormalizeDouble(value1-level,ind_digits)>=0 && NormalizeDouble(value0-level0,ind_digits)<0)
      return LINE_STATE_CROSS_DOWN;
//--- The line touched the level from below (value1<level0 && value0==level0)
   if(NormalizeDouble(value1-level,ind_digits)<0 && NormalizeDouble(value0-level0,ind_digits)==0)
      return LINE_STATE_TOUCH_BELOW;
//--- The line touched the level from above (value1>level0 && value0==level0)
   if(NormalizeDouble(value1-level,ind_digits)>0 && NormalizeDouble(value0-level0,ind_digits)==0)
      return LINE_STATE_TOUCH_BELOW;
//--- Line is equal to the level value (value1==level0 && value0==level0)
   if(NormalizeDouble(value1-level,ind_digits)==0 && NormalizeDouble(value0-level0,ind_digits)==0)
      return LINE_STATE_EQUALS;
//--- Undefined state
   return LINE_STATE_NONE;
  }
//+------------------------------------------------------------------+
//| Return the indicator line state description                      |
//+------------------------------------------------------------------+
string LineStateDescription(const ENUM_LINE_STATE state)
  {
   switch(state)
     {
      case LINE_STATE_UP         :  return "Up";
      case LINE_STATE_STOP_UP    :  return "Stop Up";
      case LINE_STATE_TURN_UP    :  return "Turn Up";
      case LINE_STATE_DOWN       :  return "Down";
      case LINE_STATE_STOP_DOWN  :  return "Stop Down";
      case LINE_STATE_TURN_DOWN  :  return "Turn Down";
      case LINE_STATE_ABOVE      :  return "Above level";
      case LINE_STATE_UNDER      :  return "Under level";
      case LINE_STATE_CROSS_UP   :  return "Crossing Up";
      case LINE_STATE_CROSS_DOWN :  return "Crossing Down";
      case LINE_STATE_TOUCH_BELOW:  return "Touch from Below";
      case LINE_STATE_TOUCH_ABOVE:  return "Touch from Above";
      case LINE_STATE_EQUALS     :  return "Equals";
      default                    :  return "Unknown";
     }
  }
대시보드를 사용할 때 함수를 사용하여 패널에 데이터가 표시됩니다:
//+------------------------------------------------------------------+
//| Display data from the specified timeseries index to the panel    |
//+------------------------------------------------------------------+
void DrawData(const int index,const datetime time)
  {
//--- Declare the variables to receive data in them
   MqlTick  tick={0};
   MqlRates rates[1];

//--- Exit if unable to get the current prices
   if(!SymbolInfoTick(Symbol(),tick))
      return;
//--- Exit if unable to get the bar data by the specified index
   if(CopyRates(Symbol(),PERIOD_CURRENT,index,1,rates)!=1)
      return;

//--- Set font parameters for bar and indicator data headers
   int  size=0;
   uint flags=0;
   uint angle=0;
   string name=panel.FontParams(size,flags,angle);
   panel.SetFontParams(name,9,FW_BOLD);
   panel.DrawText("Bar data ["+(string)index+"]",3,panel.TableY1(0)-16,clrMaroon,panel.Width()-6);
   panel.DrawText("Indicator data ["+(string)index+"]",3,panel.TableY1(1)-16,clrGreen,panel.Width()-6);
//--- Set font parameters for bar and indicator data
   panel.SetFontParams(name,9);

//--- Display the data of the specified bar in table 0 on the panel
   panel.DrawText("Date",  panel.CellX(0,0,0)+2, panel.CellY(0,0,0)+2); panel.DrawText(TimeToString(  rates[0].time,TIME_DATE),     panel.CellX(0,0,1)+2, panel.CellY(0,0,1)+2,clrNONE,90);
   panel.DrawText("Time",  panel.CellX(0,1,0)+2, panel.CellY(0,1,0)+2); panel.DrawText(TimeToString(  rates[0].time,TIME_MINUTES),  panel.CellX(0,1,1)+2, panel.CellY(0,1,1)+2,clrNONE,90);
   panel.DrawText("Open",  panel.CellX(0,2,0)+2, panel.CellY(0,2,0)+2); panel.DrawText(DoubleToString(rates[0].open,Digits()),      panel.CellX(0,2,1)+2, panel.CellY(0,2,1)+2,clrNONE,90);
   panel.DrawText("High",  panel.CellX(0,3,0)+2, panel.CellY(0,3,0)+2); panel.DrawText(DoubleToString(rates[0].high,Digits()),      panel.CellX(0,3,1)+2, panel.CellY(0,3,1)+2,clrNONE,90);
   panel.DrawText("Low",   panel.CellX(0,4,0)+2, panel.CellY(0,4,0)+2); panel.DrawText(DoubleToString(rates[0].low,Digits()),       panel.CellX(0,4,1)+2, panel.CellY(0,4,1)+2,clrNONE,90);
   panel.DrawText("Close", panel.CellX(0,5,0)+2, panel.CellY(0,5,0)+2); panel.DrawText(DoubleToString(rates[0].close,Digits()),     panel.CellX(0,5,1)+2, panel.CellY(0,5,1)+2,clrNONE,90);

//--- Display the indicator data from the specified bar on the panel in table 1
   panel.DrawText(ind_title, panel.CellX(1,0,0)+2, panel.CellY(1,0,0)+2);
   double value=IndicatorValue(handle,index,0);
   string value_str=(value!=EMPTY_VALUE ? DoubleToString(value,ind_digits) : "");
   panel.DrawText(value_str,panel.CellX(1,0,1)+2,panel.CellY(1,0,1)+2,clrNONE,100);

//--- Display a description of the indicator line state relative to the overbought level
   string ovb=StringFormat("%+.2f",overbough);
   panel.DrawText("Overbough", panel.CellX(1,2,0)+2, panel.CellY(1,2,0)+2);
   panel.DrawText(ovb, panel.CellX(1,2,0)+66, panel.CellY(1,2,0)+2);
   ENUM_LINE_STATE state_ovb=LineStateRelative(handle,index,0,overbough);
//--- The label color changes depending on the value of the line relative to the level
   color clr=(state_ovb==LINE_STATE_CROSS_DOWN ? clrRed : clrNONE);
   string ovb_str=(state_ovb==LINE_STATE_ABOVE ? "Inside the area" : LineStateDescription(state_ovb));
   panel.DrawText(ovb_str,panel.CellX(1,2,1)+2,panel.CellY(1,2,1)+2,clr,100);

//--- Display a description of the indicator line state relative to the oversold level
   panel.DrawText("Oversold", panel.CellX(1,3,0)+2, panel.CellY(1,3,0)+2);
   string ovs=StringFormat("%+.2f",oversold);
   panel.DrawText(ovs, panel.CellX(1,3,0)+68, panel.CellY(1,3,0)+2);
   ENUM_LINE_STATE state_ovs=LineStateRelative(handle,index,0,oversold);
//--- The label color changes depending on the value of the line relative to the level
   clr=(state_ovs==LINE_STATE_CROSS_UP ? clrBlue : clrNONE);
   string ovs_str=(state_ovs==LINE_STATE_UNDER ? "Inside the area" : LineStateDescription(state_ovs));
   panel.DrawText(ovs_str,panel.CellX(1,3,1)+2,panel.CellY(1,3,1)+2,clr,100);

//--- Display a description of the indicator line state
   panel.DrawText("Line state", panel.CellX(1,1,0)+2, panel.CellY(1,1,0)+2);
   ENUM_LINE_STATE state=LineState(handle,index,0);
//--- The label color changes depending on the location of the line in the overbought/oversold areas
   clr=(state_ovb==LINE_STATE_ABOVE || state_ovb==LINE_STATE_CROSS_DOWN ? clrRed : state_ovs==LINE_STATE_UNDER || state_ovs==LINE_STATE_CROSS_UP ? clrBlue : clrNONE);
   panel.DrawText(LineStateDescription(state),panel.CellX(1,1,1)+2,panel.CellY(1,1,1)+2,clr,100);

//--- Redraw the chart to immediately display all changes on the panel
   ChartRedraw(ChartID());
  }
과매수/과매도 영역에서 지표 선의 위치는 패널에서 텍스트의 색상으로 표시됩니다.
또한 대시보드를 사용할 때 패널 이벤트 핸들러는 OnChartEvent() EA 이벤트 핸들러에서 호출되며 커서 아래의 바 인덱스를 수신하는 이벤트도 처리됩니다:
//+------------------------------------------------------------------+
//| ChartEvent function                                              |
//+------------------------------------------------------------------+
void OnChartEvent(const int id,
                  const long &lparam,
                  const double &dparam,
                  const string &sparam)
  {
//--- Handling the panel
//--- Call the panel event handler
   panel.OnChartEvent(id,lparam,dparam,sparam);

//--- If the cursor moves or a click is made on the chart
   if(id==CHARTEVENT_MOUSE_MOVE || id==CHARTEVENT_CLICK)
     {
      //--- Declare the variables to record time and price coordinates in them
      datetime time=0;
      double price=0;
      int wnd=0;
      //--- If the cursor coordinates are converted to date and time
      if(ChartXYToTimePrice(ChartID(),(int)lparam,(int)dparam,wnd,time,price))
        {
         //--- write the bar index where the cursor is located to a global variable
         mouse_bar_index=iBarShift(Symbol(),PERIOD_CURRENT,time);
         //--- Display the bar data under the cursor on the panel
         DrawData(mouse_bar_index,time);
        }
     }

//--- If we received a custom event, display the appropriate message in the journal
   if(id>CHARTEVENT_CUSTOM)
     {
      //--- Here we can implement handling a click on the close button on the panel
      PrintFormat("%s: Event id=%ld, object id (lparam): %lu, event message (sparam): %s",__FUNCTION__,id,lparam,sparam);
     }
  }
EA를 컴파일하고 차트에서 실행하면 패널에서 지표 값과 선의 상태를 모니터링할 수 있습니다:
이 문서에 첨부된 파일에서 TestVolumeMFI.mq5 테스트 EA를 확인할 수 있습니다.
온 밸런스 볼륨(On Balance Volume)
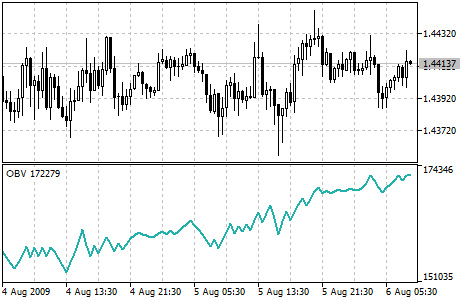
온 밸런스 볼륨(OBV)은 볼륨과 가격 변동을 연관 짓는 모멘텀 기술 지표입니다. 조셉 그랜빌이 생각해낸 지표는 매우 간단합니다. 현재 바의 종가가 이전 바의 종가보다 높으면 현재 바의 볼륨이 이전 OBV에 더해집니다. 현재 막대 종가가 이전 종가보다 낮으면 현재 볼륨은 이전 OBV에서 차감됩니다.
본 밸런스 볼륨 분석과 관련하여 기본 가정은 OBV 변화가 가격 변동보다 선행한다는 것입니다. 이론은 스마트 머니가 상승하는 OBV를 통해 증권으로 유입되는 것을 볼 수 있다는 것입니다. 그런 다음 대중이 매수를 하게 되면 주식과 온 밸런스 볼륨이 모두 앞서 올라가게 됩니다.
유가증권의 가격 움직임이 OBV 움직임보다 앞서면 "미확정"이 발생한 것입니다. 미확정은 상승장 고점(OBV 없이 또는 그 이전에 가격이 상승하는 경우) 또는 하락장 저점(OBV 없이 또는 그 이전에 가격이 하락하는 경우)에서 발생할 수 있습니다.
새로운 고점이 이전 고점보다 높고 새로운 저점이 이전 저점보다 높을 때 OBV는 상승 추세에 있습니다. 마찬가지로 연속된 각 고점이 이전 고점보다 낮고 연속된 각 저점이 이전 저점보다 낮으면 OBV는 하락 추세에 있는 것입니다. OBV가 횡보하고 연속적으로 고점과 저점을 만들지 않는다면 의심스러운 추세에 있는 것입니다.
일단 트렌드가 생기게 되면 그 트렌드는 깨질 때까지 유효합니다. OBV의 추세가 깨지는 경우는 두 가지 경우입니다. 첫 번째 경우는 상승 추세에서 하락 추세로 또는 하락 추세에서 상승 추세로 추세가 바뀔 때 발생합니다.
OBV 추세가 깨질 수 있는 두 번째 경우는 추세가 의심스러운 추세로 바뀌고 3일 이상 의심스러운 상태로 유지되는 경우입니다. 따라서 유가증권이 상승 추세에서 의심 추세로 바뀌고 이틀 동안만 의심 추세를 유지하다가 다시 상승 추세로 바뀌면 OBV는 항상 상승 추세에 있었던 것으로 간주됩니다. 그리고 OBV가 상승 또는 하락 추세로 바뀌면 "돌파"가 발생한 것으로 간주합니다.
일반적으로 OBV 돌파는 가격 돌파에 선행하기 때문에 투자자는 온밸런스 볼륨 상승 돌파 시 매수해야 합니다. 마찬가지로 투자자는 OBV가 하락 돌파할 때 매도해야 합니다. 포지션은 추세가 바뀔 때까지 유지해야 합니다.
매개변수
iOBV() 함수는 지표 핸들을 만드는 데 사용됩니다:
OBV 지표의 핸들을 반환합니다. 버퍼는 하나만 있습니다.
int  iOBV(
   string                symbol,             // symbol name
   ENUM_TIMEFRAMES       period,             // period
   ENUM_APPLIED_VOLUME   applied_volume      // type of volume used for calculations
   );
[in] 금융 상품의 심볼 이름으로 지표 계산에 이 심볼의 데이터를 사용합니다. NULL은 현재 심볼을 의미합니다.
period
[in] 기간 값은 ENUM_TIMEFRAMES 열거형 값 중 하나이며 0은 현재 기간을 의미합니다.
applied_volume
[in] Used volume. ENUM_APPLIED_VOLUME 열거형 값 중 하나입니다.
지정된 기술 지표의 핸들을 반환합니다. 실패하면 INVALID_HANDLE을 반환합니다. 사용하지 않는 지표에서 컴퓨터 메모리를 확보하려면 지표 핸들이 전달되는 IndicatorRelease() 를 사용하세요.
EA에서 입력 및 전역 변수를 선언하여 지표를 만듭니다:
//+------------------------------------------------------------------+
//|                                                TestVolumeOBV.mq5 |
//|                                  Copyright 2023, MetaQuotes Ltd. |
//|                                             https://www.mql5.com |
//+------------------------------------------------------------------+
#property copyright "Copyright 2023, MetaQuotes Ltd."
#property link      "https://www.mql5.com"
#property version   "1.00"
//--- enums
enum ENUM_LINE_STATE
  {
   LINE_STATE_NONE,        // Undefined state
   LINE_STATE_UP,          // Upward
   LINE_STATE_DOWN,        // Downward
   LINE_STATE_TURN_UP,     // Upward reversal
   LINE_STATE_TURN_DOWN,   // Downward reversal
   LINE_STATE_STOP_UP,     // Upward stop
   LINE_STATE_STOP_DOWN,   // Downward stop
   LINE_STATE_ABOVE,       // Above value
   LINE_STATE_UNDER,       // Below value
   LINE_STATE_CROSS_UP,    // Crossing value upwards
   LINE_STATE_CROSS_DOWN,  // Crossing value downwards
   LINE_STATE_TOUCH_BELOW, // Touching value from below
   LINE_STATE_TOUCH_ABOVE, // Touch value from above
   LINE_STATE_EQUALS,      // Equal to value
  };
//--- input parameters
input ENUM_APPLIED_VOLUME  InpVolume   =  VOLUME_TICK;   /* Applied Volume */
//--- global variables
int      handle=INVALID_HANDLE;  // Indicator handle
int      ind_digits=0;           // Number of decimal places in the indicator values
string   ind_title;              // Indicator description
EA에서 대시보드를 사용할 때는 전역 변수를 선언하고 패널 클래스 파일을 포함하세요:
//+------------------------------------------------------------------+
//|                                                TestVolumeOBV.mq5 |
//|                                  Copyright 2023, MetaQuotes Ltd. |
//|                                             https://www.mql5.com |
//+------------------------------------------------------------------+
#property copyright "Copyright 2023, MetaQuotes Ltd."
#property link      "https://www.mql5.com"
#property version   "1.00"
//--- includes
#include <Dashboard\Dashboard.mqh>
//--- enums
enum ENUM_LINE_STATE
  {
   LINE_STATE_NONE,        // Undefined state
   LINE_STATE_UP,          // Upward
   LINE_STATE_DOWN,        // Downward
   LINE_STATE_TURN_UP,     // Upward reversal
   LINE_STATE_TURN_DOWN,   // Downward reversal
   LINE_STATE_STOP_UP,     // Upward stop
   LINE_STATE_STOP_DOWN,   // Downward stop
   LINE_STATE_ABOVE,       // Above value
   LINE_STATE_UNDER,       // Below value
   LINE_STATE_CROSS_UP,    // Crossing value upwards
   LINE_STATE_CROSS_DOWN,  // Crossing value downwards
   LINE_STATE_TOUCH_BELOW, // Touching value from below
   LINE_STATE_TOUCH_ABOVE, // Touch value from above
   LINE_STATE_EQUALS,      // Equal to value
  };
//--- input parameters
input ENUM_APPLIED_VOLUME  InpVolume   =  VOLUME_TICK;   /* Applied Volume */
//--- global variables
int      handle=INVALID_HANDLE;  // Indicator handle
int      ind_digits=0;           // Number of decimal places in the indicator values
string   ind_title;              // Indicator description
//--- variables for the panel
int      mouse_bar_index;        // Index of the bar the data is taken from
CDashboard *panel=NULL;          // Pointer to the panel object
초기화
지표의 전역 변수 값을 설정하고 핸들을 생성합니다:
//+------------------------------------------------------------------+
//| Expert initialization function                                   |
//+------------------------------------------------------------------+
int OnInit()
  {
//--- create timer
   EventSetTimer(60);

//--- Indicator
//--- Set the indicator name and the number of decimal places
   ind_title="OBV";
   ind_digits=0;
//--- Create indicator handle
   ResetLastError();
   handle=iOBV(Symbol(),PERIOD_CURRENT,InpVolume);
   if(handle==INVALID_HANDLE)
     {
      PrintFormat("%s: Failed to create indicator handle %s. Error %ld",__FUNCTION__,ind_title,GetLastError());
      return INIT_FAILED;
     }

//--- Successful initialization
   return(INIT_SUCCEEDED);
  }
EA에 대시보드를 사용하는 기능이 있는 경우 여기에서 생성하세요:
//+------------------------------------------------------------------+
//| Expert initialization function                                   |
//+------------------------------------------------------------------+
int OnInit()
  {
//--- create timer
   EventSetTimer(60);

//--- Indicator
//--- Set the indicator name and the number of decimal places
   ind_title="OBV";
   ind_digits=0;
//--- Create indicator handle
   ResetLastError();
   handle=iOBV(Symbol(),PERIOD_CURRENT,InpVolume);
   if(handle==INVALID_HANDLE)
     {
      PrintFormat("%s: Failed to create indicator handle %s. Error %ld",__FUNCTION__,ind_title,GetLastError());
      return INIT_FAILED;
     }

//--- Dashboard
//--- Create the panel
   panel=new CDashboard(1,20,20,199,225);
   if(panel==NULL)
     {
      Print("Error. Failed to create panel object");
      return INIT_FAILED;
     }
//--- Set font parameters
   panel.SetFontParams("Calibri",9);
//--- Display the panel with the "Symbol, Timeframe description" header text
   panel.View(Symbol()+", "+StringSubstr(EnumToString(Period()),7));
//--- Create a table with ID 0 to display bar data in it
   panel.CreateNewTable(0);
//--- Draw a table with ID 0 on the panel background
   panel.DrawGrid(0,2,20,6,2,18,97);

//--- Create a table with ID 1 to display indicator data in it
   panel.CreateNewTable(1);
//--- Get the Y2 table coordinate with ID 0 and
//--- set the Y1 coordinate for the table with ID 1
   int y1=panel.TableY2(0)+22;
//--- Draw a table with ID 1 on the panel background
   panel.DrawGrid(1,2,y1,3,2,18,97);

//--- Display tabular data in the journal
   panel.GridPrint(0,2);
   panel.GridPrint(1,2);
//--- Initialize the variable with the index of the mouse cursor bar
   mouse_bar_index=0;
//--- Display the data of the current bar on the panel
   DrawData(mouse_bar_index,TimeCurrent());

//--- Successful initialization
   return(INIT_SUCCEEDED);
  }
초기화 해제
EA OnDeinit() 핸들에서 지표 핸들을 릴리즈합니다:
//+------------------------------------------------------------------+
//| Expert deinitialization function                                 |
//+------------------------------------------------------------------+
void OnDeinit(const int reason)
  {
//--- destroy timer
   EventKillTimer();

//--- Release handle of the indicator
   ResetLastError();
   if(!IndicatorRelease(handle))
      PrintFormat("%s: IndicatorRelease failed. Error %ld",__FUNCTION__,GetLastError());
//--- Clear all comments on the chart
   Comment("");
  }
대시보드를 사용할 때 생성된 대시보드 객체가 제거됩니다:
//+------------------------------------------------------------------+
//| Expert deinitialization function                                 |
//+------------------------------------------------------------------+
void OnDeinit(const int reason)
  {
//--- destroy timer
   EventKillTimer();

//--- Release handle of the indicator
   ResetLastError();
   if(!IndicatorRelease(handle))
      PrintFormat("%s: IndicatorRelease failed. Error %ld",__FUNCTION__,GetLastError());
//--- Clear all comments on the chart
   Comment("");

//--- If the panel object exists, delete it
   if(panel!=NULL)
      delete panel;
  }
데이터 검색
지표 핸들로 데이터를 가져오는 일반적인 함수는 다음과 같습니다. 함수들은 오실레이터를 EA에 연결하는 방법에 대한 문서에서 검토했습니다. 제시된 함수는 사용자 지정 프로그램에서 '있는 그대로' 사용할 수 있습니다:
//+------------------------------------------------------------------+
//| Return the indicator data on the specified bar                   |
//+------------------------------------------------------------------+
double IndicatorValue(const int ind_handle,const int index,const int buffer_num)
  {
   double array[1]={0};
   ResetLastError();
   if(CopyBuffer(ind_handle,buffer_num,index,1,array)!=1)
     {
      PrintFormat("%s: CopyBuffer failed. Error %ld",__FUNCTION__,GetLastError());
      return EMPTY_VALUE;
     }
   return array[0];
  }
//+------------------------------------------------------------------+
//| Return the state of the indicator line                           |
//+------------------------------------------------------------------+
ENUM_LINE_STATE LineState(const int ind_handle,const int index,const int buffer_num)
  {
//--- Get the values of the indicator line with the shift (0,1,2) relative to the passed index
   const double value0=IndicatorValue(ind_handle,index,  buffer_num);
   const double value1=IndicatorValue(ind_handle,index+1,buffer_num);
   const double value2=IndicatorValue(ind_handle,index+2,buffer_num);
//--- If at least one of the values could not be obtained, return an undefined value
   if(value0==EMPTY_VALUE || value1==EMPTY_VALUE || value2==EMPTY_VALUE)
      return LINE_STATE_NONE;
//--- Line upward reversal (value2>value1 && value0>value1)
   if(NormalizeDouble(value2-value1,ind_digits)>0 && NormalizeDouble(value0-value1,ind_digits)>0)
      return LINE_STATE_TURN_UP;
//--- Line upward direction (value2<=value1 && value0>value1)
   else if(NormalizeDouble(value2-value1,ind_digits)<=0 && NormalizeDouble(value0-value1,ind_digits)>0)
      return LINE_STATE_UP;
//--- Line upward stop (value2<=value1 && value0==value1)
   else if(NormalizeDouble(value2-value1,ind_digits)<=0 && NormalizeDouble(value0-value1,ind_digits)==0)
      return LINE_STATE_STOP_UP;
//--- Line downward reversal (value2<value1 && value0<value1)
   if(NormalizeDouble(value2-value1,ind_digits)<0 && NormalizeDouble(value0-value1,ind_digits)<0)
      return LINE_STATE_TURN_DOWN;
//--- Line downward direction (value2>=value1 && value0<value1)
   else if(NormalizeDouble(value2-value1,ind_digits)>=0 && NormalizeDouble(value0-value1,ind_digits)<0)
      return LINE_STATE_DOWN;
//--- Line downward stop (value2>=value1 && value0==value1)
   else if(NormalizeDouble(value2-value1,ind_digits)>=0 && NormalizeDouble(value0-value1,ind_digits)==0)
      return LINE_STATE_STOP_DOWN;
//--- Undefined state
   return LINE_STATE_NONE;
  }
//+------------------------------------------------------------------+
//| Return the state of the line relative to the specified level     |
//+------------------------------------------------------------------+
ENUM_LINE_STATE LineStateRelative(const int ind_handle,const int index,const int buffer_num,const double level0,const double level1=EMPTY_VALUE)
  {
//--- Get the values of the indicator line with the shift (0,1) relative to the passed index
   const double value0=IndicatorValue(ind_handle,index,  buffer_num);
   const double value1=IndicatorValue(ind_handle,index+1,buffer_num);
//--- If at least one of the values could not be obtained, return an undefined value
   if(value0==EMPTY_VALUE || value1==EMPTY_VALUE)
      return LINE_STATE_NONE;
//--- Define the second level to compare
   double level=(level1==EMPTY_VALUE ? level0 : level1);
//--- The line is below the level (value1<level && value0<level0)
   if(NormalizeDouble(value1-level,ind_digits)<0 && NormalizeDouble(value0-level0,ind_digits)<0)
      return LINE_STATE_UNDER;
//--- The line is above the level (value1>level && value0>level0)
   if(NormalizeDouble(value1-level,ind_digits)>0 && NormalizeDouble(value0-level0,ind_digits)>0)
      return LINE_STATE_ABOVE;
//--- The line crossed the level upwards (value1<=level && value0>level0)
   if(NormalizeDouble(value1-level,ind_digits)<=0 && NormalizeDouble(value0-level0,ind_digits)>0)
      return LINE_STATE_CROSS_UP;
//--- The line crossed the level downwards (value1>=level && value0<level0)
   if(NormalizeDouble(value1-level,ind_digits)>=0 && NormalizeDouble(value0-level0,ind_digits)<0)
      return LINE_STATE_CROSS_DOWN;
//--- The line touched the level from below (value1<level0 && value0==level0)
   if(NormalizeDouble(value1-level,ind_digits)<0 && NormalizeDouble(value0-level0,ind_digits)==0)
      return LINE_STATE_TOUCH_BELOW;
//--- The line touched the level from above (value1>level0 && value0==level0)
   if(NormalizeDouble(value1-level,ind_digits)>0 && NormalizeDouble(value0-level0,ind_digits)==0)
      return LINE_STATE_TOUCH_BELOW;
//--- Line is equal to the level value (value1==level0 && value0==level0)
   if(NormalizeDouble(value1-level,ind_digits)==0 && NormalizeDouble(value0-level0,ind_digits)==0)
      return LINE_STATE_EQUALS;
//--- Undefined state
   return LINE_STATE_NONE;
  }
//+------------------------------------------------------------------+
//| Return the indicator line state description                      |
//+------------------------------------------------------------------+
string LineStateDescription(const ENUM_LINE_STATE state)
  {
   switch(state)
     {
      case LINE_STATE_UP         :  return "Up";
      case LINE_STATE_STOP_UP    :  return "Stop Up";
      case LINE_STATE_TURN_UP    :  return "Turn Up";
      case LINE_STATE_DOWN       :  return "Down";
      case LINE_STATE_STOP_DOWN  :  return "Stop Down";
      case LINE_STATE_TURN_DOWN  :  return "Turn Down";
      case LINE_STATE_ABOVE      :  return "Above level";
      case LINE_STATE_UNDER      :  return "Under level";
      case LINE_STATE_CROSS_UP   :  return "Crossing Up";
      case LINE_STATE_CROSS_DOWN :  return "Crossing Down";
      case LINE_STATE_TOUCH_BELOW:  return "Touch from Below";
      case LINE_STATE_TOUCH_ABOVE:  return "Touch from Above";
      case LINE_STATE_EQUALS     :  return "Equals";
      default                    :  return "Unknown";
     }
  }
대시보드를 사용할 때 함수를 사용하여 패널에 데이터가 표시됩니다:
//+------------------------------------------------------------------+
//| Display data from the specified timeseries index to the panel    |
//+------------------------------------------------------------------+
void DrawData(const int index,const datetime time)
  {
//--- Declare the variables to receive data in them
   MqlTick  tick={0};
   MqlRates rates[1];

//--- Exit if unable to get the current prices
   if(!SymbolInfoTick(Symbol(),tick))
      return;
//--- Exit if unable to get the bar data by the specified index
   if(CopyRates(Symbol(),PERIOD_CURRENT,index,1,rates)!=1)
      return;

//--- Set font parameters for bar and indicator data headers
   int  size=0;
   uint flags=0;
   uint angle=0;
   string name=panel.FontParams(size,flags,angle);
   panel.SetFontParams(name,9,FW_BOLD);
   panel.DrawText("Bar data ["+(string)index+"]",3,panel.TableY1(0)-16,clrMaroon,panel.Width()-6);
   panel.DrawText("Indicator data ["+(string)index+"]",3,panel.TableY1(1)-16,clrGreen,panel.Width()-6);
//--- Set font parameters for bar and indicator data
   panel.SetFontParams(name,9);

//--- Display the data of the specified bar in table 0 on the panel
   panel.DrawText("Date",  panel.CellX(0,0,0)+2, panel.CellY(0,0,0)+2); panel.DrawText(TimeToString(  rates[0].time,TIME_DATE),     panel.CellX(0,0,1)+2, panel.CellY(0,0,1)+2,clrNONE,90);
   panel.DrawText("Time",  panel.CellX(0,1,0)+2, panel.CellY(0,1,0)+2); panel.DrawText(TimeToString(  rates[0].time,TIME_MINUTES),  panel.CellX(0,1,1)+2, panel.CellY(0,1,1)+2,clrNONE,90);
   panel.DrawText("Open",  panel.CellX(0,2,0)+2, panel.CellY(0,2,0)+2); panel.DrawText(DoubleToString(rates[0].open,Digits()),      panel.CellX(0,2,1)+2, panel.CellY(0,2,1)+2,clrNONE,90);
   panel.DrawText("High",  panel.CellX(0,3,0)+2, panel.CellY(0,3,0)+2); panel.DrawText(DoubleToString(rates[0].high,Digits()),      panel.CellX(0,3,1)+2, panel.CellY(0,3,1)+2,clrNONE,90);
   panel.DrawText("Low",   panel.CellX(0,4,0)+2, panel.CellY(0,4,0)+2); panel.DrawText(DoubleToString(rates[0].low,Digits()),       panel.CellX(0,4,1)+2, panel.CellY(0,4,1)+2,clrNONE,90);
   panel.DrawText("Close", panel.CellX(0,5,0)+2, panel.CellY(0,5,0)+2); panel.DrawText(DoubleToString(rates[0].close,Digits()),     panel.CellX(0,5,1)+2, panel.CellY(0,5,1)+2,clrNONE,90);

//--- Display the indicator data from the specified bar on the panel in table 1
   panel.DrawText(ind_title, panel.CellX(1,0,0)+2, panel.CellY(1,0,0)+2);
   double value=IndicatorValue(handle,index,0);
   string value_str=(value!=EMPTY_VALUE ? DoubleToString(value,ind_digits) : "");
   panel.DrawText(value_str,panel.CellX(1,0,1)+2,panel.CellY(1,0,1)+2,clrNONE,90);

//--- Display a description of the indicator line state
   panel.DrawText("Line state", panel.CellX(1,1,0)+2, panel.CellY(1,1,0)+2);
   ENUM_LINE_STATE state=LineState(handle,index,0);
   panel.DrawText(LineStateDescription(state),panel.CellX(1,1,1)+2,panel.CellY(1,1,1)+2,clrNONE,90);

//--- Redraw the chart to immediately display all changes on the panel
   ChartRedraw(ChartID());
  }
또한 대시보드를 사용할 때 패널 이벤트 핸들러는 OnChartEvent() EA 이벤트 핸들러에서 호출되며 커서 아래의 바 인덱스를 수신하는 이벤트도 처리됩니다:
//+------------------------------------------------------------------+
//| ChartEvent function                                              |
//+------------------------------------------------------------------+
void OnChartEvent(const int id,
                  const long &lparam,
                  const double &dparam,
                  const string &sparam)
  {
//--- Handling the panel
//--- Call the panel event handler
   panel.OnChartEvent(id,lparam,dparam,sparam);

//--- If the cursor moves or a click is made on the chart
   if(id==CHARTEVENT_MOUSE_MOVE || id==CHARTEVENT_CLICK)
     {
      //--- Declare the variables to record time and price coordinates in them
      datetime time=0;
      double price=0;
      int wnd=0;
      //--- If the cursor coordinates are converted to date and time
      if(ChartXYToTimePrice(ChartID(),(int)lparam,(int)dparam,wnd,time,price))
        {
         //--- write the bar index where the cursor is located to a global variable
         mouse_bar_index=iBarShift(Symbol(),PERIOD_CURRENT,time);
         //--- Display the bar data under the cursor on the panel
         DrawData(mouse_bar_index,time);
        }
     }

//--- If we received a custom event, display the appropriate message in the journal
   if(id>CHARTEVENT_CUSTOM)
     {
      //--- Here we can implement handling a click on the close button on the panel
      PrintFormat("%s: Event id=%ld, object id (lparam): %lu, event message (sparam): %s",__FUNCTION__,id,lparam,sparam);
     }
  }
EA를 컴파일하고 차트에서 실행하면 패널에서 지표 값과 선의 상태를 모니터링할 수 있습니다:
이 문서에 첨부된 파일에서 TestVolumeOBV.mq5 테스트 EA를 확인할 수 있습니다.
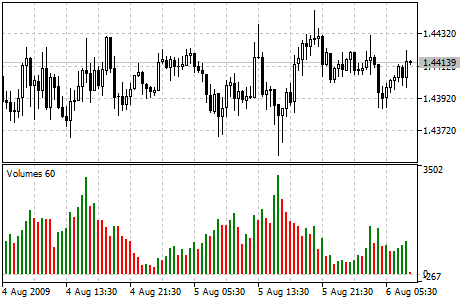
볼륨
외환 시장의 경우 볼륨 지표는 선택한 기간의 각 기간 내 가격 변동 횟수를 나타내는 지표입니다. 주식 심볼의 경우 실제로 거래된 거래량(계약, 금액, 단위 등)을 나타내는 지표입니다.
매개변수
iVolumes() 함수는 지표 핸들을 만드는 데 사용됩니다:
볼륨을 설명하는 지표의 핸들을 반환합니다. 버퍼는 하나만 있습니다.
int  iVolumes(
   string               symbol,             // symbol name
   ENUM_TIMEFRAMES      period,             // period
   ENUM_APPLIED_VOLUME  applied_volume      // volume type
   )
symbol
[in] 금융 상품의 심볼 이름으로 지표 계산에 이 심볼의 데이터를 사용합니다. NULL은 현재 기호를 의미합니다.
period
[in] 기간 값은 ENUM_TIMEFRAMES 열거형 값 중 하나이며 0은 현재 기간을 의미합니다.
applied_volume
[in] Used volume. ENUM_APPLIED_VOLUME 열거형 값 중 하나입니다.
지정된 기술 지표의 핸들을 반환합니다. 실패하면 INVALID_HANDLE을 반환합니다. 사용하지 않는 지표에서 컴퓨터 메모리를 확보하려면 지표 핸들이 전달되는 IndicatorRelease() 를 사용하세요.
EA에서 입력 및 전역 변수를 선언하여 지표를 만듭니다:
//+------------------------------------------------------------------+
//|                                                TestVolumeOBV.mq5 |
//|                                  Copyright 2023, MetaQuotes Ltd. |
//|                                             https://www.mql5.com |
//+------------------------------------------------------------------+
#property copyright "Copyright 2023, MetaQuotes Ltd."
#property link      "https://www.mql5.com"
#property version   "1.00"
//--- enums
enum ENUM_LINE_STATE
  {
   LINE_STATE_NONE,        // Undefined state
   LINE_STATE_UP,          // Upward
   LINE_STATE_DOWN,        // Downward
   LINE_STATE_TURN_UP,     // Upward reversal
   LINE_STATE_TURN_DOWN,   // Downward reversal
   LINE_STATE_STOP_UP,     // Upward stop
   LINE_STATE_STOP_DOWN,   // Downward stop
   LINE_STATE_ABOVE,       // Above value
   LINE_STATE_UNDER,       // Below value
   LINE_STATE_CROSS_UP,    // Crossing value upwards
   LINE_STATE_CROSS_DOWN,  // Crossing value downwards
   LINE_STATE_TOUCH_BELOW, // Touching value from below
   LINE_STATE_TOUCH_ABOVE, // Touch value from above
   LINE_STATE_EQUALS,      // Equal to value
  };
//--- input parameters
input ENUM_APPLIED_VOLUME  InpVolume   =  VOLUME_TICK;   /* Applied Volume */
//--- global variables
int      handle=INVALID_HANDLE;  // Indicator handle
int      ind_digits=0;           // Number of decimal places in the indicator values
string   ind_title;              // Indicator description
EA에서 대시보드를 사용할 때는 전역 변수를 선언하고 패널 클래스 파일을 포함하세요:
//+------------------------------------------------------------------+
//|                                                TestVolumeOBV.mq5 |
//|                                  Copyright 2023, MetaQuotes Ltd. |
//|                                             https://www.mql5.com |
//+------------------------------------------------------------------+
#property copyright "Copyright 2023, MetaQuotes Ltd."
#property link      "https://www.mql5.com"
#property version   "1.00"
//--- includes
#include <Dashboard\Dashboard.mqh>
//--- enums
enum ENUM_LINE_STATE
  {
   LINE_STATE_NONE,        // Undefined state
   LINE_STATE_UP,          // Upward
   LINE_STATE_DOWN,        // Downward
   LINE_STATE_TURN_UP,     // Upward reversal
   LINE_STATE_TURN_DOWN,   // Downward reversal
   LINE_STATE_STOP_UP,     // Upward stop
   LINE_STATE_STOP_DOWN,   // Downward stop
   LINE_STATE_ABOVE,       // Above value
   LINE_STATE_UNDER,       // Below value
   LINE_STATE_CROSS_UP,    // Crossing value upwards
   LINE_STATE_CROSS_DOWN,  // Crossing value downwards
   LINE_STATE_TOUCH_BELOW, // Touching value from below
   LINE_STATE_TOUCH_ABOVE, // Touch value from above
   LINE_STATE_EQUALS,      // Equal to value
  };
//--- input parameters
input ENUM_APPLIED_VOLUME  InpVolume   =  VOLUME_TICK;   /* Applied Volume */
//--- global variables
int      handle=INVALID_HANDLE;  // Indicator handle
int      ind_digits=0;           // Number of decimal places in the indicator values
string   ind_title;              // Indicator description
//--- variables for the panel
int      mouse_bar_index;        // Index of the bar the data is taken from
CDashboard *panel=NULL;          // Pointer to the panel object
초기화
지표의 전역 변수 값을 설정하고 핸들을 생성합니다:
//+------------------------------------------------------------------+
//| Expert initialization function                                   |
//+------------------------------------------------------------------+
int OnInit()
  {
//--- create timer
   EventSetTimer(60);

//--- Indicator
//--- Set the indicator name and the number of decimal places
   ind_title="Volumes";
   ind_digits=0;
//--- Create indicator handle
   ResetLastError();
   handle=iVolumes(Symbol(),PERIOD_CURRENT,InpVolume);
   if(handle==INVALID_HANDLE)
     {
      PrintFormat("%s: Failed to create indicator handle %s. Error %ld",__FUNCTION__,ind_title,GetLastError());
      return INIT_FAILED;
     }

//--- Successful initialization
   return(INIT_SUCCEEDED);
  }
EA에 대시보드를 사용하는 기능이 있는 경우 여기에서 생성하세요:
//+------------------------------------------------------------------+
//| Expert initialization function                                   |
//+------------------------------------------------------------------+
int OnInit()
  {
//--- create timer
   EventSetTimer(60);

//--- Indicator
//--- Set the indicator name and the number of decimal places
   ind_title="Volumes";
   ind_digits=0;
//--- Create indicator handle
   ResetLastError();
   handle=iVolumes(Symbol(),PERIOD_CURRENT,InpVolume);
   if(handle==INVALID_HANDLE)
     {
      PrintFormat("%s: Failed to create indicator handle %s. Error %ld",__FUNCTION__,ind_title,GetLastError());
      return INIT_FAILED;
     }

//--- Dashboard
//--- Create the panel
   panel=new CDashboard(1,20,20,199,225);
   if(panel==NULL)
     {
      Print("Error. Failed to create panel object");
      return INIT_FAILED;
     }
//--- Set font parameters
   panel.SetFontParams("Calibri",9);
//--- Display the panel with the "Symbol, Timeframe description" header text
   panel.View(Symbol()+", "+StringSubstr(EnumToString(Period()),7));
//--- Create a table with ID 0 to display bar data in it
   panel.CreateNewTable(0);
//--- Draw a table with ID 0 on the panel background
   panel.DrawGrid(0,2,20,6,2,18,97);

//--- Create a table with ID 1 to display indicator data in it
   panel.CreateNewTable(1);
//--- Get the Y2 table coordinate with ID 0 and
//--- set the Y1 coordinate for the table with ID 1
   int y1=panel.TableY2(0)+22;
//--- Draw a table with ID 1 on the panel background
   panel.DrawGrid(1,2,y1,3,2,18,97);

//--- Display tabular data in the journal
   panel.GridPrint(0,2);
   panel.GridPrint(1,2);
//--- Initialize the variable with the index of the mouse cursor bar
   mouse_bar_index=0;
//--- Display the data of the current bar on the panel
   DrawData(mouse_bar_index,TimeCurrent());

//--- Successful initialization
   return(INIT_SUCCEEDED);
  }
초기화 해제
EA OnDeinit() 핸들에서 지표 핸들을 릴리즈합니다:
//+------------------------------------------------------------------+
//| Expert deinitialization function                                 |
//+------------------------------------------------------------------+
void OnDeinit(const int reason)
  {
//--- destroy timer
   EventKillTimer();

//--- Release handle of the indicator
   ResetLastError();
   if(!IndicatorRelease(handle))
      PrintFormat("%s: IndicatorRelease failed. Error %ld",__FUNCTION__,GetLastError());
//--- Clear all comments on the chart
   Comment("");
  }
대시보드를 사용할 때 생성된 대시보드 객체가 제거됩니다:
//+------------------------------------------------------------------+
//| Expert deinitialization function                                 |
//+------------------------------------------------------------------+
void OnDeinit(const int reason)
  {
//--- destroy timer
   EventKillTimer();

//--- Release handle of the indicator
   ResetLastError();
   if(!IndicatorRelease(handle))
      PrintFormat("%s: IndicatorRelease failed. Error %ld",__FUNCTION__,GetLastError());
//--- Clear all comments on the chart
   Comment("");

//--- If the panel object exists, delete it
   if(panel!=NULL)
      delete panel;
  }
데이터 검색
지표 핸들로 데이터를 가져오는 일반적인 함수는 다음과 같습니다. 함수들은 오실레이터를 EA에 연결하는 방법에 대한 문서에서 검토했습니다. 제시된 함수는 사용자 지정 프로그램에서 '있는 그대로' 사용할 수 있습니다:
//+------------------------------------------------------------------+
//| Return the indicator data on the specified bar                   |
//+------------------------------------------------------------------+
double IndicatorValue(const int ind_handle,const int index,const int buffer_num)
  {
   double array[1]={0};
   ResetLastError();
   if(CopyBuffer(ind_handle,buffer_num,index,1,array)!=1)
     {
      PrintFormat("%s: CopyBuffer failed. Error %ld",__FUNCTION__,GetLastError());
      return EMPTY_VALUE;
     }
   return array[0];
  }
//+------------------------------------------------------------------+
//| Return the state of the indicator line                           |
//+------------------------------------------------------------------+
ENUM_LINE_STATE LineState(const int ind_handle,const int index,const int buffer_num)
  {
//--- Get the values of the indicator line with the shift (0,1,2) relative to the passed index
   const double value0=IndicatorValue(ind_handle,index,  buffer_num);
   const double value1=IndicatorValue(ind_handle,index+1,buffer_num);
   const double value2=IndicatorValue(ind_handle,index+2,buffer_num);
//--- If at least one of the values could not be obtained, return an undefined value
   if(value0==EMPTY_VALUE || value1==EMPTY_VALUE || value2==EMPTY_VALUE)
      return LINE_STATE_NONE;
//--- Line upward reversal (value2>value1 && value0>value1)
   if(NormalizeDouble(value2-value1,ind_digits)>0 && NormalizeDouble(value0-value1,ind_digits)>0)
      return LINE_STATE_TURN_UP;
//--- Line upward direction (value2<=value1 && value0>value1)
   else if(NormalizeDouble(value2-value1,ind_digits)<=0 && NormalizeDouble(value0-value1,ind_digits)>0)
      return LINE_STATE_UP;
//--- Line upward stop (value2<=value1 && value0==value1)
   else if(NormalizeDouble(value2-value1,ind_digits)<=0 && NormalizeDouble(value0-value1,ind_digits)==0)
      return LINE_STATE_STOP_UP;
//--- Line downward reversal (value2<value1 && value0<value1)
   if(NormalizeDouble(value2-value1,ind_digits)<0 && NormalizeDouble(value0-value1,ind_digits)<0)
      return LINE_STATE_TURN_DOWN;
//--- Line downward direction (value2>=value1 && value0<value1)
   else if(NormalizeDouble(value2-value1,ind_digits)>=0 && NormalizeDouble(value0-value1,ind_digits)<0)
      return LINE_STATE_DOWN;
//--- Line downward stop (value2>=value1 && value0==value1)
   else if(NormalizeDouble(value2-value1,ind_digits)>=0 && NormalizeDouble(value0-value1,ind_digits)==0)
      return LINE_STATE_STOP_DOWN;
//--- Undefined state
   return LINE_STATE_NONE;
  }
//+------------------------------------------------------------------+
//| Return the state of the line relative to the specified level     |
//+------------------------------------------------------------------+
ENUM_LINE_STATE LineStateRelative(const int ind_handle,const int index,const int buffer_num,const double level0,const double level1=EMPTY_VALUE)
  {
//--- Get the values of the indicator line with the shift (0,1) relative to the passed index
   const double value0=IndicatorValue(ind_handle,index,  buffer_num);
   const double value1=IndicatorValue(ind_handle,index+1,buffer_num);
//--- If at least one of the values could not be obtained, return an undefined value
   if(value0==EMPTY_VALUE || value1==EMPTY_VALUE)
      return LINE_STATE_NONE;
//--- Define the second level to compare
   double level=(level1==EMPTY_VALUE ? level0 : level1);
//--- The line is below the level (value1<level && value0<level0)
   if(NormalizeDouble(value1-level,ind_digits)<0 && NormalizeDouble(value0-level0,ind_digits)<0)
      return LINE_STATE_UNDER;
//--- The line is above the level (value1>level && value0>level0)
   if(NormalizeDouble(value1-level,ind_digits)>0 && NormalizeDouble(value0-level0,ind_digits)>0)
      return LINE_STATE_ABOVE;
//--- The line crossed the level upwards (value1<=level && value0>level0)
   if(NormalizeDouble(value1-level,ind_digits)<=0 && NormalizeDouble(value0-level0,ind_digits)>0)
      return LINE_STATE_CROSS_UP;
//--- The line crossed the level downwards (value1>=level && value0<level0)
   if(NormalizeDouble(value1-level,ind_digits)>=0 && NormalizeDouble(value0-level0,ind_digits)<0)
      return LINE_STATE_CROSS_DOWN;
//--- The line touched the level from below (value1<level0 && value0==level0)
   if(NormalizeDouble(value1-level,ind_digits)<0 && NormalizeDouble(value0-level0,ind_digits)==0)
      return LINE_STATE_TOUCH_BELOW;
//--- The line touched the level from above (value1>level0 && value0==level0)
   if(NormalizeDouble(value1-level,ind_digits)>0 && NormalizeDouble(value0-level0,ind_digits)==0)
      return LINE_STATE_TOUCH_BELOW;
//--- Line is equal to the level value (value1==level0 && value0==level0)
   if(NormalizeDouble(value1-level,ind_digits)==0 && NormalizeDouble(value0-level0,ind_digits)==0)
      return LINE_STATE_EQUALS;
//--- Undefined state
   return LINE_STATE_NONE;
  }
//+------------------------------------------------------------------+
//| Return the indicator line state description                      |
//+------------------------------------------------------------------+
string LineStateDescription(const ENUM_LINE_STATE state)
  {
   switch(state)
     {
      case LINE_STATE_UP         :  return "Up";
      case LINE_STATE_STOP_UP    :  return "Stop Up";
      case LINE_STATE_TURN_UP    :  return "Turn Up";
      case LINE_STATE_DOWN       :  return "Down";
      case LINE_STATE_STOP_DOWN  :  return "Stop Down";
      case LINE_STATE_TURN_DOWN  :  return "Turn Down";
      case LINE_STATE_ABOVE      :  return "Above level";
      case LINE_STATE_UNDER      :  return "Under level";
      case LINE_STATE_CROSS_UP   :  return "Crossing Up";
      case LINE_STATE_CROSS_DOWN :  return "Crossing Down";
      case LINE_STATE_TOUCH_BELOW:  return "Touch from Below";
      case LINE_STATE_TOUCH_ABOVE:  return "Touch from Above";
      case LINE_STATE_EQUALS     :  return "Equals";
      default                    :  return "Unknown";
     }
  }
대시보드를 사용할 때 함수를 사용하여 패널에 데이터가 표시됩니다:
//+------------------------------------------------------------------+
//| Display data from the specified timeseries index to the panel    |
//+------------------------------------------------------------------+
void DrawData(const int index,const datetime time)
  {
//--- Declare the variables to receive data in them
   MqlTick  tick={0};
   MqlRates rates[1];

//--- Exit if unable to get the current prices
   if(!SymbolInfoTick(Symbol(),tick))
      return;
//--- Exit if unable to get the bar data by the specified index
   if(CopyRates(Symbol(),PERIOD_CURRENT,index,1,rates)!=1)
      return;

//--- Set font parameters for bar and indicator data headers
   int  size=0;
   uint flags=0;
   uint angle=0;
   string name=panel.FontParams(size,flags,angle);
   panel.SetFontParams(name,9,FW_BOLD);
   panel.DrawText("Bar data ["+(string)index+"]",3,panel.TableY1(0)-16,clrMaroon,panel.Width()-6);
   panel.DrawText("Indicator data ["+(string)index+"]",3,panel.TableY1(1)-16,clrGreen,panel.Width()-6);
//--- Set font parameters for bar and indicator data
   panel.SetFontParams(name,9);

//--- Display the data of the specified bar in table 0 on the panel
   panel.DrawText("Date",  panel.CellX(0,0,0)+2, panel.CellY(0,0,0)+2); panel.DrawText(TimeToString(  rates[0].time,TIME_DATE),     panel.CellX(0,0,1)+2, panel.CellY(0,0,1)+2,clrNONE,90);
   panel.DrawText("Time",  panel.CellX(0,1,0)+2, panel.CellY(0,1,0)+2); panel.DrawText(TimeToString(  rates[0].time,TIME_MINUTES),  panel.CellX(0,1,1)+2, panel.CellY(0,1,1)+2,clrNONE,90);
   panel.DrawText("Open",  panel.CellX(0,2,0)+2, panel.CellY(0,2,0)+2); panel.DrawText(DoubleToString(rates[0].open,Digits()),      panel.CellX(0,2,1)+2, panel.CellY(0,2,1)+2,clrNONE,90);
   panel.DrawText("High",  panel.CellX(0,3,0)+2, panel.CellY(0,3,0)+2); panel.DrawText(DoubleToString(rates[0].high,Digits()),      panel.CellX(0,3,1)+2, panel.CellY(0,3,1)+2,clrNONE,90);
   panel.DrawText("Low",   panel.CellX(0,4,0)+2, panel.CellY(0,4,0)+2); panel.DrawText(DoubleToString(rates[0].low,Digits()),       panel.CellX(0,4,1)+2, panel.CellY(0,4,1)+2,clrNONE,90);
   panel.DrawText("Close", panel.CellX(0,5,0)+2, panel.CellY(0,5,0)+2); panel.DrawText(DoubleToString(rates[0].close,Digits()),     panel.CellX(0,5,1)+2, panel.CellY(0,5,1)+2,clrNONE,90);

//--- Display the indicator data from the specified bar on the panel in table 1
   panel.DrawText(ind_title, panel.CellX(1,0,0)+2, panel.CellY(1,0,0)+2);
   double value0=IndicatorValue(handle,index,  0);
   double value1=IndicatorValue(handle,index+1,0);
   string value_str=(value0!=EMPTY_VALUE ? DoubleToString(value0,ind_digits) : "");
   color clr=(value0>value1 ? clrGreen : value0<value1 ? clrRed : clrNONE);
   panel.DrawText(value_str,panel.CellX(1,0,1)+2,panel.CellY(1,0,1)+2,clrNONE,90);

//--- Display a description of the indicator line state
   panel.DrawText("Line state", panel.CellX(1,1,0)+2, panel.CellY(1,1,0)+2);
   ENUM_LINE_STATE state=LineState(handle,index,0);
   panel.DrawText(LineStateDescription(state),panel.CellX(1,1,1)+2,panel.CellY(1,1,1)+2,clr,90);

//--- Redraw the chart to immediately display all changes on the panel
   ChartRedraw(ChartID());
  }
패널의 상태 텍스트 색상은 커서가 위치한 지표 열의 색상에 해당합니다.
또한 대시보드를 사용할 때 패널 이벤트 핸들러는 OnChartEvent() EA 이벤트 핸들러에서 호출되며 커서 아래의 바 인덱스를 수신하는 이벤트도 처리됩니다:
//+------------------------------------------------------------------+
//| ChartEvent function                                              |
//+------------------------------------------------------------------+
void OnChartEvent(const int id,
                  const long &lparam,
                  const double &dparam,
                  const string &sparam)
  {
//--- Handling the panel
//--- Call the panel event handler
   panel.OnChartEvent(id,lparam,dparam,sparam);

//--- If the cursor moves or a click is made on the chart
   if(id==CHARTEVENT_MOUSE_MOVE || id==CHARTEVENT_CLICK)
     {
      //--- Declare the variables to record time and price coordinates in them
      datetime time=0;
      double price=0;
      int wnd=0;
      //--- If the cursor coordinates are converted to date and time
      if(ChartXYToTimePrice(ChartID(),(int)lparam,(int)dparam,wnd,time,price))
        {
         //--- write the bar index where the cursor is located to a global variable
         mouse_bar_index=iBarShift(Symbol(),PERIOD_CURRENT,time);
         //--- Display the bar data under the cursor on the panel
         DrawData(mouse_bar_index,time);
        }
     }

//--- If we received a custom event, display the appropriate message in the journal
   if(id>CHARTEVENT_CUSTOM)
     {
      //--- Here we can implement handling a click on the close button on the panel
      PrintFormat("%s: Event id=%ld, object id (lparam): %lu, event message (sparam): %s",__FUNCTION__,id,lparam,sparam);
     }
  }
EA를 컴파일하고 차트에서 실행하면 패널에서 지표 값과 선의 상태를 모니터링할 수 있습니다:
이 문서에 첨부된 파일에서 TestVolumeVolumes.mq5 테스트 EA를 확인할 수 있습니다.
Bill Williams의 지표
빌 윌리엄스의 지표는 별도의 그룹에 포함됩니다. 왜냐하면 이들은 그의 책에서 설명하는 트레이딩 시스템의 일부이기 때문입니다.
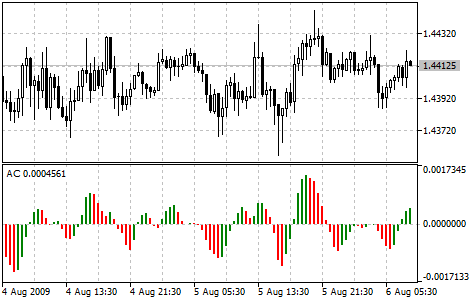
가속 오실레이터(Accelerator Oscillator)
가격은 가장 최근에 변경된 요소입니다. 가격 변동이 일어나기 전에 시장을 움직이는 힘이 방향을 바꾸는 경우 이 힘의 가속도는 반드시 느려지고 제로에 도달해야 하며 그런 다음 가격이 방향을 바꾸기 시작할 때까지 가속하기 시작합니다.
가속/감속 오실레이터 (AC)는 현재 주도하는 힘의 가속 및 감속을 측정합니다. 이 지표는 시장을 주도하는 힘이 변경되기 전에 방향을 바꾸고, 다시 말해 지표가 가격보다 먼저 방향을 바꿉니다. 가속/감속이 사전 경고의 신호라는 사실을 이해하면 우리는 분명한 이점을 얻을 수 있습니다.
제로선은 기본적으로 시장 주도의 힘과 가속도가 균형을 이루는 지점입니다. 가속/감속이 0보다 높으면 일반적으로 가속이 계속 상승하기가 더 쉽습니다(0보다 낮으면 그 반대의 경우도 마찬가지). 오썸 오실레이터와 달리 제로 라인 교차는 신호가 아닙니다. 시장을 통제하고 의사 결정을 내리기 위해 필요한 것은 색상의 변화를 주시하는 것입니다. 현재 열이 빨간색으로 표시되면 매수할 수 없고 현재 열이 녹색으로 표시되면 매도할 수 없다는 점을 기억해야 합니다.
만약 여러분이 시장 주도 세력의 방향으로 시장에 진입하면(매수 시 지표가 0보다 높거나, 매도 시 지표가 0보다 낮을 경우) 매수에는 녹색 열이 두 개만 있으면 됩니다(매도하려면 빨간색의 열이 두 개). 시장 주도의 힘이 오픈하려는 포지션에 반대되는 방향(매수 시 0 미만, 매도 시 0 이상)인 경우 확인이 필요하므로 추가적인 열이 필요합니다. 이 경우 지표에는 0선 위에 빨간색 열 3개가 표시되면 숏 포지션, 0선 아래에 녹색 열 3개가 표시되면 롱 포지션으로 표시됩니다.
매개변수
iAC() 함수는 지표 핸들을 만드는 데 사용됩니다:
액셀러레이터 오실레이터 지표를 생성하고 핸들을 반환합니다. 버퍼는 하나만 있습니다.
int  iAC(
   string           symbol,     // symbol name
   ENUM_TIMEFRAMES  period      // period
   );
symbol
[in] 금융 상품의 심볼 이름으로 지표 계산에 이 심볼의 데이터를 사용합니다. NULL은 현재 심볼을 의미합니다.
period
[in] 기간 값은 ENUM_TIMEFRAMES 열거형 값 중 하나이며 0은 현재 기간을 의미합니다.
지정된 기술 지표의 핸들을 반환합니다. 실패하면 INVALID_HANDLE을 반환합니다. 사용하지 않는 지표에서 컴퓨터 메모리를 확보하려면 지표 핸들이 전달되는 IndicatorRelease() 를 사용하세요.
EA에서 전역 변수를 선언하여 지표를 만듭니다(지표에는 오름차순 및 내림차순 히스토그램 열의 색상을 설정하는 것 외에는 입력할 것이 없습니다):
//+------------------------------------------------------------------+
//|                                               TestWilliamsAC.mq5 |
//|                                  Copyright 2023, MetaQuotes Ltd. |
//|                                             https://www.mql5.com |
//+------------------------------------------------------------------+
#property copyright "Copyright 2023, MetaQuotes Ltd."
#property link      "https://www.mql5.com"
#property version   "1.00"
//--- enums
enum ENUM_LINE_STATE
  {
   LINE_STATE_NONE,        // Undefined state
   LINE_STATE_UP,          // Upward
   LINE_STATE_DOWN,        // Downward
   LINE_STATE_TURN_UP,     // Upward reversal
   LINE_STATE_TURN_DOWN,   // Downward reversal
   LINE_STATE_STOP_UP,     // Upward stop
   LINE_STATE_STOP_DOWN,   // Downward stop
   LINE_STATE_ABOVE,       // Above value
   LINE_STATE_UNDER,       // Below value
   LINE_STATE_CROSS_UP,    // Crossing value upwards
   LINE_STATE_CROSS_DOWN,  // Crossing value downwards
   LINE_STATE_TOUCH_BELOW, // Touching value from below
   LINE_STATE_TOUCH_ABOVE, // Touch value from above
   LINE_STATE_EQUALS,      // Equal to value
  };
//--- global variables
int      handle=INVALID_HANDLE;  // Indicator handle
int      ind_digits=0;           // Number of decimal places in the indicator values
string   ind_title;              // Indicator description
EA에서 대시보드를 사용할 때는 전역 변수를 선언하고 패널 클래스 파일을 포함하세요:
//+------------------------------------------------------------------+
//|                                               TestWilliamsAC.mq5 |
//|                                  Copyright 2023, MetaQuotes Ltd. |
//|                                             https://www.mql5.com |
//+------------------------------------------------------------------+
#property copyright "Copyright 2023, MetaQuotes Ltd."
#property link      "https://www.mql5.com"
#property version   "1.00"
//--- includes
#include <Dashboard\Dashboard.mqh>
//--- enums
enum ENUM_LINE_STATE
  {
   LINE_STATE_NONE,        // Undefined state
   LINE_STATE_UP,          // Upward
   LINE_STATE_DOWN,        // Downward
   LINE_STATE_TURN_UP,     // Upward reversal
   LINE_STATE_TURN_DOWN,   // Downward reversal
   LINE_STATE_STOP_UP,     // Upward stop
   LINE_STATE_STOP_DOWN,   // Downward stop
   LINE_STATE_ABOVE,       // Above value
   LINE_STATE_UNDER,       // Below value
   LINE_STATE_CROSS_UP,    // Crossing value upwards
   LINE_STATE_CROSS_DOWN,  // Crossing value downwards
   LINE_STATE_TOUCH_BELOW, // Touching value from below
   LINE_STATE_TOUCH_ABOVE, // Touch value from above
   LINE_STATE_EQUALS,      // Equal to value
  };
//--- global variables
int      handle=INVALID_HANDLE;  // Indicator handle
int      ind_digits=0;           // Number of decimal places in the indicator values
string   ind_title;              // Indicator description
//--- variables for the panel
int      mouse_bar_index;        // Index of the bar the data is taken from
CDashboard *panel=NULL;          // Pointer to the panel object
초기화
지표의 전역 변수 값을 설정하고 핸들을 생성합니다:
//+------------------------------------------------------------------+
//| Expert initialization function                                   |
//+------------------------------------------------------------------+
int OnInit()
  {
//--- create timer
   EventSetTimer(60);

//--- Indicator
//--- Set the indicator name and the number of decimal places
   ind_title="AC";
   ind_digits=Digits()+2;
//--- Create indicator handle
   ResetLastError();
   handle=iAC(Symbol(),PERIOD_CURRENT);
   if(handle==INVALID_HANDLE)
     {
      PrintFormat("%s: Failed to create indicator handle %s. Error %ld",__FUNCTION__,ind_title,GetLastError());
      return INIT_FAILED;
     }

//--- Successful initialization
   return(INIT_SUCCEEDED);
  }
EA에 대시보드를 사용하는 기능이 있는 경우 여기에서 생성하세요:
//+------------------------------------------------------------------+
//| Expert initialization function                                   |
//+------------------------------------------------------------------+
int OnInit()
  {
//--- create timer
   EventSetTimer(60);

//--- Indicator
//--- Set the indicator name and the number of decimal places
   ind_title="AC";
   ind_digits=Digits()+2;
//--- Create indicator handle
   ResetLastError();
   handle=iAC(Symbol(),PERIOD_CURRENT);
   if(handle==INVALID_HANDLE)
     {
      PrintFormat("%s: Failed to create indicator handle %s. Error %ld",__FUNCTION__,ind_title,GetLastError());
      return INIT_FAILED;
     }

//--- Dashboard
//--- Create the panel
   panel=new CDashboard(1,20,20,199,225);
   if(panel==NULL)
     {
      Print("Error. Failed to create panel object");
      return INIT_FAILED;
     }
//--- Set font parameters
   panel.SetFontParams("Calibri",9);
//--- Display the panel with the "Symbol, Timeframe description" header text
   panel.View(Symbol()+", "+StringSubstr(EnumToString(Period()),7));
//--- Create a table with ID 0 to display bar data in it
   panel.CreateNewTable(0);
//--- Draw a table with ID 0 on the panel background
   panel.DrawGrid(0,2,20,6,2,18,97);

//--- Create a table with ID 1 to display indicator data in it
   panel.CreateNewTable(1);
//--- Get the Y2 table coordinate with ID 0 and
//--- set the Y1 coordinate for the table with ID 1
   int y1=panel.TableY2(0)+22;
//--- Draw a table with ID 1 on the panel background
   panel.DrawGrid(1,2,y1,3,2,18,97);

//--- Display tabular data in the journal
   panel.GridPrint(0,2);
   panel.GridPrint(1,2);
//--- Initialize the variable with the index of the mouse cursor bar
   mouse_bar_index=0;
//--- Display the data of the current bar on the panel
   DrawData(mouse_bar_index,TimeCurrent());

//--- Successful initialization
   return(INIT_SUCCEEDED);
  }
초기화 해제
EA OnDeinit() 핸들에서 지표 핸들을 릴리즈합니다:
//+------------------------------------------------------------------+
//| Expert deinitialization function                                 |
//+------------------------------------------------------------------+
void OnDeinit(const int reason)
  {
//--- destroy timer
   EventKillTimer();

//--- Release handle of the indicator
   ResetLastError();
   if(!IndicatorRelease(handle))
      PrintFormat("%s: IndicatorRelease failed. Error %ld",__FUNCTION__,GetLastError());
//--- Clear all comments on the chart
   Comment("");
  }
대시보드를 사용할 때 생성된 대시보드 객체가 제거됩니다:
//+------------------------------------------------------------------+
//| Expert deinitialization function                                 |
//+------------------------------------------------------------------+
void OnDeinit(const int reason)
  {
//--- destroy timer
   EventKillTimer();

//--- Release handle of the indicator
   ResetLastError();
   if(!IndicatorRelease(handle))
      PrintFormat("%s: IndicatorRelease failed. Error %ld",__FUNCTION__,GetLastError());
//--- Clear all comments on the chart
   Comment("");

//--- If the panel object exists, delete it
   if(panel!=NULL)
      delete panel;
  }
데이터 검색
지표 핸들로 데이터를 가져오는 일반적인 함수는 다음과 같습니다. 함수들은 오실레이터를 EA에 연결하는 방법에 대한 문서에서 검토했습니다. 제시된 함수는 사용자 지정 프로그램에서 '있는 그대로' 사용할 수 있습니다:
//+------------------------------------------------------------------+
//| Return the indicator data on the specified bar                   |
//+------------------------------------------------------------------+
double IndicatorValue(const int ind_handle,const int index,const int buffer_num)
  {
   double array[1]={0};
   ResetLastError();
   if(CopyBuffer(ind_handle,buffer_num,index,1,array)!=1)
     {
      PrintFormat("%s: CopyBuffer failed. Error %ld",__FUNCTION__,GetLastError());
      return EMPTY_VALUE;
     }
   return array[0];
  }
//+------------------------------------------------------------------+
//| Return the state of the indicator line                           |
//+------------------------------------------------------------------+
ENUM_LINE_STATE LineState(const int ind_handle,const int index,const int buffer_num)
  {
//--- Get the values of the indicator line with the shift (0,1,2) relative to the passed index
   const double value0=IndicatorValue(ind_handle,index,  buffer_num);
   const double value1=IndicatorValue(ind_handle,index+1,buffer_num);
   const double value2=IndicatorValue(ind_handle,index+2,buffer_num);
//--- If at least one of the values could not be obtained, return an undefined value
   if(value0==EMPTY_VALUE || value1==EMPTY_VALUE || value2==EMPTY_VALUE)
      return LINE_STATE_NONE;
//--- Line upward reversal (value2>value1 && value0>value1)
   if(NormalizeDouble(value2-value1,ind_digits)>0 && NormalizeDouble(value0-value1,ind_digits)>0)
      return LINE_STATE_TURN_UP;
//--- Line upward direction (value2<=value1 && value0>value1)
   else if(NormalizeDouble(value2-value1,ind_digits)<=0 && NormalizeDouble(value0-value1,ind_digits)>0)
      return LINE_STATE_UP;
//--- Line upward stop (value2<=value1 && value0==value1)
   else if(NormalizeDouble(value2-value1,ind_digits)<=0 && NormalizeDouble(value0-value1,ind_digits)==0)
      return LINE_STATE_STOP_UP;
//--- Line downward reversal (value2<value1 && value0<value1)
   if(NormalizeDouble(value2-value1,ind_digits)<0 && NormalizeDouble(value0-value1,ind_digits)<0)
      return LINE_STATE_TURN_DOWN;
//--- Line downward direction (value2>=value1 && value0<value1)
   else if(NormalizeDouble(value2-value1,ind_digits)>=0 && NormalizeDouble(value0-value1,ind_digits)<0)
      return LINE_STATE_DOWN;
//--- Line downward stop (value2>=value1 && value0==value1)
   else if(NormalizeDouble(value2-value1,ind_digits)>=0 && NormalizeDouble(value0-value1,ind_digits)==0)
      return LINE_STATE_STOP_DOWN;
//--- Undefined state
   return LINE_STATE_NONE;
  }
//+------------------------------------------------------------------+
//| Return the state of the line relative to the specified level     |
//+------------------------------------------------------------------+
ENUM_LINE_STATE LineStateRelative(const int ind_handle,const int index,const int buffer_num,const double level0,const double level1=EMPTY_VALUE)
  {
//--- Get the values of the indicator line with the shift (0,1) relative to the passed index
   const double value0=IndicatorValue(ind_handle,index,  buffer_num);
   const double value1=IndicatorValue(ind_handle,index+1,buffer_num);
//--- If at least one of the values could not be obtained, return an undefined value
   if(value0==EMPTY_VALUE || value1==EMPTY_VALUE)
      return LINE_STATE_NONE;
//--- Define the second level to compare
   double level=(level1==EMPTY_VALUE ? level0 : level1);
//--- The line is below the level (value1<level && value0<level0)
   if(NormalizeDouble(value1-level,ind_digits)<0 && NormalizeDouble(value0-level0,ind_digits)<0)
      return LINE_STATE_UNDER;
//--- The line is above the level (value1>level && value0>level0)
   if(NormalizeDouble(value1-level,ind_digits)>0 && NormalizeDouble(value0-level0,ind_digits)>0)
      return LINE_STATE_ABOVE;
//--- The line crossed the level upwards (value1<=level && value0>level0)
   if(NormalizeDouble(value1-level,ind_digits)<=0 && NormalizeDouble(value0-level0,ind_digits)>0)
      return LINE_STATE_CROSS_UP;
//--- The line crossed the level downwards (value1>=level && value0<level0)
   if(NormalizeDouble(value1-level,ind_digits)>=0 && NormalizeDouble(value0-level0,ind_digits)<0)
      return LINE_STATE_CROSS_DOWN;
//--- The line touched the level from below (value1<level0 && value0==level0)
   if(NormalizeDouble(value1-level,ind_digits)<0 && NormalizeDouble(value0-level0,ind_digits)==0)
      return LINE_STATE_TOUCH_BELOW;
//--- The line touched the level from above (value1>level0 && value0==level0)
   if(NormalizeDouble(value1-level,ind_digits)>0 && NormalizeDouble(value0-level0,ind_digits)==0)
      return LINE_STATE_TOUCH_BELOW;
//--- Line is equal to the level value (value1==level0 && value0==level0)
   if(NormalizeDouble(value1-level,ind_digits)==0 && NormalizeDouble(value0-level0,ind_digits)==0)
      return LINE_STATE_EQUALS;
//--- Undefined state
   return LINE_STATE_NONE;
  }
//+------------------------------------------------------------------+
//| Return the indicator line state description                      |
//+------------------------------------------------------------------+
string LineStateDescription(const ENUM_LINE_STATE state)
  {
   switch(state)
     {
      case LINE_STATE_UP         :  return "Up";
      case LINE_STATE_STOP_UP    :  return "Stop Up";
      case LINE_STATE_TURN_UP    :  return "Turn Up";
      case LINE_STATE_DOWN       :  return "Down";
      case LINE_STATE_STOP_DOWN  :  return "Stop Down";
      case LINE_STATE_TURN_DOWN  :  return "Turn Down";
      case LINE_STATE_ABOVE      :  return "Above level";
      case LINE_STATE_UNDER      :  return "Under level";
      case LINE_STATE_CROSS_UP   :  return "Crossing Up";
      case LINE_STATE_CROSS_DOWN :  return "Crossing Down";
      case LINE_STATE_TOUCH_BELOW:  return "Touch from Below";
      case LINE_STATE_TOUCH_ABOVE:  return "Touch from Above";
      case LINE_STATE_EQUALS     :  return "Equals";
      default                    :  return "Unknown";
     }
  }
대시보드를 사용할 때 함수를 사용하여 패널에 데이터가 표시됩니다:
//+------------------------------------------------------------------+
//| Display data from the specified timeseries index to the panel    |
//+------------------------------------------------------------------+
void DrawData(const int index,const datetime time)
  {
//--- Declare the variables to receive data in them
   MqlTick  tick={0};
   MqlRates rates[1];

//--- Exit if unable to get the current prices
   if(!SymbolInfoTick(Symbol(),tick))
      return;
//--- Exit if unable to get the bar data by the specified index
   if(CopyRates(Symbol(),PERIOD_CURRENT,index,1,rates)!=1)
      return;

//--- Set font parameters for bar and indicator data headers
   int  size=0;
   uint flags=0;
   uint angle=0;
   string name=panel.FontParams(size,flags,angle);
   panel.SetFontParams(name,9,FW_BOLD);
   panel.DrawText("Bar data ["+(string)index+"]",3,panel.TableY1(0)-16,clrMaroon,panel.Width()-6);
   panel.DrawText("Indicator data ["+(string)index+"]",3,panel.TableY1(1)-16,clrGreen,panel.Width()-6);
//--- Set font parameters for bar and indicator data
   panel.SetFontParams(name,9);

//--- Display the data of the specified bar in table 0 on the panel
   panel.DrawText("Date",  panel.CellX(0,0,0)+2, panel.CellY(0,0,0)+2); panel.DrawText(TimeToString(  rates[0].time,TIME_DATE),     panel.CellX(0,0,1)+2, panel.CellY(0,0,1)+2,clrNONE,90);
   panel.DrawText("Time",  panel.CellX(0,1,0)+2, panel.CellY(0,1,0)+2); panel.DrawText(TimeToString(  rates[0].time,TIME_MINUTES),  panel.CellX(0,1,1)+2, panel.CellY(0,1,1)+2,clrNONE,90);
   panel.DrawText("Open",  panel.CellX(0,2,0)+2, panel.CellY(0,2,0)+2); panel.DrawText(DoubleToString(rates[0].open,Digits()),      panel.CellX(0,2,1)+2, panel.CellY(0,2,1)+2,clrNONE,90);
   panel.DrawText("High",  panel.CellX(0,3,0)+2, panel.CellY(0,3,0)+2); panel.DrawText(DoubleToString(rates[0].high,Digits()),      panel.CellX(0,3,1)+2, panel.CellY(0,3,1)+2,clrNONE,90);
   panel.DrawText("Low",   panel.CellX(0,4,0)+2, panel.CellY(0,4,0)+2); panel.DrawText(DoubleToString(rates[0].low,Digits()),       panel.CellX(0,4,1)+2, panel.CellY(0,4,1)+2,clrNONE,90);
   panel.DrawText("Close", panel.CellX(0,5,0)+2, panel.CellY(0,5,0)+2); panel.DrawText(DoubleToString(rates[0].close,Digits()),     panel.CellX(0,5,1)+2, panel.CellY(0,5,1)+2,clrNONE,90);

//--- Display the indicator data from the specified bar on the panel in table 1
   panel.DrawText(ind_title, panel.CellX(1,0,0)+2, panel.CellY(1,0,0)+2);
   double value0=IndicatorValue(handle,index,  0);
   double value1=IndicatorValue(handle,index+1,0);
   string value_str=(value0!=EMPTY_VALUE ? DoubleToString(value0,ind_digits) : "");
   color clr=(value0>value1 ? clrGreen : value0<value1 ? clrRed : clrNONE);
   panel.DrawText(value_str,panel.CellX(1,0,1)+2,panel.CellY(1,0,1)+2,clrNONE,90);

//--- Display a description of the indicator line state
   panel.DrawText("Line state", panel.CellX(1,1,0)+2, panel.CellY(1,1,0)+2);
   ENUM_LINE_STATE state=LineState(handle,index,0);
   panel.DrawText(LineStateDescription(state),panel.CellX(1,1,1)+2,panel.CellY(1,1,1)+2,clr,90);

//--- Redraw the chart to immediately display all changes on the panel
   ChartRedraw(ChartID());
  }
대시보드의 표시줄 상태 텍스트 색상은 커서가 위치한 히스토그램의 열의 색상에 해당합니다.
또한 대시보드를 사용할 때 패널 이벤트 핸들러는 OnChartEvent() EA 이벤트 핸들러에서 호출되며 커서 아래의 바 인덱스를 수신하는 이벤트도 처리됩니다:
//+------------------------------------------------------------------+
//| ChartEvent function                                              |
//+------------------------------------------------------------------+
void OnChartEvent(const int id,
                  const long &lparam,
                  const double &dparam,
                  const string &sparam)
  {
//--- Handling the panel
//--- Call the panel event handler
   panel.OnChartEvent(id,lparam,dparam,sparam);

//--- If the cursor moves or a click is made on the chart
   if(id==CHARTEVENT_MOUSE_MOVE || id==CHARTEVENT_CLICK)
     {
      //--- Declare the variables to record time and price coordinates in them
      datetime time=0;
      double price=0;
      int wnd=0;
      //--- If the cursor coordinates are converted to date and time
      if(ChartXYToTimePrice(ChartID(),(int)lparam,(int)dparam,wnd,time,price))
        {
         //--- write the bar index where the cursor is located to a global variable
         mouse_bar_index=iBarShift(Symbol(),PERIOD_CURRENT,time);
         //--- Display the bar data under the cursor on the panel
         DrawData(mouse_bar_index,time);
        }
     }

//--- If we received a custom event, display the appropriate message in the journal
   if(id>CHARTEVENT_CUSTOM)
     {
      //--- Here we can implement handling a click on the close button on the panel
      PrintFormat("%s: Event id=%ld, object id (lparam): %lu, event message (sparam): %s",__FUNCTION__,id,lparam,sparam);
     }
  }
EA를 컴파일하고 차트에서 실행하면 패널에서 지표 값과 선의 상태를 모니터링할 수 있습니다:
이 문서에 첨부된 파일에서 TestWilliamsAC.mq5 테스트 EA를 확인할 수 있습니다.
악어(Alligator)
대부분의 경우 시장은 고정된 상태로 유지됩니다. 시장에서는 약 15~30%의 시간 동안만 추세가 생성되며 거래소에 있지 않은 트레이더는 대부분의 수익을 추세를 통해 얻습니다. 할아버지는 이렇게 말씀하시곤 하셨죠: "눈먼 닭도 항상 같은 시간에 먹이를 주면 옥수수를 찾을 수 있다"는 말이 있습니다. 우리는 이러한 추세에서 거래하는 것을 '맹목적인 치킨 마켓'이라고 부릅니다. 몇 년이 걸렸지만 '맹목적인 치킨 마켓'에 도달할 때까지 우리의 파우더를 항상 건조하게 유지할 수 있는 지표를 만들었습니다.
빌 윌리엄스
악어(Alligator)는 밸런스 라인(이동 평균)의 조합으로 프랙탈 지오메트리와 비선형 동역학을 사용합니다.
- 파란색 선(악어의 턱)은 그래프를 작성하는 데에 사용된 기간의 균형선(13주 평활 이동 평균, 미래로 8바씩 이동)입니다;
- 빨간색 선(악어의 이빨)은 상당 기간 동안의 균형선으로 한단계 낮은 차수 (8주 평활 이동 평균, 미래로 5바씩 이동)입니다.
- 녹색 선(악어의 입술)은 상당 기간 동안의 균형선이며, 또다른 한단계 낮은 차수(5주 평활 이동 평균, 미래로 3바씩 이동)입니다.
악어의 입술, 이빨, 턱은 다양한 기간의 상호작용을 보여줍니다. 시장 트렌드는 장중 15~30% 정도만 나타나기 때문에 우리는 특정 가격대 내에서만 변동하는 시장에서는 거래하지 말고 트렌드를 따라야 합니다.
턱, 이빨, 입술이 닫히거나 얽혀 있으면 악어가 잠을 자고 있거나 이미 잠을 자고 있는 것입니다. 잠을 자면 배고픔이 커지므로 잠을 많이 잘수록 깨어났을 때 더 배가 고파지게 됩니다. 잠에서 깨어나면 가장 먼저 입을 벌리고 하품을 하기 시작합니다. 그런 다음 매수세 혹은 매도세의 냄새가 나기 시작하고 이를 따라 사냥을 시작합니다. 포만감을 느낄 만큼 충분히 먹은 악어는 음식/가격에 대한 흥미를 잃기 시작합니다(균형선이 합쳐짐) - 이때가 익절을 할 때입니다.
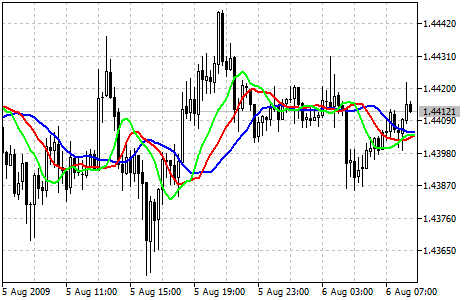
매개변수
지표 핸들을 생성하는 데는 iAlligator() 함수가 사용됩니다:
악어 지표 핸들을 반환합니다.
int  iAlligator(
   string              symbol,            // symbol name
   ENUM_TIMEFRAMES     period,            // period
   int                 jaw_period,        // period for calculating jaws
   int                 jaw_shift,         // horizontal shift of jaws
   int                 teeth_period,      // period for calculating teeth
   int                 teeth_shift,       // horizontal shift of teeth
   int                 lips_period,       // period for calculating lips
   int                 lips_shift,        // horizontal shift of lips
   ENUM_MA_METHOD      ma_method,         // smoothing type
   ENUM_APPLIED_PRICE  applied_price      // price type or handle
   );
symbol
[in] 금융 상품의 심볼 이름으로 지표 계산에 이 심볼의 데이터를 사용합니다. NULL은 현재 심볼을 의미합니다.
period
[in] 기간 값은 ENUM_TIMEFRAMES 열거형 값 중 하나이며 0은 현재 기간을 의미합니다.
jaw_period
[in] 파란색 선(악어의 턱) 평균 기간.
jaw_shift
[in] 가격 차트를 기준으로 파란색 선을 이동합니다.
teeth_period
[in] 빨간색 선(악어의 이빨) 평균 기간.
teeth_shift
[in] 가격 차트를 기준으로 빨간색 선을 이동합니다.
입술_기간
[in] 녹색 선(악어의 입술) 평균 기간.
lips_shift
[in] 가격 차트를 기준으로 녹색 선을 이동합니다.
ma_method
[in] 평균화 방법. ENUM_MA_METHOD 열거형 값 중 하나입니다.
applied_price
[in] 적용 가격. ENUM_APPLIED_PRICE 가격 상수 또는 다른 지표 핸들 중 하나입니다.
지정된 기술 지표의 핸들을 반환합니다. 실패하면 INVALID_HANDLE을 반환합니다. 사용하지 않는 지표에서 컴퓨터 메모리를 확보하려면 지표 핸들이 전달되는 IndicatorRelease() 를 사용하세요.
버퍼 인덱스: 0 — GATORJAW_LINE, 1 — GATORTEETH_LINE, 2 — GATORLIPS_LINE.
EA에서 입력 및 전역 변수를 선언하여 지표를 만듭니다:
//+------------------------------------------------------------------+
//|                                        TestWilliamsAlligator.mq5 |
//|                                  Copyright 2023, MetaQuotes Ltd. |
//|                                             https://www.mql5.com |
//+------------------------------------------------------------------+
#property copyright "Copyright 2023, MetaQuotes Ltd."
#property link      "https://www.mql5.com"
#property version   "1.00"
//--- enums
enum ENUM_LINE_STATE
  {
   LINE_STATE_NONE,        // Undefined state
   LINE_STATE_UP,          // Upward
   LINE_STATE_DOWN,        // Downward
   LINE_STATE_TURN_UP,     // Upward reversal
   LINE_STATE_TURN_DOWN,   // Downward reversal
   LINE_STATE_STOP_UP,     // Upward stop
   LINE_STATE_STOP_DOWN,   // Downward stop
   LINE_STATE_ABOVE,       // Above value
   LINE_STATE_UNDER,       // Below value
   LINE_STATE_CROSS_UP,    // Crossing value upwards
   LINE_STATE_CROSS_DOWN,  // Crossing value downwards
   LINE_STATE_TOUCH_BELOW, // Touching value from below
   LINE_STATE_TOUCH_ABOVE, // Touch value from above
   LINE_STATE_EQUALS,      // Equal to value
  };
//--- input parameters
input uint                 InpPeriodJaws  =  13;            /* Jaws Period    */
input int                  InpShiftJaws   =  8;             /* Jaws Shift     */
input uint                 InpPeriodTeeth =  8;             /* Teeth Period   */
input int                  InpShiftTeeth  =  5;             /* Teeth Shift    */
input uint                 InpPeriodLips  =  5;             /* Lips Period    */
input int                  InpShiftLips   =  3;             /* Lips Shift     */
input ENUM_MA_METHOD       InpMethod      =  MODE_SMMA;     /* Smoothed       */
input ENUM_APPLIED_PRICE   InpAppliedPrice=  PRICE_MEDIAN;  /* Applied Price  */
//--- global variables
int      handle=INVALID_HANDLE;  // Indicator handle
int      period_jaws=0;          // Jaws line calculation period
int      period_teeth=0;         // Teeth line calculation period
int      period_lips=0;          // Lips line calculation period
int      ind_digits=0;           // Number of decimal places in the indicator values
string   ind_title;              // Indicator description
EA에서 대시보드를 사용할 때는 전역 변수를 선언하고 패널 클래스 파일을 포함하세요:
//+------------------------------------------------------------------+
//|                                        TestWilliamsAlligator.mq5 |
//|                                  Copyright 2023, MetaQuotes Ltd. |
//|                                             https://www.mql5.com |
//+------------------------------------------------------------------+
#property copyright "Copyright 2023, MetaQuotes Ltd."
#property link      "https://www.mql5.com"
#property version   "1.00"
//--- includes
#include <Dashboard\Dashboard.mqh>
//--- enums
enum ENUM_LINE_STATE
  {
   LINE_STATE_NONE,        // Undefined state
   LINE_STATE_UP,          // Upward
   LINE_STATE_DOWN,        // Downward
   LINE_STATE_TURN_UP,     // Upward reversal
   LINE_STATE_TURN_DOWN,   // Downward reversal
   LINE_STATE_STOP_UP,     // Upward stop
   LINE_STATE_STOP_DOWN,   // Downward stop
   LINE_STATE_ABOVE,       // Above value
   LINE_STATE_UNDER,       // Below value
   LINE_STATE_CROSS_UP,    // Crossing value upwards
   LINE_STATE_CROSS_DOWN,  // Crossing value downwards
   LINE_STATE_TOUCH_BELOW, // Touching value from below
   LINE_STATE_TOUCH_ABOVE, // Touch value from above
   LINE_STATE_EQUALS,      // Equal to value
  };
//--- input parameters
input uint                 InpPeriodJaws  =  13;            /* Jaws Period    */
input int                  InpShiftJaws   =  8;             /* Jaws Shift     */
input uint                 InpPeriodTeeth =  8;             /* Teeth Period   */
input int                  InpShiftTeeth  =  5;             /* Teeth Shift    */
input uint                 InpPeriodLips  =  5;             /* Lips Period    */
input int                  InpShiftLips   =  3;             /* Lips Shift     */
input ENUM_MA_METHOD       InpMethod      =  MODE_SMMA;     /* Smoothed       */
input ENUM_APPLIED_PRICE   InpAppliedPrice=  PRICE_MEDIAN;  /* Applied Price  */
//--- global variables
int      handle=INVALID_HANDLE;  // Indicator handle
int      period_jaws=0;          // Jaws line calculation period
int      period_teeth=0;         // Teeth line calculation period
int      period_lips=0;          // Lips line calculation period
int      ind_digits=0;           // Number of decimal places in the indicator values
string   ind_title;              // Indicator description
//--- variables for the panel
int      mouse_bar_index;        // Index of the bar the data is taken from
CDashboard *panel=NULL;          // Pointer to the panel object
초기화
지표의 전역 변수 값을 설정하고 핸들을 생성합니다:
//+------------------------------------------------------------------+
//| Expert initialization function                                   |
//+------------------------------------------------------------------+
int OnInit()
  {
//--- create timer
   EventSetTimer(60);

//--- Indicator
//--- Set and adjust the calculation period if necessary
   period_jaws=int(InpPeriodJaws<1 ? 13 : InpPeriodJaws);
   period_teeth=int(InpPeriodTeeth<1 ? 8 : InpPeriodTeeth);
   period_lips=int(InpPeriodLips<1 ? 5 : InpPeriodLips);
//--- Set the indicator name and the number of decimal places
   ind_title=StringFormat("Alligator(%lu,%lu,%lu)",period_jaws,period_teeth,period_lips);
   ind_digits=Digits();
//--- Create indicator handle
   ResetLastError();
   handle=iAlligator(Symbol(),PERIOD_CURRENT,period_jaws,InpShiftJaws,period_teeth,InpShiftTeeth,period_lips,InpShiftLips,InpMethod,InpAppliedPrice);
   if(handle==INVALID_HANDLE)
     {
      PrintFormat("%s: Failed to create indicator handle %s. Error %ld",__FUNCTION__,ind_title,GetLastError());
      return INIT_FAILED;
     }

//--- Successful initialization
   return(INIT_SUCCEEDED);
  }
EA에 대시보드를 사용하는 기능이 있는 경우 여기에서 생성하세요:
//+------------------------------------------------------------------+
//| Expert initialization function                                   |
//+------------------------------------------------------------------+
int OnInit()
  {
//--- create timer
   EventSetTimer(60);

//--- Indicator
//--- Set and adjust the calculation period if necessary
   period_jaws=int(InpPeriodJaws<1 ? 13 : InpPeriodJaws);
   period_teeth=int(InpPeriodTeeth<1 ? 8 : InpPeriodTeeth);
   period_lips=int(InpPeriodLips<1 ? 5 : InpPeriodLips);
//--- Set the indicator name and the number of decimal places
   ind_title=StringFormat("Alligator(%lu,%lu,%lu)",period_jaws,period_teeth,period_lips);
   ind_digits=Digits();
//--- Create indicator handle
   ResetLastError();
   handle=iAlligator(Symbol(),PERIOD_CURRENT,period_jaws,InpShiftJaws,period_teeth,InpShiftTeeth,period_lips,InpShiftLips,InpMethod,InpAppliedPrice);
   if(handle==INVALID_HANDLE)
     {
      PrintFormat("%s: Failed to create indicator handle %s. Error %ld",__FUNCTION__,ind_title,GetLastError());
      return INIT_FAILED;
     }

//--- Dashboard
//--- Create the panel
   panel=new CDashboard(1,20,20,199,261);
   if(panel==NULL)
     {
      Print("Error. Failed to create panel object");
      return INIT_FAILED;
     }
//--- Set font parameters
   panel.SetFontParams("Calibri",9);
//--- Display the panel with the "Symbol, Timeframe description" header text
   panel.View(Symbol()+", "+StringSubstr(EnumToString(Period()),7));
//--- Create a table with ID 0 to display bar data in it
   panel.CreateNewTable(0);
//--- Draw a table with ID 0 on the panel background
   panel.DrawGrid(0,2,20,6,2,18,97);

//--- Create a table with ID 1 to display indicator data in it
   panel.CreateNewTable(1);
//--- Get the Y2 table coordinate with ID 0 and
//--- set the Y1 coordinate for the table with ID 1
   int y1=panel.TableY2(0)+22;
//--- Draw a table with ID 1 on the panel background
   panel.DrawGrid(1,2,y1,5,2,18,97);

//--- Display tabular data in the journal
   panel.GridPrint(0,2);
   panel.GridPrint(1,2);
//--- Initialize the variable with the index of the mouse cursor bar
   mouse_bar_index=0;
//--- Display the data of the current bar on the panel
   DrawData(mouse_bar_index,TimeCurrent());

//--- Successful initialization
   return(INIT_SUCCEEDED);
  }
초기화 해제
EA OnDeinit() 핸들에서 지표 핸들을 릴리즈합니다:
//+------------------------------------------------------------------+
//| Expert deinitialization function                                 |
//+------------------------------------------------------------------+
void OnDeinit(const int reason)
  {
//--- destroy timer
   EventKillTimer();

//--- Release handle of the indicator
   ResetLastError();
   if(!IndicatorRelease(handle))
      PrintFormat("%s: IndicatorRelease failed. Error %ld",__FUNCTION__,GetLastError());
//--- Clear all comments on the chart
   Comment("");
  }
대시보드를 사용할 때 생성된 대시보드 객체가 제거됩니다:
//+------------------------------------------------------------------+
//| Expert deinitialization function                                 |
//+------------------------------------------------------------------+
void OnDeinit(const int reason)
  {
//--- destroy timer
   EventKillTimer();

//--- Release handle of the indicator
   ResetLastError();
   if(!IndicatorRelease(handle))
      PrintFormat("%s: IndicatorRelease failed. Error %ld",__FUNCTION__,GetLastError());
//--- Clear all comments on the chart
   Comment("");

//--- If the panel object exists, delete it
   if(panel!=NULL)
      delete panel;
  }
데이터 검색
지표 핸들로 데이터를 가져오는 일반적인 함수는 다음과 같습니다. 함수들은 오실레이터를 EA에 연결하는 방법에 대한 문서에서 검토했습니다. 제시된 함수는 사용자 지정 프로그램에서 '있는 그대로' 사용할 수 있습니다:
//+------------------------------------------------------------------+
//| Return the indicator data on the specified bar                   |
//+------------------------------------------------------------------+
double IndicatorValue(const int ind_handle,const int index,const int buffer_num)
  {
   double array[1]={0};
   ResetLastError();
   if(CopyBuffer(ind_handle,buffer_num,index,1,array)!=1)
     {
      PrintFormat("%s: CopyBuffer failed. Error %ld",__FUNCTION__,GetLastError());
      return EMPTY_VALUE;
     }
   return array[0];
  }
//+------------------------------------------------------------------+
//| Return the state of the indicator line                           |
//+------------------------------------------------------------------+
ENUM_LINE_STATE LineState(const int ind_handle,const int index,const int buffer_num)
  {
//--- Get the values of the indicator line with the shift (0,1,2) relative to the passed index
   const double value0=IndicatorValue(ind_handle,index,  buffer_num);
   const double value1=IndicatorValue(ind_handle,index+1,buffer_num);
   const double value2=IndicatorValue(ind_handle,index+2,buffer_num);
//--- If at least one of the values could not be obtained, return an undefined value
   if(value0==EMPTY_VALUE || value1==EMPTY_VALUE || value2==EMPTY_VALUE)
      return LINE_STATE_NONE;
//--- Line upward reversal (value2>value1 && value0>value1)
   if(NormalizeDouble(value2-value1,ind_digits)>0 && NormalizeDouble(value0-value1,ind_digits)>0)
      return LINE_STATE_TURN_UP;
//--- Line upward direction (value2<=value1 && value0>value1)
   else if(NormalizeDouble(value2-value1,ind_digits)<=0 && NormalizeDouble(value0-value1,ind_digits)>0)
      return LINE_STATE_UP;
//--- Line upward stop (value2<=value1 && value0==value1)
   else if(NormalizeDouble(value2-value1,ind_digits)<=0 && NormalizeDouble(value0-value1,ind_digits)==0)
      return LINE_STATE_STOP_UP;
//--- Line downward reversal (value2<value1 && value0<value1)
   if(NormalizeDouble(value2-value1,ind_digits)<0 && NormalizeDouble(value0-value1,ind_digits)<0)
      return LINE_STATE_TURN_DOWN;
//--- Line downward direction (value2>=value1 && value0<value1)
   else if(NormalizeDouble(value2-value1,ind_digits)>=0 && NormalizeDouble(value0-value1,ind_digits)<0)
      return LINE_STATE_DOWN;
//--- Line downward stop (value2>=value1 && value0==value1)
   else if(NormalizeDouble(value2-value1,ind_digits)>=0 && NormalizeDouble(value0-value1,ind_digits)==0)
      return LINE_STATE_STOP_DOWN;
//--- Undefined state
   return LINE_STATE_NONE;
  }
//+------------------------------------------------------------------+
//| Return the state of the line relative to the specified level     |
//+------------------------------------------------------------------+
ENUM_LINE_STATE LineStateRelative(const int ind_handle,const int index,const int buffer_num,const double level0,const double level1=EMPTY_VALUE)
  {
//--- Get the values of the indicator line with the shift (0,1) relative to the passed index
   const double value0=IndicatorValue(ind_handle,index,  buffer_num);
   const double value1=IndicatorValue(ind_handle,index+1,buffer_num);
//--- If at least one of the values could not be obtained, return an undefined value
   if(value0==EMPTY_VALUE || value1==EMPTY_VALUE)
      return LINE_STATE_NONE;
//--- Define the second level to compare
   double level=(level1==EMPTY_VALUE ? level0 : level1);
//--- The line is below the level (value1<level && value0<level0)
   if(NormalizeDouble(value1-level,ind_digits)<0 && NormalizeDouble(value0-level0,ind_digits)<0)
      return LINE_STATE_UNDER;
//--- The line is above the level (value1>level && value0>level0)
   if(NormalizeDouble(value1-level,ind_digits)>0 && NormalizeDouble(value0-level0,ind_digits)>0)
      return LINE_STATE_ABOVE;
//--- The line crossed the level upwards (value1<=level && value0>level0)
   if(NormalizeDouble(value1-level,ind_digits)<=0 && NormalizeDouble(value0-level0,ind_digits)>0)
      return LINE_STATE_CROSS_UP;
//--- The line crossed the level downwards (value1>=level && value0<level0)
   if(NormalizeDouble(value1-level,ind_digits)>=0 && NormalizeDouble(value0-level0,ind_digits)<0)
      return LINE_STATE_CROSS_DOWN;
//--- The line touched the level from below (value1<level0 && value0==level0)
   if(NormalizeDouble(value1-level,ind_digits)<0 && NormalizeDouble(value0-level0,ind_digits)==0)
      return LINE_STATE_TOUCH_BELOW;
//--- The line touched the level from above (value1>level0 && value0==level0)
   if(NormalizeDouble(value1-level,ind_digits)>0 && NormalizeDouble(value0-level0,ind_digits)==0)
      return LINE_STATE_TOUCH_BELOW;
//--- Line is equal to the level value (value1==level0 && value0==level0)
   if(NormalizeDouble(value1-level,ind_digits)==0 && NormalizeDouble(value0-level0,ind_digits)==0)
      return LINE_STATE_EQUALS;
//--- Undefined state
   return LINE_STATE_NONE;
  }
//+------------------------------------------------------------------+
//| Return the indicator line state description                      |
//+------------------------------------------------------------------+
string LineStateDescription(const ENUM_LINE_STATE state)
  {
   switch(state)
     {
      case LINE_STATE_UP         :  return "Up";
      case LINE_STATE_STOP_UP    :  return "Stop Up";
      case LINE_STATE_TURN_UP    :  return "Turn Up";
      case LINE_STATE_DOWN       :  return "Down";
      case LINE_STATE_STOP_DOWN  :  return "Stop Down";
      case LINE_STATE_TURN_DOWN  :  return "Turn Down";
      case LINE_STATE_ABOVE      :  return "Above level";
      case LINE_STATE_UNDER      :  return "Under level";
      case LINE_STATE_CROSS_UP   :  return "Crossing Up";
      case LINE_STATE_CROSS_DOWN :  return "Crossing Down";
      case LINE_STATE_TOUCH_BELOW:  return "Touch from Below";
      case LINE_STATE_TOUCH_ABOVE:  return "Touch from Above";
      case LINE_STATE_EQUALS     :  return "Equals";
      default                    :  return "Unknown";
     }
  }
대시보드를 사용할 때 함수를 사용하여 패널에 데이터가 표시됩니다:
//+------------------------------------------------------------------+
//| Display data from the specified timeseries index to the panel    |
//+------------------------------------------------------------------+
void DrawData(const int index,const datetime time)
  {
//--- Declare the variables to receive data in them
   MqlTick  tick={0};
   MqlRates rates[1];

//--- Exit if unable to get the current prices
   if(!SymbolInfoTick(Symbol(),tick))
      return;
//--- Exit if unable to get the bar data by the specified index
   if(CopyRates(Symbol(),PERIOD_CURRENT,index,1,rates)!=1)
      return;

//--- Set font parameters for bar and indicator data headers
   int  size=0;
   uint flags=0;
   uint angle=0;
   string name=panel.FontParams(size,flags,angle);
   panel.SetFontParams(name,9,FW_BOLD);
   panel.DrawText("Bar data ["+(string)index+"]",3,panel.TableY1(0)-16,clrMaroon,panel.Width()-6);
   panel.DrawText("Indicator data ["+(string)index+"]",3,panel.TableY1(1)-16,clrGreen,panel.Width()-6);
//--- Set font parameters for bar and indicator data
   panel.SetFontParams(name,9);

//--- Display the data of the specified bar in table 0 on the panel
   panel.DrawText("Date",  panel.CellX(0,0,0)+2, panel.CellY(0,0,0)+2); panel.DrawText(TimeToString(  rates[0].time,TIME_DATE),     panel.CellX(0,0,1)+2, panel.CellY(0,0,1)+2,clrNONE,90);
   panel.DrawText("Time",  panel.CellX(0,1,0)+2, panel.CellY(0,1,0)+2); panel.DrawText(TimeToString(  rates[0].time,TIME_MINUTES),  panel.CellX(0,1,1)+2, panel.CellY(0,1,1)+2,clrNONE,90);
   panel.DrawText("Open",  panel.CellX(0,2,0)+2, panel.CellY(0,2,0)+2); panel.DrawText(DoubleToString(rates[0].open,Digits()),      panel.CellX(0,2,1)+2, panel.CellY(0,2,1)+2,clrNONE,90);
   panel.DrawText("High",  panel.CellX(0,3,0)+2, panel.CellY(0,3,0)+2); panel.DrawText(DoubleToString(rates[0].high,Digits()),      panel.CellX(0,3,1)+2, panel.CellY(0,3,1)+2,clrNONE,90);
   panel.DrawText("Low",   panel.CellX(0,4,0)+2, panel.CellY(0,4,0)+2); panel.DrawText(DoubleToString(rates[0].low,Digits()),       panel.CellX(0,4,1)+2, panel.CellY(0,4,1)+2,clrNONE,90);
   panel.DrawText("Close", panel.CellX(0,5,0)+2, panel.CellY(0,5,0)+2); panel.DrawText(DoubleToString(rates[0].close,Digits()),     panel.CellX(0,5,1)+2, panel.CellY(0,5,1)+2,clrNONE,90);

//--- Get the indicator lines data
   double value_jaws=IndicatorValue(handle,index,GATORJAW_LINE);
   double value_teeth=IndicatorValue(handle,index,GATORTEETH_LINE);
   double value_lips=IndicatorValue(handle,index,GATORLIPS_LINE);

//--- Display the Jaws line data from the specified bar on the panel in table 1
   string jaws_str=StringFormat("Jaws(%lu)",period_jaws);
   panel.DrawText(jaws_str, panel.CellX(1,0,0)+2, panel.CellY(1,0,0)+2);
   string value_str=(value_jaws!=EMPTY_VALUE ? DoubleToString(value_jaws,ind_digits) : "");
   panel.DrawText(value_str,panel.CellX(1,0,1)+2,panel.CellY(1,0,1)+2,clrNONE,90);
//--- Display the Teeth line data from the specified bar on the panel in table 1
   string teeth_str=StringFormat("Teeth(%lu)",period_teeth);
   panel.DrawText(teeth_str, panel.CellX(1,1,0)+2, panel.CellY(1,1,0)+2);
   value_str=(value_teeth!=EMPTY_VALUE ? DoubleToString(value_teeth,ind_digits) : "");
   panel.DrawText(value_str,panel.CellX(1,1,1)+2,panel.CellY(1,1,1)+2,clrNONE,90);
//--- Display the Lips line data from the specified bar on the panel in table 1
   string lips_str=StringFormat("Lips(%lu)",period_jaws);
   panel.DrawText(lips_str, panel.CellX(1,2,0)+2, panel.CellY(1,2,0)+2);
   value_str=(value_lips!=EMPTY_VALUE ? DoubleToString(value_lips,ind_digits) : "");
   panel.DrawText(value_str,panel.CellX(1,2,1)+2,panel.CellY(1,2,1)+2,clrNONE,90);

//--- Display a description of the Teeth line state relative to the Jaws line
   panel.DrawText("Teeth vs Jaws", panel.CellX(1,3,0)+2, panel.CellY(1,3,0)+2);
   ENUM_LINE_STATE state_tj=LineStateRelative(handle,index,1,value_jaws,IndicatorValue(handle,index+1,GATORJAW_LINE));
   string state_tj_str=
     (
      state_tj==LINE_STATE_ABOVE        ?  "Teeth > Jaws"  :
      state_tj==LINE_STATE_UNDER        ?  "Teeth < Jaws"  :
      state_tj==LINE_STATE_TOUCH_ABOVE  ||
      state_tj==LINE_STATE_TOUCH_BELOW  ?  "Touch"     :
      LineStateDescription(state_tj)
     );
//--- The label color changes depending on the value of the line relative to the level
   color clr=(state_tj==LINE_STATE_CROSS_UP || state_tj==LINE_STATE_ABOVE  ? clrBlue : state_tj==LINE_STATE_CROSS_DOWN || state_tj==LINE_STATE_UNDER ? clrRed : clrNONE);
   panel.DrawText(state_tj_str,panel.CellX(1,3,1)+2,panel.CellY(1,3,1)+2,clr,90);

//--- Display a description of the Lips line state relative to the Teeth line
   panel.DrawText("Lips vs Teeth", panel.CellX(1,4,0)+2, panel.CellY(1,4,0)+2);
   ENUM_LINE_STATE state_lt=LineStateRelative(handle,index,2,value_teeth,IndicatorValue(handle,index+1,GATORTEETH_LINE));
   string state_lt_str=
     (
      state_lt==LINE_STATE_ABOVE        ?  "Lips > Teeth"  :
      state_lt==LINE_STATE_UNDER        ?  "Lips < Teeth"  :
      state_lt==LINE_STATE_TOUCH_ABOVE  ||
      state_lt==LINE_STATE_TOUCH_BELOW  ?  "Touch"     :
      LineStateDescription(state_lt)
     );
//--- The label color changes depending on the value of the line relative to the level
   clr=(state_lt==LINE_STATE_CROSS_UP || state_lt==LINE_STATE_ABOVE  ? clrBlue : state_lt==LINE_STATE_CROSS_DOWN || state_lt==LINE_STATE_UNDER ? clrRed : clrNONE);
   panel.DrawText(state_lt_str,panel.CellX(1,4,1)+2,panel.CellY(1,4,1)+2,clr,90);

//--- Redraw the chart to immediately display all changes on the panel
   ChartRedraw(ChartID());
  }
커서 아래에 있는 바의 표시선 값 외에도 패널에는 치아 - 턱 선과 입술 - 치아 선의 비율 상태가 표시됩니다. 이들의 관계는 텍스트로 표시되며, 이들의 상대적인 위치는 표시된 텍스트의 색상으로 표시됩니다.
또한 대시보드를 사용할 때 패널 이벤트 핸들러는 OnChartEvent() EA 이벤트 핸들러에서 호출되며 커서 아래의 바 인덱스를 수신하는 이벤트도 처리됩니다:
//+------------------------------------------------------------------+
//| ChartEvent function                                              |
//+------------------------------------------------------------------+
void OnChartEvent(const int id,
                  const long &lparam,
                  const double &dparam,
                  const string &sparam)
  {
//--- Handling the panel
//--- Call the panel event handler
   panel.OnChartEvent(id,lparam,dparam,sparam);

//--- If the cursor moves or a click is made on the chart
   if(id==CHARTEVENT_MOUSE_MOVE || id==CHARTEVENT_CLICK)
     {
      //--- Declare the variables to record time and price coordinates in them
      datetime time=0;
      double price=0;
      int wnd=0;
      //--- If the cursor coordinates are converted to date and time
      if(ChartXYToTimePrice(ChartID(),(int)lparam,(int)dparam,wnd,time,price))
        {
         //--- write the bar index where the cursor is located to a global variable
         mouse_bar_index=iBarShift(Symbol(),PERIOD_CURRENT,time);
         //--- Display the bar data under the cursor on the panel
         DrawData(mouse_bar_index,time);
        }
     }

//--- If we received a custom event, display the appropriate message in the journal
   if(id>CHARTEVENT_CUSTOM)
     {
      //--- Here we can implement handling a click on the close button on the panel
      PrintFormat("%s: Event id=%ld, object id (lparam): %lu, event message (sparam): %s",__FUNCTION__,id,lparam,sparam);
     }
  }
EA를 컴파일하고 차트에서 실행하면 패널에서 지표 값과 선의 상태를 모니터링할 수 있습니다:
이 문서에 첨부된 파일에서 TestWilliamsAlligator.mq5 테스트 EA를 확인할 수 있습니다.
오썸 오실레이터(Awesome Oscillator)
빌 윌리엄스의 오썸 오실레이터 기술 지표 (AO)는 바의 중간 지점을 가로지르는 34주 단순 이동 평균으로 5주 단순이동평균에서 차감한 바의 중앙 지점(H+L)/2를 가로지르는 값입니다. 이는 현재 시장의 원동력에 어떤 일이 일어나고 있는지 아주 명확하게 보여줍니다.
유효한 매수 신호
- 받침 접시 신호의 경우 히스토그램의 방향이 아래쪽에서 위쪽으로 반전될 때 생성됩니다. 두 번째 열은 첫 번째 열보다 아래에 있으며 빨간색으로 표시됩니다. 세 번째 열은 두 번째 열보다 높으며 녹색으로 표시됩니다;
- 접시 신호가 생성되기 위해서는 히스토그램에 바가 3개 이상 있어야 합니다.
모든 오썸 오실레이터 열이 음수선 위에 있어야 접시 신호를 사용할 수 있다는 점에 유의하세요.
"제로 라인 교차"는 히스토그램이 음의 값에서 양의 값으로 이동할 때 형성되는 매수 신호입니다. 명심하세요:
- 이 신호가 생성되려면 두 개의 열만 필요합니다;
- 첫 번째 바는 0선 아래에 있어야 하고, 두 번째 바는 0선을 넘어야 합니다(음수 값에서 양수 값으로 전환);
- 매수 및 매도 신호를 동시에 생성하는 것은 불가능합니다.
"트윈 피크"는 히스토그램 값이 0보다 낮게 나타날 때 생성할 수 있는 유일한 매수 신호입니다. 다음 사항을 기억하세요:
- 신호는 영점선 아래를 가리키는 피크(가장 낮은 최저점)가 있고, 그 뒤에는 이전의 아래를 가리키는 피크보다 다소 높은(절대값이 작아 영점에 가까운 음수) 또 다른 아래를 가리키는 피크가 있을 때 생성됩니다;
- 히스토그램이 두 피크 사이의 0선 아래에 있어야 합니다. 바 차트가 피크 사이의 구간에서 0선을 넘으면 매수 신호가 작동하지 않습니다. 그러나 제로 라인 교차라는 다른 매수 신호가 생성됩니다;
- 바 차트의 각각의 새로운 피크는 이전 피크보다 더 높은 값(절대값이 작은 음수, 즉 0에 가까운 선)이 되어야 합니다;
- 추가적으로 더 높은 피크가 형성되고(네트 라인에 더 가깝게) 막대 차트가 제로 라인을 넘지 않은 경우 추가 매수 신호가 생성됩니다.
매도 신호
오썸 오실레이터 매도 신호는 매수 신호와 동일합니다. 소스 신호는 0 이하로 반전됩니다. 제로 라인 교차가 감소 추세에 있는 경우 - 첫 번째 바는 0보다 위에 있고 두 번째 막대는 그 아래에 있습니다. 두 개의 피크 신호는 0보다 높으며 반전된 신호이기도 합니다.
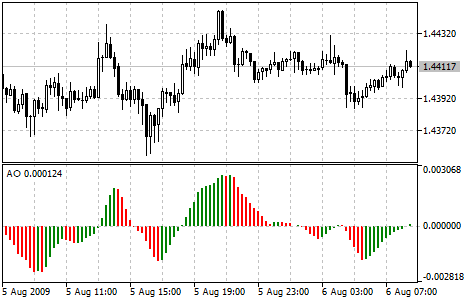
매개변수
iAO() 함수는 지표 핸들을 만드는 데 사용됩니다:
오썸 오실레이터 지표 핸들을 반환합니다. 버퍼는 하나만 있습니다.
int  iAO(
   string           symbol,     // symbol name
   ENUM_TIMEFRAMES  period      // period
   );
symbol
[in] 금융 상품의 심볼 이름으로 지표 계산에 이 심볼의 데이터를 사용합니다. NULL은 현재 심볼을 의미합니다.
period
[in] 기간 값은 ENUM_TIMEFRAMES 열거형 값 중 하나이며 0은 현재 기간을 의미합니다.
지정된 기술 지표의 핸들을 반환합니다. 실패하면 INVALID_HANDLE을 반환합니다. 사용하지 않는 지표에서 컴퓨터 메모리를 확보하려면 지표 핸들이 전달되는 IndicatorRelease() 를 사용하세요.
EA에서 입력 및 전역 변수를 선언하여 지표를 만듭니다:
//+------------------------------------------------------------------+
//|                                               TestWilliamsAO.mq5 |
//|                                  Copyright 2023, MetaQuotes Ltd. |
//|                                             https://www.mql5.com |
//+------------------------------------------------------------------+
#property copyright "Copyright 2023, MetaQuotes Ltd."
#property link      "https://www.mql5.com"
#property version   "1.00"
//--- enums
enum ENUM_LINE_STATE
  {
   LINE_STATE_NONE,        // Undefined state
   LINE_STATE_UP,          // Upward
   LINE_STATE_DOWN,        // Downward
   LINE_STATE_TURN_UP,     // Upward reversal
   LINE_STATE_TURN_DOWN,   // Downward reversal
   LINE_STATE_STOP_UP,     // Upward stop
   LINE_STATE_STOP_DOWN,   // Downward stop
   LINE_STATE_ABOVE,       // Above value
   LINE_STATE_UNDER,       // Below value
   LINE_STATE_CROSS_UP,    // Crossing value upwards
   LINE_STATE_CROSS_DOWN,  // Crossing value downwards
   LINE_STATE_TOUCH_BELOW, // Touching value from below
   LINE_STATE_TOUCH_ABOVE, // Touch value from above
   LINE_STATE_EQUALS,      // Equal to value
  };
//--- global variables
int      handle=INVALID_HANDLE;  // Indicator handle
int      ind_digits=0;           // Number of decimal places in the indicator values
string   ind_title;              // Indicator description
EA에서 대시보드를 사용할 때는 전역 변수를 선언하고 패널 클래스 파일을 포함하세요:
//+------------------------------------------------------------------+
//|                                               TestWilliamsAO.mq5 |
//|                                  Copyright 2023, MetaQuotes Ltd. |
//|                                             https://www.mql5.com |
//+------------------------------------------------------------------+
#property copyright "Copyright 2023, MetaQuotes Ltd."
#property link      "https://www.mql5.com"
#property version   "1.00"
//--- includes
#include <Dashboard\Dashboard.mqh>
//--- enums
enum ENUM_LINE_STATE
  {
   LINE_STATE_NONE,        // Undefined state
   LINE_STATE_UP,          // Upward
   LINE_STATE_DOWN,        // Downward
   LINE_STATE_TURN_UP,     // Upward reversal
   LINE_STATE_TURN_DOWN,   // Downward reversal
   LINE_STATE_STOP_UP,     // Upward stop
   LINE_STATE_STOP_DOWN,   // Downward stop
   LINE_STATE_ABOVE,       // Above value
   LINE_STATE_UNDER,       // Below value
   LINE_STATE_CROSS_UP,    // Crossing value upwards
   LINE_STATE_CROSS_DOWN,  // Crossing value downwards
   LINE_STATE_TOUCH_BELOW, // Touching value from below
   LINE_STATE_TOUCH_ABOVE, // Touch value from above
   LINE_STATE_EQUALS,      // Equal to value
  };
//--- global variables
int      handle=INVALID_HANDLE;  // Indicator handle
int      ind_digits=0;           // Number of decimal places in the indicator values
string   ind_title;              // Indicator description
//--- variables for the panel
int      mouse_bar_index;        // Index of the bar the data is taken from
CDashboard *panel=NULL;          // Pointer to the panel object
초기화
지표의 전역 변수 값을 설정하고 핸들을 생성합니다:
//+------------------------------------------------------------------+
//| Expert initialization function                                   |
//+------------------------------------------------------------------+
int OnInit()
  {
//--- create timer
   EventSetTimer(60);

//--- Indicator
//--- Set the indicator name and the number of decimal places
   ind_title="AO";
   ind_digits=Digits()+1;
//--- Create indicator handle
   ResetLastError();
   handle=iAO(Symbol(),PERIOD_CURRENT);
   if(handle==INVALID_HANDLE)
     {
      PrintFormat("%s: Failed to create indicator handle %s. Error %ld",__FUNCTION__,ind_title,GetLastError());
      return INIT_FAILED;
     }

//--- Successful initialization
   return(INIT_SUCCEEDED);
  }
EA에 대시보드를 사용하는 기능이 있는 경우 여기에서 생성하세요:
//+------------------------------------------------------------------+
//| Expert initialization function                                   |
//+------------------------------------------------------------------+
int OnInit()
  {
//--- create timer
   EventSetTimer(60);

//--- Indicator
//--- Set the indicator name and the number of decimal places
   ind_title="AO";
   ind_digits=Digits()+1;
//--- Create indicator handle
   ResetLastError();
   handle=iAO(Symbol(),PERIOD_CURRENT);
   if(handle==INVALID_HANDLE)
     {
      PrintFormat("%s: Failed to create indicator handle %s. Error %ld",__FUNCTION__,ind_title,GetLastError());
      return INIT_FAILED;
     }

//--- Dashboard
//--- Create the panel
   panel=new CDashboard(1,20,20,199,225);
   if(panel==NULL)
     {
      Print("Error. Failed to create panel object");
      return INIT_FAILED;
     }
//--- Set font parameters
   panel.SetFontParams("Calibri",9);
//--- Display the panel with the "Symbol, Timeframe description" header text
   panel.View(Symbol()+", "+StringSubstr(EnumToString(Period()),7));
//--- Create a table with ID 0 to display bar data in it
   panel.CreateNewTable(0);
//--- Draw a table with ID 0 on the panel background
   panel.DrawGrid(0,2,20,6,2,18,97);

//--- Create a table with ID 1 to display indicator data in it
   panel.CreateNewTable(1);
//--- Get the Y2 table coordinate with ID 0 and
//--- set the Y1 coordinate for the table with ID 1
   int y1=panel.TableY2(0)+22;
//--- Draw a table with ID 1 on the panel background
   panel.DrawGrid(1,2,y1,3,2,18,97);

//--- Display tabular data in the journal
   panel.GridPrint(0,2);
   panel.GridPrint(1,2);
//--- Initialize the variable with the index of the mouse cursor bar
   mouse_bar_index=0;
//--- Display the data of the current bar on the panel
   DrawData(mouse_bar_index,TimeCurrent());

//--- Successful initialization
   return(INIT_SUCCEEDED);
  }
초기화 해제
EA OnDeinit() 핸들에서 지표 핸들을 릴리즈합니다:
//+------------------------------------------------------------------+
//| Expert deinitialization function                                 |
//+------------------------------------------------------------------+
void OnDeinit(const int reason)
  {
//--- destroy timer
   EventKillTimer();

//--- Release handle of the indicator
   ResetLastError();
   if(!IndicatorRelease(handle))
      PrintFormat("%s: IndicatorRelease failed. Error %ld",__FUNCTION__,GetLastError());
//--- Clear all comments on the chart
   Comment("");
  }
대시보드를 사용할 때 생성된 대시보드 객체가 제거됩니다:
//+------------------------------------------------------------------+
//| Expert deinitialization function                                 |
//+------------------------------------------------------------------+
void OnDeinit(const int reason)
  {
//--- destroy timer
   EventKillTimer();

//--- Release handle of the indicator
   ResetLastError();
   if(!IndicatorRelease(handle))
      PrintFormat("%s: IndicatorRelease failed. Error %ld",__FUNCTION__,GetLastError());
//--- Clear all comments on the chart
   Comment("");

//--- If the panel object exists, delete it
   if(panel!=NULL)
      delete panel;
  }
데이터 검색
지표 핸들로 데이터를 가져오는 일반적인 함수는 다음과 같습니다. 함수들은 오실레이터를 EA에 연결하는 방법에 대한 문서에서 검토했습니다. 제시된 함수는 사용자 지정 프로그램에서 '있는 그대로' 사용할 수 있습니다:
//+------------------------------------------------------------------+
//| Return the indicator data on the specified bar                   |
//+------------------------------------------------------------------+
double IndicatorValue(const int ind_handle,const int index,const int buffer_num)
  {
   double array[1]={0};
   ResetLastError();
   if(CopyBuffer(ind_handle,buffer_num,index,1,array)!=1)
     {
      PrintFormat("%s: CopyBuffer failed. Error %ld",__FUNCTION__,GetLastError());
      return EMPTY_VALUE;
     }
   return array[0];
  }
//+------------------------------------------------------------------+
//| Return the state of the indicator line                           |
//+------------------------------------------------------------------+
ENUM_LINE_STATE LineState(const int ind_handle,const int index,const int buffer_num)
  {
//--- Get the values of the indicator line with the shift (0,1,2) relative to the passed index
   const double value0=IndicatorValue(ind_handle,index,  buffer_num);
   const double value1=IndicatorValue(ind_handle,index+1,buffer_num);
   const double value2=IndicatorValue(ind_handle,index+2,buffer_num);
//--- If at least one of the values could not be obtained, return an undefined value
   if(value0==EMPTY_VALUE || value1==EMPTY_VALUE || value2==EMPTY_VALUE)
      return LINE_STATE_NONE;
//--- Line upward reversal (value2>value1 && value0>value1)
   if(NormalizeDouble(value2-value1,ind_digits)>0 && NormalizeDouble(value0-value1,ind_digits)>0)
      return LINE_STATE_TURN_UP;
//--- Line upward direction (value2<=value1 && value0>value1)
   else if(NormalizeDouble(value2-value1,ind_digits)<=0 && NormalizeDouble(value0-value1,ind_digits)>0)
      return LINE_STATE_UP;
//--- Line upward stop (value2<=value1 && value0==value1)
   else if(NormalizeDouble(value2-value1,ind_digits)<=0 && NormalizeDouble(value0-value1,ind_digits)==0)
      return LINE_STATE_STOP_UP;
//--- Line downward reversal (value2<value1 && value0<value1)
   if(NormalizeDouble(value2-value1,ind_digits)<0 && NormalizeDouble(value0-value1,ind_digits)<0)
      return LINE_STATE_TURN_DOWN;
//--- Line downward direction (value2>=value1 && value0<value1)
   else if(NormalizeDouble(value2-value1,ind_digits)>=0 && NormalizeDouble(value0-value1,ind_digits)<0)
      return LINE_STATE_DOWN;
//--- Line downward stop (value2>=value1 && value0==value1)
   else if(NormalizeDouble(value2-value1,ind_digits)>=0 && NormalizeDouble(value0-value1,ind_digits)==0)
      return LINE_STATE_STOP_DOWN;
//--- Undefined state
   return LINE_STATE_NONE;
  }
//+------------------------------------------------------------------+
//| Return the state of the line relative to the specified level     |
//+------------------------------------------------------------------+
ENUM_LINE_STATE LineStateRelative(const int ind_handle,const int index,const int buffer_num,const double level0,const double level1=EMPTY_VALUE)
  {
//--- Get the values of the indicator line with the shift (0,1) relative to the passed index
   const double value0=IndicatorValue(ind_handle,index,  buffer_num);
   const double value1=IndicatorValue(ind_handle,index+1,buffer_num);
//--- If at least one of the values could not be obtained, return an undefined value
   if(value0==EMPTY_VALUE || value1==EMPTY_VALUE)
      return LINE_STATE_NONE;
//--- Define the second level to compare
   double level=(level1==EMPTY_VALUE ? level0 : level1);
//--- The line is below the level (value1<level && value0<level0)
   if(NormalizeDouble(value1-level,ind_digits)<0 && NormalizeDouble(value0-level0,ind_digits)<0)
      return LINE_STATE_UNDER;
//--- The line is above the level (value1>level && value0>level0)
   if(NormalizeDouble(value1-level,ind_digits)>0 && NormalizeDouble(value0-level0,ind_digits)>0)
      return LINE_STATE_ABOVE;
//--- The line crossed the level upwards (value1<=level && value0>level0)
   if(NormalizeDouble(value1-level,ind_digits)<=0 && NormalizeDouble(value0-level0,ind_digits)>0)
      return LINE_STATE_CROSS_UP;
//--- The line crossed the level downwards (value1>=level && value0<level0)
   if(NormalizeDouble(value1-level,ind_digits)>=0 && NormalizeDouble(value0-level0,ind_digits)<0)
      return LINE_STATE_CROSS_DOWN;
//--- The line touched the level from below (value1<level0 && value0==level0)
   if(NormalizeDouble(value1-level,ind_digits)<0 && NormalizeDouble(value0-level0,ind_digits)==0)
      return LINE_STATE_TOUCH_BELOW;
//--- The line touched the level from above (value1>level0 && value0==level0)
   if(NormalizeDouble(value1-level,ind_digits)>0 && NormalizeDouble(value0-level0,ind_digits)==0)
      return LINE_STATE_TOUCH_BELOW;
//--- Line is equal to the level value (value1==level0 && value0==level0)
   if(NormalizeDouble(value1-level,ind_digits)==0 && NormalizeDouble(value0-level0,ind_digits)==0)
      return LINE_STATE_EQUALS;
//--- Undefined state
   return LINE_STATE_NONE;
  }
//+------------------------------------------------------------------+
//| Return the indicator line state description                      |
//+------------------------------------------------------------------+
string LineStateDescription(const ENUM_LINE_STATE state)
  {
   switch(state)
     {
      case LINE_STATE_UP         :  return "Up";
      case LINE_STATE_STOP_UP    :  return "Stop Up";
      case LINE_STATE_TURN_UP    :  return "Turn Up";
      case LINE_STATE_DOWN       :  return "Down";
      case LINE_STATE_STOP_DOWN  :  return "Stop Down";
      case LINE_STATE_TURN_DOWN  :  return "Turn Down";
      case LINE_STATE_ABOVE      :  return "Above level";
      case LINE_STATE_UNDER      :  return "Under level";
      case LINE_STATE_CROSS_UP   :  return "Crossing Up";
      case LINE_STATE_CROSS_DOWN :  return "Crossing Down";
      case LINE_STATE_TOUCH_BELOW:  return "Touch from Below";
      case LINE_STATE_TOUCH_ABOVE:  return "Touch from Above";
      case LINE_STATE_EQUALS     :  return "Equals";
      default                    :  return "Unknown";
     }
  }
대시보드를 사용할 때 함수를 사용하여 패널에 데이터가 표시됩니다:
//+------------------------------------------------------------------+
//| Display data from the specified timeseries index to the panel    |
//+------------------------------------------------------------------+
void DrawData(const int index,const datetime time)
  {
//--- Declare the variables to receive data in them
   MqlTick  tick={0};
   MqlRates rates[1];

//--- Exit if unable to get the current prices
   if(!SymbolInfoTick(Symbol(),tick))
      return;
//--- Exit if unable to get the bar data by the specified index
   if(CopyRates(Symbol(),PERIOD_CURRENT,index,1,rates)!=1)
      return;

//--- Set font parameters for bar and indicator data headers
   int  size=0;
   uint flags=0;
   uint angle=0;
   string name=panel.FontParams(size,flags,angle);
   panel.SetFontParams(name,9,FW_BOLD);
   panel.DrawText("Bar data ["+(string)index+"]",3,panel.TableY1(0)-16,clrMaroon,panel.Width()-6);
   panel.DrawText("Indicator data ["+(string)index+"]",3,panel.TableY1(1)-16,clrGreen,panel.Width()-6);
//--- Set font parameters for bar and indicator data
   panel.SetFontParams(name,9);

//--- Display the data of the specified bar in table 0 on the panel
   panel.DrawText("Date",  panel.CellX(0,0,0)+2, panel.CellY(0,0,0)+2); panel.DrawText(TimeToString(  rates[0].time,TIME_DATE),     panel.CellX(0,0,1)+2, panel.CellY(0,0,1)+2,clrNONE,90);
   panel.DrawText("Time",  panel.CellX(0,1,0)+2, panel.CellY(0,1,0)+2); panel.DrawText(TimeToString(  rates[0].time,TIME_MINUTES),  panel.CellX(0,1,1)+2, panel.CellY(0,1,1)+2,clrNONE,90);
   panel.DrawText("Open",  panel.CellX(0,2,0)+2, panel.CellY(0,2,0)+2); panel.DrawText(DoubleToString(rates[0].open,Digits()),      panel.CellX(0,2,1)+2, panel.CellY(0,2,1)+2,clrNONE,90);
   panel.DrawText("High",  panel.CellX(0,3,0)+2, panel.CellY(0,3,0)+2); panel.DrawText(DoubleToString(rates[0].high,Digits()),      panel.CellX(0,3,1)+2, panel.CellY(0,3,1)+2,clrNONE,90);
   panel.DrawText("Low",   panel.CellX(0,4,0)+2, panel.CellY(0,4,0)+2); panel.DrawText(DoubleToString(rates[0].low,Digits()),       panel.CellX(0,4,1)+2, panel.CellY(0,4,1)+2,clrNONE,90);
   panel.DrawText("Close", panel.CellX(0,5,0)+2, panel.CellY(0,5,0)+2); panel.DrawText(DoubleToString(rates[0].close,Digits()),     panel.CellX(0,5,1)+2, panel.CellY(0,5,1)+2,clrNONE,90);

//--- Display the indicator data from the specified bar on the panel in table 1
   panel.DrawText(ind_title, panel.CellX(1,0,0)+2, panel.CellY(1,0,0)+2);
   double value0=IndicatorValue(handle,index,  0);
   double value1=IndicatorValue(handle,index+1,0);
   string value_str=(value0!=EMPTY_VALUE ? DoubleToString(value0,ind_digits) : "");
   color clr=(value0>value1 ? clrGreen : value0<value1 ? clrRed : clrNONE);
   panel.DrawText(value_str,panel.CellX(1,0,1)+2,panel.CellY(1,0,1)+2,clrNONE,90);

//--- Display a description of the indicator line state
   panel.DrawText("Line state", panel.CellX(1,1,0)+2, panel.CellY(1,1,0)+2);
   ENUM_LINE_STATE state=LineState(handle,index,0);
   panel.DrawText(LineStateDescription(state),panel.CellX(1,1,1)+2,panel.CellY(1,1,1)+2,clr,90);

//--- Display a description of the indicator line state relative to zero
   panel.DrawText("AO vs Zero", panel.CellX(1,2,0)+2, panel.CellY(1,2,0)+2);
   ENUM_LINE_STATE state_zero=LineStateRelative(handle,index,0,0);
   string state_zero_str=
     (
      state_zero==LINE_STATE_ABOVE        ?  "AO > 0"  :
      state_zero==LINE_STATE_UNDER        ?  "AO < 0"  :
      state_zero==LINE_STATE_TOUCH_ABOVE  ||
      state_zero==LINE_STATE_TOUCH_BELOW  ?  "Touch"     :
      LineStateDescription(state_zero)
     );
//--- The label color changes depending on the value of the line relative to the level
   clr=(state_zero==LINE_STATE_CROSS_UP ? clrGreen : state_zero==LINE_STATE_CROSS_DOWN ? clrRed : clrNONE);
   panel.DrawText(state_zero_str,panel.CellX(1,2,1)+2,panel.CellY(1,2,1)+2,clr,90);

//--- Redraw the chart to immediately display all changes on the panel
   ChartRedraw(ChartID());
  }
패널에는 커서 아래에 위치한 히스토그램 열의 색상이 표시되는 지표의 선의 상태를 설명하는 것 외에도 0을 기준으로 한 지표 선의 위치의 상태가 표시됩니다. 지표 선이 영점선을 위쪽으로 넘으면 녹색 텍스트로 표시되고 아래쪽 방향이면 빨간색 텍스트로 표시됩니다.
또한 대시보드를 사용할 때 패널 이벤트 핸들러는 OnChartEvent() EA 이벤트 핸들러에서 호출되며 커서 아래의 바 인덱스를 수신하는 이벤트도 처리됩니다:
//+------------------------------------------------------------------+
//| ChartEvent function                                              |
//+------------------------------------------------------------------+
void OnChartEvent(const int id,
                  const long &lparam,
                  const double &dparam,
                  const string &sparam)
  {
//--- Handling the panel
//--- Call the panel event handler
   panel.OnChartEvent(id,lparam,dparam,sparam);

//--- If the cursor moves or a click is made on the chart
   if(id==CHARTEVENT_MOUSE_MOVE || id==CHARTEVENT_CLICK)
     {
      //--- Declare the variables to record time and price coordinates in them
      datetime time=0;
      double price=0;
      int wnd=0;
      //--- If the cursor coordinates are converted to date and time
      if(ChartXYToTimePrice(ChartID(),(int)lparam,(int)dparam,wnd,time,price))
        {
         //--- write the bar index where the cursor is located to a global variable
         mouse_bar_index=iBarShift(Symbol(),PERIOD_CURRENT,time);
         //--- Display the bar data under the cursor on the panel
         DrawData(mouse_bar_index,time);
        }
     }

//--- If we received a custom event, display the appropriate message in the journal
   if(id>CHARTEVENT_CUSTOM)
     {
      //--- Here we can implement handling a click on the close button on the panel
      PrintFormat("%s: Event id=%ld, object id (lparam): %lu, event message (sparam): %s",__FUNCTION__,id,lparam,sparam);
     }
  }
EA를 컴파일하고 차트에서 실행하면 패널에서 지표 값과 선의 상태를 모니터링할 수 있습니다:
이 문서에 첨부된 파일에서 TestWilliamsAO.mq5 테스트 EA를 확인할 수 있습니다.
프랙탈(Fractals)
모든 시장은 대부분의 시간 동안에는 가격이 그리 크게 변동하지 않으며 추세 변화는 짧은 기간(15~30%)에만 일어난다는 특징이 있습니다. 가장 수익성이 좋은 시기는 일반적으로 특정 추세에 따라 시장 가격이 변동하는 시기입니다.
프랙탈은 빌 윌리엄스의 트레이딩 시스템에서 바닥 또는 고점을 감지할 수 있는 5가지 지표 중 하나입니다. 상향 프랙탈의 기술적 정의는 최소 5개 이상의 연속 막대가 있으며 가장 높은 최대값 앞뒤에 낮은 최대값을 가진 막대가 두 개씩 있는 것입니다. 반전 세트는 중간에 가장 낮은 저점이 있고 양쪽에 두 개의 높은 저점이 있는 최소 5개의 연속 막대로 매도 프랙탈과 상관관계가 있습니다. 그래프에서 프랙탈은 높음과 낮음 값을 가지며 위쪽 또는 아래쪽 화살표로 표시됩니다.
프랙탈 기술 지표의 신호는 악어 기술 지표를 사용하여 필터링해야 합니다. 프랙탈이 악어의 이빨보다 낮으면 매수 거래를 청산해서는 안 되며 프랙탈이 악어의 이빨보다 높으면 매도 거래를 청산해서는 안 됩니다. 프랙탈 신호가 형성되고 악어의 턱 너머의 위치에 따라 결정되는 프랙탈 신호가 계속 그 세를 유지한 이후 이 신호는 악어의 턱 넘어의 프랙탈 위치나 더 최근의 프랙탈 신호가 나타날 때까지 신호로 남아 있게 됩니다.
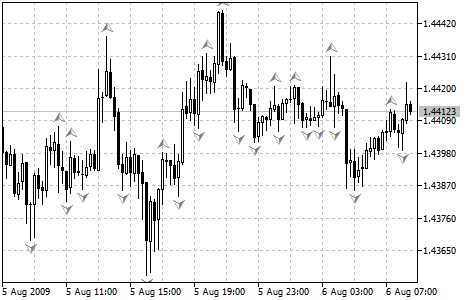
매개변수
iFractals() 함수는 지표 핸들을 만드는 데 사용됩니다:
프랙탈 지표 핸들을 반환합니다.
int  iFractals(
   string           symbol,     // symbol name
   ENUM_TIMEFRAMES  period      // period
   );
symbol
[in] 금융 상품의 심볼 이름으로 지표 계산에 이 심볼의 데이터를 사용합니다. NULL은 현재 심볼을 의미합니다.
period
[in] 기간 값은 ENUM_TIMEFRAMES 열거형 값 중 하나이며 0은 현재 기간을 의미합니다.
Return Value
지정된 기술 지표의 핸들을 반환합니다. 실패하면 INVALID_HANDLE을 반환합니다. 사용하지 않는 지표에서 컴퓨터 메모리를 확보하려면 지표 핸들이 전달되는 IndicatorRelease() 를 사용하세요.
버퍼 인덱스: 0 — UPPER_LINE, 1 — LOWER_LINE.
EA에서 입력 및 전역 변수를 선언하여 지표를 만듭니다:
//+------------------------------------------------------------------+
//|                                         TestWilliamsFractals.mq5 |
//|                                  Copyright 2023, MetaQuotes Ltd. |
//|                                             https://www.mql5.com |
//+------------------------------------------------------------------+
#property copyright "Copyright 2023, MetaQuotes Ltd."
#property link      "https://www.mql5.com"
#property version   "1.00"
//--- global variables
int      handle=INVALID_HANDLE;  // Indicator handle
int      ind_digits=0;           // Number of decimal places in the indicator values
string   ind_title;              // Indicator description
EA에서 대시보드를 사용할 때는 전역 변수를 선언하고 패널 클래스 파일을 포함하세요:
//+------------------------------------------------------------------+
//|                                         TestWilliamsFractals.mq5 |
//|                                  Copyright 2023, MetaQuotes Ltd. |
//|                                             https://www.mql5.com |
//+------------------------------------------------------------------+
#property copyright "Copyright 2023, MetaQuotes Ltd."
#property link      "https://www.mql5.com"
#property version   "1.00"
//--- includes
#include <Dashboard\Dashboard.mqh>
//--- global variables
int      handle=INVALID_HANDLE;  // Indicator handle
int      ind_digits=0;           // Number of decimal places in the indicator values
string   ind_title;              // Indicator description
//--- variables for the panel
int      mouse_bar_index;        // Index of the bar the data is taken from
CDashboard *panel=NULL;          // Pointer to the panel object
초기화
지표의 전역 변수 값을 설정하고 핸들을 생성합니다:
//+------------------------------------------------------------------+
//| Expert initialization function                                   |
//+------------------------------------------------------------------+
int OnInit()
  {
//--- create timer
   EventSetTimer(60);

//--- Indicator
//--- Set the indicator name and the number of decimal places
   ind_title="Fractals";
   ind_digits=Digits();
//--- Create indicator handle
   ResetLastError();
   handle=iFractals(Symbol(),PERIOD_CURRENT);
   if(handle==INVALID_HANDLE)
     {
      PrintFormat("%s: Failed to create indicator handle %s. Error %ld",__FUNCTION__,ind_title,GetLastError());
      return INIT_FAILED;
     }

//--- Successful initialization
   return(INIT_SUCCEEDED);
  }
EA에 대시보드를 사용하는 기능이 있는 경우 여기에서 생성하세요:
//+------------------------------------------------------------------+
//| Expert initialization function                                   |
//+------------------------------------------------------------------+
int OnInit()
  {
//--- create timer
   EventSetTimer(60);

//--- Indicator
//--- Set the indicator name and the number of decimal places
   ind_title="Fractals";
   ind_digits=Digits();
//--- Create indicator handle
   ResetLastError();
   handle=iFractals(Symbol(),PERIOD_CURRENT);
   if(handle==INVALID_HANDLE)
     {
      PrintFormat("%s: Failed to create indicator handle %s. Error %ld",__FUNCTION__,ind_title,GetLastError());
      return INIT_FAILED;
     }

//--- Dashboard
//--- Create the panel
   panel=new CDashboard(1,20,20,199,225);
   if(panel==NULL)
     {
      Print("Error. Failed to create panel object");
      return INIT_FAILED;
     }
//--- Set font parameters
   panel.SetFontParams("Calibri",9);
//--- Display the panel with the "Symbol, Timeframe description" header text
   panel.View(Symbol()+", "+StringSubstr(EnumToString(Period()),7));
//--- Create a table with ID 0 to display bar data in it
   panel.CreateNewTable(0);
//--- Draw a table with ID 0 on the panel background
   panel.DrawGrid(0,2,20,6,2,18,97);

//--- Create a table with ID 1 to display indicator data in it
   panel.CreateNewTable(1);
//--- Get the Y2 table coordinate with ID 0 and
//--- set the Y1 coordinate for the table with ID 1
   int y1=panel.TableY2(0)+22;
//--- Draw a table with ID 1 on the panel background
   panel.DrawGrid(1,2,y1,3,2,18,97);

//--- Display tabular data in the journal
   panel.GridPrint(0,2);
   panel.GridPrint(1,2);
//--- Initialize the variable with the index of the mouse cursor bar
   mouse_bar_index=0;
//--- Display the data of the current bar on the panel
   DrawData(mouse_bar_index,TimeCurrent());

//--- Successful initialization
   return(INIT_SUCCEEDED);
  }
초기화 해제
EA OnDeinit() 핸들에서 지표 핸들을 릴리즈합니다:
//+------------------------------------------------------------------+
//| Expert deinitialization function                                 |
//+------------------------------------------------------------------+
void OnDeinit(const int reason)
  {
//--- destroy timer
   EventKillTimer();

//--- Release handle of the indicator
   ResetLastError();
   if(!IndicatorRelease(handle))
      PrintFormat("%s: IndicatorRelease failed. Error %ld",__FUNCTION__,GetLastError());
//--- Clear all comments on the chart
   Comment("");
  }
대시보드를 사용할 때 생성된 대시보드 객체가 제거됩니다:
//+------------------------------------------------------------------+
//| Expert deinitialization function                                 |
//+------------------------------------------------------------------+
void OnDeinit(const int reason)
  {
//--- destroy timer
   EventKillTimer();

//--- Release handle of the indicator
   ResetLastError();
   if(!IndicatorRelease(handle))
      PrintFormat("%s: IndicatorRelease failed. Error %ld",__FUNCTION__,GetLastError());
//--- Clear all comments on the chart
   Comment("");

//--- If the panel object exists, delete it
   if(panel!=NULL)
      delete panel;
  }
데이터 검색
지표 핸들로 데이터를 가져오는 일반적인 함수는 다음과 같습니다. 함수들은 오실레이터를 EA에 연결하는 방법에 대한 문서에서 검토했습니다. 제시된 함수는 사용자 지정 프로그램에서 '있는 그대로' 사용할 수 있습니다:
//+------------------------------------------------------------------+
//| Return the indicator data on the specified bar                   |
//+------------------------------------------------------------------+
double IndicatorValue(const int ind_handle,const int index,const int buffer_num)
  {
   double array[1]={0};
   ResetLastError();
   if(CopyBuffer(ind_handle,buffer_num,index,1,array)!=1)
     {
      PrintFormat("%s: CopyBuffer failed. Error %ld",__FUNCTION__,GetLastError());
      return EMPTY_VALUE;
     }
   return array[0];
  }
//+------------------------------------------------------------------+
//| Return the state of the indicator line                           |
//+------------------------------------------------------------------+
ENUM_LINE_STATE LineState(const int ind_handle,const int index,const int buffer_num)
  {
//--- Get the values of the indicator line with the shift (0,1,2) relative to the passed index
   const double value0=IndicatorValue(ind_handle,index,  buffer_num);
   const double value1=IndicatorValue(ind_handle,index+1,buffer_num);
   const double value2=IndicatorValue(ind_handle,index+2,buffer_num);
//--- If at least one of the values could not be obtained, return an undefined value
   if(value0==EMPTY_VALUE || value1==EMPTY_VALUE || value2==EMPTY_VALUE)
      return LINE_STATE_NONE;
//--- Line upward reversal (value2>value1 && value0>value1)
   if(NormalizeDouble(value2-value1,ind_digits)>0 && NormalizeDouble(value0-value1,ind_digits)>0)
      return LINE_STATE_TURN_UP;
//--- Line upward direction (value2<=value1 && value0>value1)
   else if(NormalizeDouble(value2-value1,ind_digits)<=0 && NormalizeDouble(value0-value1,ind_digits)>0)
      return LINE_STATE_UP;
//--- Line upward stop (value2<=value1 && value0==value1)
   else if(NormalizeDouble(value2-value1,ind_digits)<=0 && NormalizeDouble(value0-value1,ind_digits)==0)
      return LINE_STATE_STOP_UP;
//--- Line downward reversal (value2<value1 && value0<value1)
   if(NormalizeDouble(value2-value1,ind_digits)<0 && NormalizeDouble(value0-value1,ind_digits)<0)
      return LINE_STATE_TURN_DOWN;
//--- Line downward direction (value2>=value1 && value0<value1)
   else if(NormalizeDouble(value2-value1,ind_digits)>=0 && NormalizeDouble(value0-value1,ind_digits)<0)
      return LINE_STATE_DOWN;
//--- Line downward stop (value2>=value1 && value0==value1)
   else if(NormalizeDouble(value2-value1,ind_digits)>=0 && NormalizeDouble(value0-value1,ind_digits)==0)
      return LINE_STATE_STOP_DOWN;
//--- Undefined state
   return LINE_STATE_NONE;
  }
//+------------------------------------------------------------------+
//| Return the state of the line relative to the specified level     |
//+------------------------------------------------------------------+
ENUM_LINE_STATE LineStateRelative(const int ind_handle,const int index,const int buffer_num,const double level0,const double level1=EMPTY_VALUE)
  {
//--- Get the values of the indicator line with the shift (0,1) relative to the passed index
   const double value0=IndicatorValue(ind_handle,index,  buffer_num);
   const double value1=IndicatorValue(ind_handle,index+1,buffer_num);
//--- If at least one of the values could not be obtained, return an undefined value
   if(value0==EMPTY_VALUE || value1==EMPTY_VALUE)
      return LINE_STATE_NONE;
//--- Define the second level to compare
   double level=(level1==EMPTY_VALUE ? level0 : level1);
//--- The line is below the level (value1<level && value0<level0)
   if(NormalizeDouble(value1-level,ind_digits)<0 && NormalizeDouble(value0-level0,ind_digits)<0)
      return LINE_STATE_UNDER;
//--- The line is above the level (value1>level && value0>level0)
   if(NormalizeDouble(value1-level,ind_digits)>0 && NormalizeDouble(value0-level0,ind_digits)>0)
      return LINE_STATE_ABOVE;
//--- The line crossed the level upwards (value1<=level && value0>level0)
   if(NormalizeDouble(value1-level,ind_digits)<=0 && NormalizeDouble(value0-level0,ind_digits)>0)
      return LINE_STATE_CROSS_UP;
//--- The line crossed the level downwards (value1>=level && value0<level0)
   if(NormalizeDouble(value1-level,ind_digits)>=0 && NormalizeDouble(value0-level0,ind_digits)<0)
      return LINE_STATE_CROSS_DOWN;
//--- The line touched the level from below (value1<level0 && value0==level0)
   if(NormalizeDouble(value1-level,ind_digits)<0 && NormalizeDouble(value0-level0,ind_digits)==0)
      return LINE_STATE_TOUCH_BELOW;
//--- The line touched the level from above (value1>level0 && value0==level0)
   if(NormalizeDouble(value1-level,ind_digits)>0 && NormalizeDouble(value0-level0,ind_digits)==0)
      return LINE_STATE_TOUCH_BELOW;
//--- Line is equal to the level value (value1==level0 && value0==level0)
   if(NormalizeDouble(value1-level,ind_digits)==0 && NormalizeDouble(value0-level0,ind_digits)==0)
      return LINE_STATE_EQUALS;
//--- Undefined state
   return LINE_STATE_NONE;
  }
//+------------------------------------------------------------------+
//| Return the indicator line state description                      |
//+------------------------------------------------------------------+
string LineStateDescription(const ENUM_LINE_STATE state)
  {
   switch(state)
     {
      case LINE_STATE_UP         :  return "Up";
      case LINE_STATE_STOP_UP    :  return "Stop Up";
      case LINE_STATE_TURN_UP    :  return "Turn Up";
      case LINE_STATE_DOWN       :  return "Down";
      case LINE_STATE_STOP_DOWN  :  return "Stop Down";
      case LINE_STATE_TURN_DOWN  :  return "Turn Down";
      case LINE_STATE_ABOVE      :  return "Above level";
      case LINE_STATE_UNDER      :  return "Under level";
      case LINE_STATE_CROSS_UP   :  return "Crossing Up";
      case LINE_STATE_CROSS_DOWN :  return "Crossing Down";
      case LINE_STATE_TOUCH_BELOW:  return "Touch from Below";
      case LINE_STATE_TOUCH_ABOVE:  return "Touch from Above";
      case LINE_STATE_EQUALS     :  return "Equals";
      default                    :  return "Unknown";
     }
  }
대시보드를 사용할 때 함수를 사용하여 패널에 데이터가 표시됩니다:
//+------------------------------------------------------------------+
//| Display data from the specified timeseries index to the panel    |
//+------------------------------------------------------------------+
void DrawData(const int index,const datetime time)
  {
//--- Declare the variables to receive data in them
   MqlTick  tick={0};
   MqlRates rates[1];

//--- Exit if unable to get the current prices
   if(!SymbolInfoTick(Symbol(),tick))
      return;
//--- Exit if unable to get the bar data by the specified index
   if(CopyRates(Symbol(),PERIOD_CURRENT,index,1,rates)!=1)
      return;

//--- Set font parameters for bar and indicator data headers
   int  size=0;
   uint flags=0;
   uint angle=0;
   string name=panel.FontParams(size,flags,angle);
   panel.SetFontParams(name,9,FW_BOLD);
   panel.DrawText("Bar data ["+(string)index+"]",3,panel.TableY1(0)-16,clrMaroon,panel.Width()-6);
   panel.DrawText("Indicator data ["+(string)index+"]",3,panel.TableY1(1)-16,clrGreen,panel.Width()-6);
//--- Set font parameters for bar and indicator data
   panel.SetFontParams(name,9);

//--- Display the data of the specified bar in table 0 on the panel
   panel.DrawText("Date",  panel.CellX(0,0,0)+2, panel.CellY(0,0,0)+2); panel.DrawText(TimeToString(  rates[0].time,TIME_DATE),     panel.CellX(0,0,1)+2, panel.CellY(0,0,1)+2,clrNONE,90);
   panel.DrawText("Time",  panel.CellX(0,1,0)+2, panel.CellY(0,1,0)+2); panel.DrawText(TimeToString(  rates[0].time,TIME_MINUTES),  panel.CellX(0,1,1)+2, panel.CellY(0,1,1)+2,clrNONE,90);
   panel.DrawText("Open",  panel.CellX(0,2,0)+2, panel.CellY(0,2,0)+2); panel.DrawText(DoubleToString(rates[0].open,Digits()),      panel.CellX(0,2,1)+2, panel.CellY(0,2,1)+2,clrNONE,90);
   panel.DrawText("High",  panel.CellX(0,3,0)+2, panel.CellY(0,3,0)+2); panel.DrawText(DoubleToString(rates[0].high,Digits()),      panel.CellX(0,3,1)+2, panel.CellY(0,3,1)+2,clrNONE,90);
   panel.DrawText("Low",   panel.CellX(0,4,0)+2, panel.CellY(0,4,0)+2); panel.DrawText(DoubleToString(rates[0].low,Digits()),       panel.CellX(0,4,1)+2, panel.CellY(0,4,1)+2,clrNONE,90);
   panel.DrawText("Close", panel.CellX(0,5,0)+2, panel.CellY(0,5,0)+2); panel.DrawText(DoubleToString(rates[0].close,Digits()),     panel.CellX(0,5,1)+2, panel.CellY(0,5,1)+2,clrNONE,90);

//--- Display the indicator data from the specified bar on the panel in table 1 (upper fractal)
   panel.DrawText(ind_title+" Up", panel.CellX(1,0,0)+2, panel.CellY(1,0,0)+2);
   double value0=IndicatorValue(handle,index,UPPER_LINE);
   string value_str0=(value0!=EMPTY_VALUE ? DoubleToString(value0,ind_digits) : " ");
   panel.DrawText(value_str0,panel.CellX(1,0,1)+2,panel.CellY(1,0,1)+2,clrNONE,90);

//--- Display the indicator data from the specified bar on the panel in table 1 (lower fractal)
   panel.DrawText(ind_title+" Down", panel.CellX(1,1,0)+2, panel.CellY(1,1,0)+2);
   double value1=IndicatorValue(handle,index,LOWER_LINE);
   string value_str1=(value1!=EMPTY_VALUE ? DoubleToString(value1,ind_digits) : " ");
   panel.DrawText(value_str1,panel.CellX(1,1,1)+2,panel.CellY(1,1,1)+2,clrNONE,90);

//--- Redraw the chart to immediately display all changes on the panel
   ChartRedraw(ChartID());
  }
또한 대시보드를 사용할 때 패널 이벤트 핸들러는 OnChartEvent() EA 이벤트 핸들러에서 호출되며 커서 아래의 바 인덱스를 수신하는 이벤트도 처리됩니다:
//+------------------------------------------------------------------+
//| ChartEvent function                                              |
//+------------------------------------------------------------------+
void OnChartEvent(const int id,
                  const long &lparam,
                  const double &dparam,
                  const string &sparam)
  {
//--- Handling the panel
//--- Call the panel event handler
   panel.OnChartEvent(id,lparam,dparam,sparam);

//--- If the cursor moves or a click is made on the chart
   if(id==CHARTEVENT_MOUSE_MOVE || id==CHARTEVENT_CLICK)
     {
      //--- Declare the variables to record time and price coordinates in them
      datetime time=0;
      double price=0;
      int wnd=0;
      //--- If the cursor coordinates are converted to date and time
      if(ChartXYToTimePrice(ChartID(),(int)lparam,(int)dparam,wnd,time,price))
        {
         //--- write the bar index where the cursor is located to a global variable
         mouse_bar_index=iBarShift(Symbol(),PERIOD_CURRENT,time);
         //--- Display the bar data under the cursor on the panel
         DrawData(mouse_bar_index,time);
        }
     }

//--- If we received a custom event, display the appropriate message in the journal
   if(id>CHARTEVENT_CUSTOM)
     {
      //--- Here we can implement handling a click on the close button on the panel
      PrintFormat("%s: Event id=%ld, object id (lparam): %lu, event message (sparam): %s",__FUNCTION__,id,lparam,sparam);
     }
  }
차트에서 EA를 컴파일하고 실행한 후 대시보드에서 지표 버퍼 값을 제어할 수 있습니다:
이 문서에 첨부된 파일에서 TestWilliamsFractals.mq5 테스트 EA를 확인할 수 있습니다.
게이터 오실레이터(Gator Oscillator)
게이터 오실레이터는 악어 지표를 기준으로 하며 균형선 (평활화 이동 평균)title의 수렴/발산 정도를 보여줍니다. 상단 히스토그램은 파란색 선과 빨간색 선의 값의 절대적인 차이입니다. 하단 히스토그램은 빨간색 선과 녹색 선의 값 사이의 절대적인 차이이지만 히스토그램이 하향식으로 그려지기 때문에 마이너스 기호가 표시됩니다.
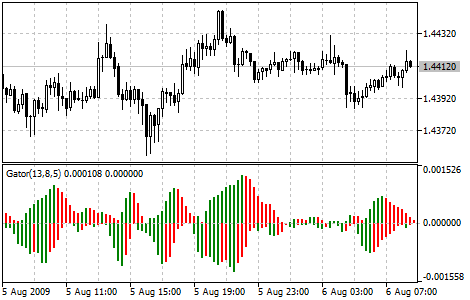
매개변수
iGator() 함수는 지표 핸들을 만드는 데 사용됩니다:
게이터 지표 핸들을 반환합니다. 오실레이터는 파란색과 빨간색 악어 선(위쪽 히스토그램)의 차이와 빨간색과 녹색 선(아래쪽 히스토그램)의 차이를 표시합니다.
int  iGator(
   string              symbol,            // symbol name
   ENUM_TIMEFRAMES     period,            // period
   int                 jaw_period,        // period for calculating jaws
   int                 jaw_shift,         // horizontal shift of jaws
   int                 teeth_period,      // period for calculating teeth
   int                 teeth_shift,       // teeth shift
   int                 lips_period,       // period for calculating lips
   int                 lips_shift,        // horizontal shift of lips
   ENUM_MA_METHOD      ma_method,         // smoothing type
   ENUM_APPLIED_PRICE  applied_price      // price type or handle
   );
symbol
[in] 금융 상품의 심볼 이름으로 지표 계산에 이 심볼의 데이터를 사용합니다. NULL은 현재 심볼을 의미합니다.
period
[in] 기간 값은 ENUM_TIMEFRAMES 열거형 값 중 하나이며 0은 현재 기간을 의미합니다.
jaw_period
[in] 파란색 선(악어의 턱) 평균 기간.
jaw_shift
[in] 가격 차트를 기준으로 악어 지표의 파란색 선이 이동합니다. 지표 히스토그램의 시각적 변화와 직접적인 관련은 없습니다.
teeth_period
[in] 빨간색 선(악어의 이빨) 평균 기간.
teeth_shift
[in] 가격 차트를 기준으로 악어 지표의 빨간색 선이 이동합니다. 지표 히스토그램의 시각적 변화와 직접적인 관련은 없습니다.
lips_period
[in] 녹색 선(악어의 입술) 평균 기간.
lips_shift
[in] 가격 차트를 기준으로 악어 지표의 녹색 선이 이동합니다. 지표 히스토그램의 시각적 변화와 직접적인 관련은 없습니다.
ma_method
[in] 평균화 방법. ENUM_MA_METHOD 열거형의 모든 값을 가질 수 있습니다.
applied_price
[in] 적용 가격. ENUM_APPLIED_PRICE 가격 상수 또는 다른 지표 핸들 중 하나입니다.
지정된 기술 지표의 핸들을 반환합니다. 실패하면 INVALID_HANDLE을 반환합니다. 사용하지 않는 지표에서 컴퓨터 메모리를 확보하려면 지표 핸들이 전달되는 IndicatorRelease() 를 사용하세요.
버퍼 인덱스: 0 - UPPER_HISTOGRAM, 1 - 상부 히스토그램의 색상 버퍼, 2 - LOWER_HISTOGRAM, 3 - 하부 히스토그램의 색상 버퍼입니다.
EA에서 입력 및 전역 변수를 선언하여 지표를 만듭니다:
//+------------------------------------------------------------------+
//|                                            TestWilliamsGator.mq5 |
//|                                  Copyright 2023, MetaQuotes Ltd. |
//|                                             https://www.mql5.com |
//+------------------------------------------------------------------+
#property copyright "Copyright 2023, MetaQuotes Ltd."
#property link      "https://www.mql5.com"
#property version   "1.00"
//--- enums
enum ENUM_LINE_STATE
  {
   LINE_STATE_NONE,        // Undefined state
   LINE_STATE_UP,          // Upward
   LINE_STATE_DOWN,        // Downward
   LINE_STATE_TURN_UP,     // Upward reversal
   LINE_STATE_TURN_DOWN,   // Downward reversal
   LINE_STATE_STOP_UP,     // Upward stop
   LINE_STATE_STOP_DOWN,   // Downward stop
   LINE_STATE_ABOVE,       // Above value
   LINE_STATE_UNDER,       // Below value
   LINE_STATE_CROSS_UP,    // Crossing value upwards
   LINE_STATE_CROSS_DOWN,  // Crossing value downwards
   LINE_STATE_TOUCH_BELOW, // Touching value from below
   LINE_STATE_TOUCH_ABOVE, // Touch value from above
   LINE_STATE_EQUALS,      // Equal to value
  };
//--- input parameters
input uint                 InpPeriodJaws  =  13;            /* Jaws Period    */
input int                  InpShiftJaws   =  8;             /* Jaws Shift     */
input uint                 InpPeriodTeeth =  8;             /* Teeth Period   */
input int                  InpShiftTeeth  =  5;             /* Teeth Shift    */
input uint                 InpPeriodLips  =  5;             /* Lips Period    */
input int                  InpShiftLips   =  3;             /* Lips Shift     */
input ENUM_MA_METHOD       InpMethod      =  MODE_SMMA;     /* Smoothed       */
input ENUM_APPLIED_PRICE   InpAppliedPrice=  PRICE_MEDIAN;  /* Applied Price  */
//--- global variables
int      handle=INVALID_HANDLE;  // Indicator handle
int      period_jaws=0;          // Jaws line calculation period
int      period_teeth=0;         // Teeth line calculation period
int      period_lips=0;          // Lips line calculation period
int      ind_digits=0;           // Number of decimal places in the indicator values
string   ind_title;              // Indicator description
EA에서 대시보드를 사용할 때는 전역 변수를 선언하고 패널 클래스 파일을 포함하세요:
//+------------------------------------------------------------------+
//|                                            TestWilliamsGator.mq5 |
//|                                  Copyright 2023, MetaQuotes Ltd. |
//|                                             https://www.mql5.com |
//+------------------------------------------------------------------+
#property copyright "Copyright 2023, MetaQuotes Ltd."
#property link      "https://www.mql5.com"
#property version   "1.00"
//--- includes
#include <Dashboard\Dashboard.mqh>
//--- enums
enum ENUM_LINE_STATE
  {
   LINE_STATE_NONE,        // Undefined state
   LINE_STATE_UP,          // Upward
   LINE_STATE_DOWN,        // Downward
   LINE_STATE_TURN_UP,     // Upward reversal
   LINE_STATE_TURN_DOWN,   // Downward reversal
   LINE_STATE_STOP_UP,     // Upward stop
   LINE_STATE_STOP_DOWN,   // Downward stop
   LINE_STATE_ABOVE,       // Above value
   LINE_STATE_UNDER,       // Below value
   LINE_STATE_CROSS_UP,    // Crossing value upwards
   LINE_STATE_CROSS_DOWN,  // Crossing value downwards
   LINE_STATE_TOUCH_BELOW, // Touching value from below
   LINE_STATE_TOUCH_ABOVE, // Touch value from above
   LINE_STATE_EQUALS,      // Equal to value
  };
//--- input parameters
input uint                 InpPeriodJaws  =  13;            /* Jaws Period    */
input int                  InpShiftJaws   =  8;             /* Jaws Shift     */
input uint                 InpPeriodTeeth =  8;             /* Teeth Period   */
input int                  InpShiftTeeth  =  5;             /* Teeth Shift    */
input uint                 InpPeriodLips  =  5;             /* Lips Period    */
input int                  InpShiftLips   =  3;             /* Lips Shift     */
input ENUM_MA_METHOD       InpMethod      =  MODE_SMMA;     /* Smoothed       */
input ENUM_APPLIED_PRICE   InpAppliedPrice=  PRICE_MEDIAN;  /* Applied Price  */
//--- global variables
int      handle=INVALID_HANDLE;  // Indicator handle
int      period_jaws=0;          // Jaws line calculation period
int      period_teeth=0;         // Teeth line calculation period
int      period_lips=0;          // Lips line calculation period
int      ind_digits=0;           // Number of decimal places in the indicator values
string   ind_title;              // Indicator description
//--- variables for the panel
int      mouse_bar_index;        // Index of the bar the data is taken from
CDashboard *panel=NULL;          // Pointer to the panel object
초기화
지표의 전역 변수 값을 설정하고 핸들을 생성합니다:
//+------------------------------------------------------------------+
//| Expert initialization function                                   |
//+------------------------------------------------------------------+
int OnInit()
  {
//--- create timer
   EventSetTimer(60);

//--- Indicator
//--- Set and adjust the calculation period if necessary
   period_jaws=int(InpPeriodJaws<1 ? 13 : InpPeriodJaws);
   period_teeth=int(InpPeriodTeeth<1 ? 8 : InpPeriodTeeth);
   period_lips=int(InpPeriodLips<1 ? 5 : InpPeriodLips);
//--- Set the indicator name and the number of decimal places
   ind_title=StringFormat("Gator(%lu,%lu,%lu)",period_jaws,period_teeth,period_lips);
   ind_digits=Digits()+1;
//--- Create indicator handle
   ResetLastError();
   handle=iGator(Symbol(),PERIOD_CURRENT,period_jaws,InpShiftJaws,period_teeth,InpShiftTeeth,period_lips,InpShiftLips,InpMethod,InpAppliedPrice);
   if(handle==INVALID_HANDLE)
     {
      PrintFormat("%s: Failed to create indicator handle %s. Error %ld",__FUNCTION__,ind_title,GetLastError());
      return INIT_FAILED;
     }

//--- Successful initialization
   return(INIT_SUCCEEDED);
  }
EA에 대시보드를 사용하는 기능이 있는 경우 여기에서 생성하세요:
//+------------------------------------------------------------------+
//| Expert initialization function                                   |
//+------------------------------------------------------------------+
int OnInit()
  {
//--- create timer
   EventSetTimer(60);

//--- Indicator
//--- Set and adjust the calculation period if necessary
   period_jaws=int(InpPeriodJaws<1 ? 13 : InpPeriodJaws);
   period_teeth=int(InpPeriodTeeth<1 ? 8 : InpPeriodTeeth);
   period_lips=int(InpPeriodLips<1 ? 5 : InpPeriodLips);
//--- Set the indicator name and the number of decimal places
   ind_title=StringFormat("Gator(%lu,%lu,%lu)",period_jaws,period_teeth,period_lips);
   ind_digits=Digits()+1;
//--- Create indicator handle
   ResetLastError();
   handle=iGator(Symbol(),PERIOD_CURRENT,period_jaws,InpShiftJaws,period_teeth,InpShiftTeeth,period_lips,InpShiftLips,InpMethod,InpAppliedPrice);
   if(handle==INVALID_HANDLE)
     {
      PrintFormat("%s: Failed to create indicator handle %s. Error %ld",__FUNCTION__,ind_title,GetLastError());
      return INIT_FAILED;
     }

//--- Dashboard
//--- Create the panel
   panel=new CDashboard(1,20,20,229,225);
   if(panel==NULL)
     {
      Print("Error. Failed to create panel object");
      return INIT_FAILED;
     }
//--- Set font parameters
   panel.SetFontParams("Calibri",9);
//--- Display the panel with the "Symbol, Timeframe description" header text
   panel.View(Symbol()+", "+StringSubstr(EnumToString(Period()),7));
//--- Create a table with ID 0 to display bar data in it
   panel.CreateNewTable(0);
//--- Draw a table with ID 0 on the panel background
   panel.DrawGrid(0,2,20,6,2,18,112);

//--- Create a table with ID 1 to display indicator data in it
   panel.CreateNewTable(1);
//--- Get the Y2 table coordinate with ID 0 and
//--- set the Y1 coordinate for the table with ID 1
   int y1=panel.TableY2(0)+22;
//--- Draw a table with ID 1 on the panel background
   panel.DrawGrid(1,2,y1,3,2,18,112);

//--- Display tabular data in the journal
   panel.GridPrint(0,2);
   panel.GridPrint(1,2);
//--- Initialize the variable with the index of the mouse cursor bar
   mouse_bar_index=0;
//--- Display the data of the current bar on the panel
   DrawData(mouse_bar_index,TimeCurrent());

//--- Successful initialization
   return(INIT_SUCCEEDED);
  }
초기화 해제
EA OnDeinit() 핸들에서 지표 핸들을 릴리즈합니다:
//+------------------------------------------------------------------+
//| Expert deinitialization function                                 |
//+------------------------------------------------------------------+
void OnDeinit(const int reason)
  {
//--- destroy timer
   EventKillTimer();

//--- Release handle of the indicator
   ResetLastError();
   if(!IndicatorRelease(handle))
      PrintFormat("%s: IndicatorRelease failed. Error %ld",__FUNCTION__,GetLastError());
//--- Clear all comments on the chart
   Comment("");
  }
대시보드를 사용할 때 생성된 대시보드 객체가 제거됩니다:
//+------------------------------------------------------------------+
//| Expert deinitialization function                                 |
//+------------------------------------------------------------------+
void OnDeinit(const int reason)
  {
//--- destroy timer
   EventKillTimer();

//--- Release handle of the indicator
   ResetLastError();
   if(!IndicatorRelease(handle))
      PrintFormat("%s: IndicatorRelease failed. Error %ld",__FUNCTION__,GetLastError());
//--- Clear all comments on the chart
   Comment("");

//--- If the panel object exists, delete it
   if(panel!=NULL)
      delete panel;
  }
데이터 검색
지표 핸들로 데이터를 가져오는 일반적인 함수는 다음과 같습니다. 함수들은 오실레이터를 EA에 연결하는 방법에 대한 문서에서 검토했습니다. 제시된 함수는 사용자 지정 프로그램에서 '있는 그대로' 사용할 수 있습니다:
//+------------------------------------------------------------------+
//| Return the indicator data on the specified bar                   |
//+------------------------------------------------------------------+
double IndicatorValue(const int ind_handle,const int index,const int buffer_num)
  {
   double array[1]={0};
   ResetLastError();
   if(CopyBuffer(ind_handle,buffer_num,index,1,array)!=1)
     {
      PrintFormat("%s: CopyBuffer failed. Error %ld",__FUNCTION__,GetLastError());
      return EMPTY_VALUE;
     }
   return array[0];
  }
//+------------------------------------------------------------------+
//| Return the state of the indicator line                           |
//+------------------------------------------------------------------+
ENUM_LINE_STATE LineState(const int ind_handle,const int index,const int buffer_num)
  {
//--- Get the values of the indicator line with the shift (0,1,2) relative to the passed index
   const double value0=IndicatorValue(ind_handle,index,  buffer_num);
   const double value1=IndicatorValue(ind_handle,index+1,buffer_num);
   const double value2=IndicatorValue(ind_handle,index+2,buffer_num);
//--- If at least one of the values could not be obtained, return an undefined value
   if(value0==EMPTY_VALUE || value1==EMPTY_VALUE || value2==EMPTY_VALUE)
      return LINE_STATE_NONE;
//--- Line upward reversal (value2>value1 && value0>value1)
   if(NormalizeDouble(value2-value1,ind_digits)>0 && NormalizeDouble(value0-value1,ind_digits)>0)
      return LINE_STATE_TURN_UP;
//--- Line upward direction (value2<=value1 && value0>value1)
   else if(NormalizeDouble(value2-value1,ind_digits)<=0 && NormalizeDouble(value0-value1,ind_digits)>0)
      return LINE_STATE_UP;
//--- Line upward stop (value2<=value1 && value0==value1)
   else if(NormalizeDouble(value2-value1,ind_digits)<=0 && NormalizeDouble(value0-value1,ind_digits)==0)
      return LINE_STATE_STOP_UP;
//--- Line downward reversal (value2<value1 && value0<value1)
   if(NormalizeDouble(value2-value1,ind_digits)<0 && NormalizeDouble(value0-value1,ind_digits)<0)
      return LINE_STATE_TURN_DOWN;
//--- Line downward direction (value2>=value1 && value0<value1)
   else if(NormalizeDouble(value2-value1,ind_digits)>=0 && NormalizeDouble(value0-value1,ind_digits)<0)
      return LINE_STATE_DOWN;
//--- Line downward stop (value2>=value1 && value0==value1)
   else if(NormalizeDouble(value2-value1,ind_digits)>=0 && NormalizeDouble(value0-value1,ind_digits)==0)
      return LINE_STATE_STOP_DOWN;
//--- Undefined state
   return LINE_STATE_NONE;
  }
//+------------------------------------------------------------------+
//| Return the state of the line relative to the specified level     |
//+------------------------------------------------------------------+
ENUM_LINE_STATE LineStateRelative(const int ind_handle,const int index,const int buffer_num,const double level0,const double level1=EMPTY_VALUE)
  {
//--- Get the values of the indicator line with the shift (0,1) relative to the passed index
   const double value0=IndicatorValue(ind_handle,index,  buffer_num);
   const double value1=IndicatorValue(ind_handle,index+1,buffer_num);
//--- If at least one of the values could not be obtained, return an undefined value
   if(value0==EMPTY_VALUE || value1==EMPTY_VALUE)
      return LINE_STATE_NONE;
//--- Define the second level to compare
   double level=(level1==EMPTY_VALUE ? level0 : level1);
//--- The line is below the level (value1<level && value0<level0)
   if(NormalizeDouble(value1-level,ind_digits)<0 && NormalizeDouble(value0-level0,ind_digits)<0)
      return LINE_STATE_UNDER;
//--- The line is above the level (value1>level && value0>level0)
   if(NormalizeDouble(value1-level,ind_digits)>0 && NormalizeDouble(value0-level0,ind_digits)>0)
      return LINE_STATE_ABOVE;
//--- The line crossed the level upwards (value1<=level && value0>level0)
   if(NormalizeDouble(value1-level,ind_digits)<=0 && NormalizeDouble(value0-level0,ind_digits)>0)
      return LINE_STATE_CROSS_UP;
//--- The line crossed the level downwards (value1>=level && value0<level0)
   if(NormalizeDouble(value1-level,ind_digits)>=0 && NormalizeDouble(value0-level0,ind_digits)<0)
      return LINE_STATE_CROSS_DOWN;
//--- The line touched the level from below (value1<level0 && value0==level0)
   if(NormalizeDouble(value1-level,ind_digits)<0 && NormalizeDouble(value0-level0,ind_digits)==0)
      return LINE_STATE_TOUCH_BELOW;
//--- The line touched the level from above (value1>level0 && value0==level0)
   if(NormalizeDouble(value1-level,ind_digits)>0 && NormalizeDouble(value0-level0,ind_digits)==0)
      return LINE_STATE_TOUCH_BELOW;
//--- Line is equal to the level value (value1==level0 && value0==level0)
   if(NormalizeDouble(value1-level,ind_digits)==0 && NormalizeDouble(value0-level0,ind_digits)==0)
      return LINE_STATE_EQUALS;
//--- Undefined state
   return LINE_STATE_NONE;
  }
//+------------------------------------------------------------------+
//| Return the indicator line state description                      |
//+------------------------------------------------------------------+
string LineStateDescription(const ENUM_LINE_STATE state)
  {
   switch(state)
     {
      case LINE_STATE_UP         :  return "Up";
      case LINE_STATE_STOP_UP    :  return "Stop Up";
      case LINE_STATE_TURN_UP    :  return "Turn Up";
      case LINE_STATE_DOWN       :  return "Down";
      case LINE_STATE_STOP_DOWN  :  return "Stop Down";
      case LINE_STATE_TURN_DOWN  :  return "Turn Down";
      case LINE_STATE_ABOVE      :  return "Above level";
      case LINE_STATE_UNDER      :  return "Under level";
      case LINE_STATE_CROSS_UP   :  return "Crossing Up";
      case LINE_STATE_CROSS_DOWN :  return "Crossing Down";
      case LINE_STATE_TOUCH_BELOW:  return "Touch from Below";
      case LINE_STATE_TOUCH_ABOVE:  return "Touch from Above";
      case LINE_STATE_EQUALS     :  return "Equals";
      default                    :  return "Unknown";
     }
  }
대시보드를 사용할 때 함수를 사용하여 패널에 데이터가 표시됩니다:
//+------------------------------------------------------------------+
//| Display data from the specified timeseries index to the panel    |
//+------------------------------------------------------------------+
void DrawData(const int index,const datetime time)
  {
//--- Declare the variables to receive data in them
   MqlTick  tick={0};
   MqlRates rates[1];

//--- Exit if unable to get the current prices
   if(!SymbolInfoTick(Symbol(),tick))
      return;
//--- Exit if unable to get the bar data by the specified index
   if(CopyRates(Symbol(),PERIOD_CURRENT,index,1,rates)!=1)
      return;

//--- Set font parameters for bar and indicator data headers
   int  size=0;
   uint flags=0;
   uint angle=0;
   string name=panel.FontParams(size,flags,angle);
   panel.SetFontParams(name,9,FW_BOLD);
   panel.DrawText("Bar data ["+(string)index+"]",3,panel.TableY1(0)-16,clrMaroon,panel.Width()-6);
   panel.DrawText("Indicator data ["+(string)index+"]",3,panel.TableY1(1)-16,clrGreen,panel.Width()-6);
//--- Set font parameters for bar and indicator data
   panel.SetFontParams(name,9);

//--- Display the data of the specified bar in table 0 on the panel
   panel.DrawText("Date",  panel.CellX(0,0,0)+2, panel.CellY(0,0,0)+2); panel.DrawText(TimeToString(  rates[0].time,TIME_DATE),     panel.CellX(0,0,1)+2, panel.CellY(0,0,1)+2,clrNONE,90);
   panel.DrawText("Time",  panel.CellX(0,1,0)+2, panel.CellY(0,1,0)+2); panel.DrawText(TimeToString(  rates[0].time,TIME_MINUTES),  panel.CellX(0,1,1)+2, panel.CellY(0,1,1)+2,clrNONE,90);
   panel.DrawText("Open",  panel.CellX(0,2,0)+2, panel.CellY(0,2,0)+2); panel.DrawText(DoubleToString(rates[0].open,Digits()),      panel.CellX(0,2,1)+2, panel.CellY(0,2,1)+2,clrNONE,90);
   panel.DrawText("High",  panel.CellX(0,3,0)+2, panel.CellY(0,3,0)+2); panel.DrawText(DoubleToString(rates[0].high,Digits()),      panel.CellX(0,3,1)+2, panel.CellY(0,3,1)+2,clrNONE,90);
   panel.DrawText("Low",   panel.CellX(0,4,0)+2, panel.CellY(0,4,0)+2); panel.DrawText(DoubleToString(rates[0].low,Digits()),       panel.CellX(0,4,1)+2, panel.CellY(0,4,1)+2,clrNONE,90);
   panel.DrawText("Close", panel.CellX(0,5,0)+2, panel.CellY(0,5,0)+2); panel.DrawText(DoubleToString(rates[0].close,Digits()),     panel.CellX(0,5,1)+2, panel.CellY(0,5,1)+2,clrNONE,90);

//--- Get the indicator buffers data
   double value0=IndicatorValue(handle,index,UPPER_HISTOGRAM); // Upper histogram
   double value1=IndicatorValue(handle,index,1);               // Upper histogram color buffer
   double value2=IndicatorValue(handle,index,LOWER_HISTOGRAM); // Lower histogram
   double value3=IndicatorValue(handle,index,3);               // Lower histogram color buffer
   color clr=clrNONE;
//--- Display the upper histogram data from the specified bar on the panel in table 1
   panel.DrawText(ind_title+" Up", panel.CellX(1,0,0)+2, panel.CellY(1,0,0)+2);
   string value_str=(value0!=EMPTY_VALUE ? DoubleToString(value0,ind_digits) : "");
   clr=(value1>0 ? clrRed : clrGreen);
   panel.DrawText(value_str,panel.CellX(1,0,1)+2,panel.CellY(1,0,1)+2,clr,100);

//--- Display the lower histogram data from the specified bar on the panel in table 1
   panel.DrawText(ind_title+" Down", panel.CellX(1,1,0)+2, panel.CellY(1,1,0)+2);
   value_str=(value2!=EMPTY_VALUE ? DoubleToString(value2,ind_digits) : "");
   clr=(value3>0 ? clrRed : clrGreen);
   panel.DrawText(value_str,panel.CellX(1,1,1)+2,panel.CellY(1,1,1)+2,clr,100);

//--- Redraw the chart to immediately display all changes on the panel
   ChartRedraw(ChartID());
  }
지표 버퍼의 값을 설명하는 텍스트의 색상은 지표 히스토그램의 해당 열과 동일한 색상을 갖습니다.
또한 대시보드를 사용할 때 패널 이벤트 핸들러는 OnChartEvent() EA 이벤트 핸들러에서 호출되며 커서 아래의 바 인덱스를 수신하는 이벤트도 처리됩니다:
//+------------------------------------------------------------------+
//| ChartEvent function                                              |
//+------------------------------------------------------------------+
void OnChartEvent(const int id,
                  const long &lparam,
                  const double &dparam,
                  const string &sparam)
  {
//--- Handling the panel
//--- Call the panel event handler
   panel.OnChartEvent(id,lparam,dparam,sparam);

//--- If the cursor moves or a click is made on the chart
   if(id==CHARTEVENT_MOUSE_MOVE || id==CHARTEVENT_CLICK)
     {
      //--- Declare the variables to record time and price coordinates in them
      datetime time=0;
      double price=0;
      int wnd=0;
      //--- If the cursor coordinates are converted to date and time
      if(ChartXYToTimePrice(ChartID(),(int)lparam,(int)dparam,wnd,time,price))
        {
         //--- write the bar index where the cursor is located to a global variable
         mouse_bar_index=iBarShift(Symbol(),PERIOD_CURRENT,time);
         //--- Display the bar data under the cursor on the panel
         DrawData(mouse_bar_index,time);
        }
     }

//--- If we received a custom event, display the appropriate message in the journal
   if(id>CHARTEVENT_CUSTOM)
     {
      //--- Here we can implement handling a click on the close button on the panel
      PrintFormat("%s: Event id=%ld, object id (lparam): %lu, event message (sparam): %s",__FUNCTION__,id,lparam,sparam);
     }
  }
EA를 컴파일하고 차트에서 실행하면 패널에서 지표 값과 선의 상태를 모니터링할 수 있습니다:
이 문서에 첨부된 파일에서 TestWilliamsGator.mq5 테스트 EA를 확인할 수 있습니다.
시장 촉진 지수(Market Facilitation Index)
시장 촉진 지수(BW MFI)는 한 틱의 가격 변화를 보여주는 지표입니다. 지표의 절대값은 의미가 없으며 지표의 변화만 의미가 있습니다. 빌 윌리엄스는 MFI와 볼륨의 상호 교환을 강조합니다:
- 시장 촉진 지수 증가 및 볼륨 증가 - 이는 a) 시장에 진입하는 플레이어 수가 증가(볼륨 증가) b) 새로 진입하는 플레이어가 바가 진행하는 방향으로 포지션을 오픈, 즉 움직임이 시작되고 속도가 빨라짐을 나타냅니다.
- 시장 촉진 지수가 하락하고 거래량이 감소합니다. 시장 참여자들이 더 이상 관심이 없다는 뜻입니다.
- 시장 촉진 지수는 증가하지만 볼륨은 감소합니다. 트레이더의 거래량으로 시장이 지지되지 않고 플로어 트레이더(브로커사 및 딜러)들로 인해 가격이 변동하는 경우가 대부분입니다.
- 시장 촉진 지수는 하락하지만 볼륨은 증가합니다. 매도 물량과 매수 물량이 많은 것이 특징으로 상승세와 하락세 간의 싸움이 있지만 세력이 같기 때문에 가격은 크게 변하지 않습니다. 경합을 벌이는 당사자(매수 대 매도) 중 한 쪽이 결국 승리하게 됩니다. 일반적으로, 이러한 바(Bar)의 돌파는 해당 바가 추세의 지속을 확인하는지 아니면 추세를 무효화하는지를 알려줍니다. 빌 윌리엄스는 이러한 바를 '커트싱'이라고 부릅니다.
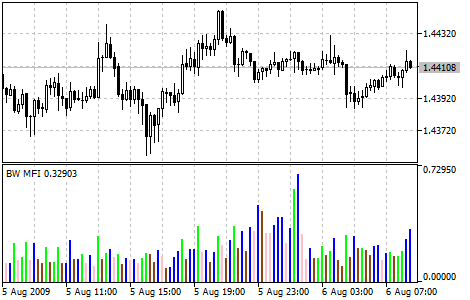
매개변수
지표 핸들을 생성하는 데는 iBWMFI() 함수가 사용됩니다:
시장 활성화 지수 지표의 핸들을 반환합니다. 버퍼는 하나만 있습니다.
int  iBWMFI(
   string               symbol,             // symbol name
   ENUM_TIMEFRAMES      period,             // period
   ENUM_APPLIED_VOLUME  applied_volume      // type of volume used for calculations
   );
symbol
[in] 금융 상품의 심볼 이름으로 지표 계산에 이 심볼의 데이터를 사용합니다. NULL은 현재 심볼을 의미합니다.
period
[in] 기간 값은 ENUM_TIMEFRAMES 열거형 값 중 하나이며 0은 현재 기간을 의미합니다.
applied_volume
[in] Used volume. ENUM_APPLIED_VOLUME 열거형 값 중 하나입니다.
지정된 기술 지표의 핸들을 반환합니다. 실패하면 INVALID_HANDLE을 반환합니다. 사용하지 않는 지표에서 컴퓨터 메모리를 확보하려면 지표 핸들이 전달되는 IndicatorRelease() 를 사용하세요.
EA에서 입력 및 전역 변수를 선언하여 지표를 만듭니다:
//+------------------------------------------------------------------+
//|                                            TestWilliamsBWMFI.mq5 |
//|                                  Copyright 2023, MetaQuotes Ltd. |
//|                                             https://www.mql5.com |
//+------------------------------------------------------------------+
#property copyright "Copyright 2023, MetaQuotes Ltd."
#property link      "https://www.mql5.com"
#property version   "1.00"
//--- enums
enum ENUM_LINE_STATE
  {
   LINE_STATE_NONE,        // Undefined state
   LINE_STATE_UP,          // Upward
   LINE_STATE_DOWN,        // Downward
   LINE_STATE_TURN_UP,     // Upward reversal
   LINE_STATE_TURN_DOWN,   // Downward reversal
   LINE_STATE_STOP_UP,     // Upward stop
   LINE_STATE_STOP_DOWN,   // Downward stop
   LINE_STATE_ABOVE,       // Above value
   LINE_STATE_UNDER,       // Below value
   LINE_STATE_CROSS_UP,    // Crossing value upwards
   LINE_STATE_CROSS_DOWN,  // Crossing value downwards
   LINE_STATE_TOUCH_BELOW, // Touching value from below
   LINE_STATE_TOUCH_ABOVE, // Touch value from above
   LINE_STATE_EQUALS,      // Equal to value
  };
//--- input parameters
input ENUM_APPLIED_VOLUME  InpVolume   =  VOLUME_TICK;   /* Applied Volume */
//--- global variables
int      handle=INVALID_HANDLE;  // Indicator handle
int      ind_digits=0;           // Number of decimal places in the indicator values
string   ind_title;              // Indicator description
EA에서 대시보드를 사용할 때는 전역 변수를 선언하고 패널 클래스 파일을 포함하세요:
//+------------------------------------------------------------------+
//|                                            TestWilliamsBWMFI.mq5 |
//|                                  Copyright 2023, MetaQuotes Ltd. |
//|                                             https://www.mql5.com |
//+------------------------------------------------------------------+
#property copyright "Copyright 2023, MetaQuotes Ltd."
#property link      "https://www.mql5.com"
#property version   "1.00"
//--- includes
#include <Dashboard\Dashboard.mqh>
//--- enums
enum ENUM_LINE_STATE
  {
   LINE_STATE_NONE,        // Undefined state
   LINE_STATE_UP,          // Upward
   LINE_STATE_DOWN,        // Downward
   LINE_STATE_TURN_UP,     // Upward reversal
   LINE_STATE_TURN_DOWN,   // Downward reversal
   LINE_STATE_STOP_UP,     // Upward stop
   LINE_STATE_STOP_DOWN,   // Downward stop
   LINE_STATE_ABOVE,       // Above value
   LINE_STATE_UNDER,       // Below value
   LINE_STATE_CROSS_UP,    // Crossing value upwards
   LINE_STATE_CROSS_DOWN,  // Crossing value downwards
   LINE_STATE_TOUCH_BELOW, // Touching value from below
   LINE_STATE_TOUCH_ABOVE, // Touch value from above
   LINE_STATE_EQUALS,      // Equal to value
  };
//--- input parameters
input ENUM_APPLIED_VOLUME  InpVolume   =  VOLUME_TICK;   /* Applied Volume */
//--- global variables
int      handle=INVALID_HANDLE;  // Indicator handle
int      ind_digits=0;           // Number of decimal places in the indicator values
string   ind_title;              // Indicator description
//--- variables for the panel
int      mouse_bar_index;        // Index of the bar the data is taken from
CDashboard *panel=NULL;          // Pointer to the panel object
초기화
지표의 전역 변수 값을 설정하고 핸들을 생성합니다:
//+------------------------------------------------------------------+
//| Expert initialization function                                   |
//+------------------------------------------------------------------+
int OnInit()
  {
//--- create timer
   EventSetTimer(60);

//--- Indicator
//--- Set the indicator name and the number of decimal places
   ind_title="BW MFI";
   ind_digits=Digits();
//--- Create indicator handle
   ResetLastError();
   handle=iBWMFI(Symbol(),PERIOD_CURRENT,InpVolume);
   if(handle==INVALID_HANDLE)
     {
      PrintFormat("%s: Failed to create indicator handle %s. Error %ld",__FUNCTION__,ind_title,GetLastError());
      return INIT_FAILED;
     }

//--- Successful initialization
   return(INIT_SUCCEEDED);
  }
EA에 대시보드를 사용하는 기능이 있는 경우 여기에서 생성하세요:
//+------------------------------------------------------------------+
//| Expert initialization function                                   |
//+------------------------------------------------------------------+
int OnInit()
  {
//--- create timer
   EventSetTimer(60);

//--- Indicator
//--- Set the indicator name and the number of decimal places
   ind_title="BW MFI";
   ind_digits=Digits();
//--- Create indicator handle
   ResetLastError();
   handle=iBWMFI(Symbol(),PERIOD_CURRENT,InpVolume);
   if(handle==INVALID_HANDLE)
     {
      PrintFormat("%s: Failed to create indicator handle %s. Error %ld",__FUNCTION__,ind_title,GetLastError());
      return INIT_FAILED;
     }

//--- Dashboard
//--- Create the panel
   panel=new CDashboard(1,20,20,199,225);
   if(panel==NULL)
     {
      Print("Error. Failed to create panel object");
      return INIT_FAILED;
     }
//--- Set font parameters
   panel.SetFontParams("Calibri",9);
//--- Display the panel with the "Symbol, Timeframe description" header text
   panel.View(Symbol()+", "+StringSubstr(EnumToString(Period()),7));
//--- Create a table with ID 0 to display bar data in it
   panel.CreateNewTable(0);
//--- Draw a table with ID 0 on the panel background
   panel.DrawGrid(0,2,20,6,2,18,97);

//--- Create a table with ID 1 to display indicator data in it
   panel.CreateNewTable(1);
//--- Get the Y2 table coordinate with ID 0 and
//--- set the Y1 coordinate for the table with ID 1
   int y1=panel.TableY2(0)+22;
//--- Draw a table with ID 1 on the panel background
   panel.DrawGrid(1,2,y1,3,2,18,97);

//--- Display tabular data in the journal
   panel.GridPrint(0,2);
   panel.GridPrint(1,2);
//--- Initialize the variable with the index of the mouse cursor bar
   mouse_bar_index=0;
//--- Display the data of the current bar on the panel
   DrawData(mouse_bar_index,TimeCurrent());

//--- Successful initialization
   return(INIT_SUCCEEDED);
  }
초기화 해제
EA OnDeinit() 핸들에서 지표 핸들을 릴리즈합니다:
//+------------------------------------------------------------------+
//| Expert deinitialization function                                 |
//+------------------------------------------------------------------+
void OnDeinit(const int reason)
  {
//--- destroy timer
   EventKillTimer();

//--- Release handle of the indicator
   ResetLastError();
   if(!IndicatorRelease(handle))
      PrintFormat("%s: IndicatorRelease failed. Error %ld",__FUNCTION__,GetLastError());
//--- Clear all comments on the chart
   Comment("");
  }
대시보드를 사용할 때 생성된 대시보드 객체가 제거됩니다:
//+------------------------------------------------------------------+
//| Expert deinitialization function                                 |
//+------------------------------------------------------------------+
void OnDeinit(const int reason)
  {
//--- destroy timer
   EventKillTimer();

//--- Release handle of the indicator
   ResetLastError();
   if(!IndicatorRelease(handle))
      PrintFormat("%s: IndicatorRelease failed. Error %ld",__FUNCTION__,GetLastError());
//--- Clear all comments on the chart
   Comment("");

//--- If the panel object exists, delete it
   if(panel!=NULL)
      delete panel;
  }
데이터 검색
지표 핸들로 데이터를 가져오는 일반적인 함수는 다음과 같습니다. 함수들은 오실레이터를 EA에 연결하는 방법에 대한 문서에서 검토했습니다. 제시된 함수는 사용자 지정 프로그램에서 '있는 그대로' 사용할 수 있습니다:
//+------------------------------------------------------------------+
//| Return the indicator data on the specified bar                   |
//+------------------------------------------------------------------+
double IndicatorValue(const int ind_handle,const int index,const int buffer_num)
  {
   double array[1]={0};
   ResetLastError();
   if(CopyBuffer(ind_handle,buffer_num,index,1,array)!=1)
     {
      PrintFormat("%s: CopyBuffer failed. Error %ld",__FUNCTION__,GetLastError());
      return EMPTY_VALUE;
     }
   return array[0];
  }
//+------------------------------------------------------------------+
//| Return the state of the indicator line                           |
//+------------------------------------------------------------------+
ENUM_LINE_STATE LineState(const int ind_handle,const int index,const int buffer_num)
  {
//--- Get the values of the indicator line with the shift (0,1,2) relative to the passed index
   const double value0=IndicatorValue(ind_handle,index,  buffer_num);
   const double value1=IndicatorValue(ind_handle,index+1,buffer_num);
   const double value2=IndicatorValue(ind_handle,index+2,buffer_num);
//--- If at least one of the values could not be obtained, return an undefined value
   if(value0==EMPTY_VALUE || value1==EMPTY_VALUE || value2==EMPTY_VALUE)
      return LINE_STATE_NONE;
//--- Line upward reversal (value2>value1 && value0>value1)
   if(NormalizeDouble(value2-value1,ind_digits)>0 && NormalizeDouble(value0-value1,ind_digits)>0)
      return LINE_STATE_TURN_UP;
//--- Line upward direction (value2<=value1 && value0>value1)
   else if(NormalizeDouble(value2-value1,ind_digits)<=0 && NormalizeDouble(value0-value1,ind_digits)>0)
      return LINE_STATE_UP;
//--- Line upward stop (value2<=value1 && value0==value1)
   else if(NormalizeDouble(value2-value1,ind_digits)<=0 && NormalizeDouble(value0-value1,ind_digits)==0)
      return LINE_STATE_STOP_UP;
//--- Line downward reversal (value2<value1 && value0<value1)
   if(NormalizeDouble(value2-value1,ind_digits)<0 && NormalizeDouble(value0-value1,ind_digits)<0)
      return LINE_STATE_TURN_DOWN;
//--- Line downward direction (value2>=value1 && value0<value1)
   else if(NormalizeDouble(value2-value1,ind_digits)>=0 && NormalizeDouble(value0-value1,ind_digits)<0)
      return LINE_STATE_DOWN;
//--- Line downward stop (value2>=value1 && value0==value1)
   else if(NormalizeDouble(value2-value1,ind_digits)>=0 && NormalizeDouble(value0-value1,ind_digits)==0)
      return LINE_STATE_STOP_DOWN;
//--- Undefined state
   return LINE_STATE_NONE;
  }
//+------------------------------------------------------------------+
//| Return the state of the line relative to the specified level     |
//+------------------------------------------------------------------+
ENUM_LINE_STATE LineStateRelative(const int ind_handle,const int index,const int buffer_num,const double level0,const double level1=EMPTY_VALUE)
  {
//--- Get the values of the indicator line with the shift (0,1) relative to the passed index
   const double value0=IndicatorValue(ind_handle,index,  buffer_num);
   const double value1=IndicatorValue(ind_handle,index+1,buffer_num);
//--- If at least one of the values could not be obtained, return an undefined value
   if(value0==EMPTY_VALUE || value1==EMPTY_VALUE)
      return LINE_STATE_NONE;
//--- Define the second level to compare
   double level=(level1==EMPTY_VALUE ? level0 : level1);
//--- The line is below the level (value1<level && value0<level0)
   if(NormalizeDouble(value1-level,ind_digits)<0 && NormalizeDouble(value0-level0,ind_digits)<0)
      return LINE_STATE_UNDER;
//--- The line is above the level (value1>level && value0>level0)
   if(NormalizeDouble(value1-level,ind_digits)>0 && NormalizeDouble(value0-level0,ind_digits)>0)
      return LINE_STATE_ABOVE;
//--- The line crossed the level upwards (value1<=level && value0>level0)
   if(NormalizeDouble(value1-level,ind_digits)<=0 && NormalizeDouble(value0-level0,ind_digits)>0)
      return LINE_STATE_CROSS_UP;
//--- The line crossed the level downwards (value1>=level && value0<level0)
   if(NormalizeDouble(value1-level,ind_digits)>=0 && NormalizeDouble(value0-level0,ind_digits)<0)
      return LINE_STATE_CROSS_DOWN;
//--- The line touched the level from below (value1<level0 && value0==level0)
   if(NormalizeDouble(value1-level,ind_digits)<0 && NormalizeDouble(value0-level0,ind_digits)==0)
      return LINE_STATE_TOUCH_BELOW;
//--- The line touched the level from above (value1>level0 && value0==level0)
   if(NormalizeDouble(value1-level,ind_digits)>0 && NormalizeDouble(value0-level0,ind_digits)==0)
      return LINE_STATE_TOUCH_BELOW;
//--- Line is equal to the level value (value1==level0 && value0==level0)
   if(NormalizeDouble(value1-level,ind_digits)==0 && NormalizeDouble(value0-level0,ind_digits)==0)
      return LINE_STATE_EQUALS;
//--- Undefined state
   return LINE_STATE_NONE;
  }
//+------------------------------------------------------------------+
//| Return the indicator line state description                      |
//+------------------------------------------------------------------+
string LineStateDescription(const ENUM_LINE_STATE state)
  {
   switch(state)
     {
      case LINE_STATE_UP         :  return "Up";
      case LINE_STATE_STOP_UP    :  return "Stop Up";
      case LINE_STATE_TURN_UP    :  return "Turn Up";
      case LINE_STATE_DOWN       :  return "Down";
      case LINE_STATE_STOP_DOWN  :  return "Stop Down";
      case LINE_STATE_TURN_DOWN  :  return "Turn Down";
      case LINE_STATE_ABOVE      :  return "Above level";
      case LINE_STATE_UNDER      :  return "Under level";
      case LINE_STATE_CROSS_UP   :  return "Crossing Up";
      case LINE_STATE_CROSS_DOWN :  return "Crossing Down";
      case LINE_STATE_TOUCH_BELOW:  return "Touch from Below";
      case LINE_STATE_TOUCH_ABOVE:  return "Touch from Above";
      case LINE_STATE_EQUALS     :  return "Equals";
      default                    :  return "Unknown";
     }
  }
대시보드를 사용할 때 함수를 사용하여 패널에 데이터가 표시됩니다:
//+------------------------------------------------------------------+
//| Display data from the specified timeseries index to the panel    |
//+------------------------------------------------------------------+
void DrawData(const int index,const datetime time)
  {
//--- Declare the variables to receive data in them
   MqlTick  tick={0};
   MqlRates rates[1];

//--- Exit if unable to get the current prices
   if(!SymbolInfoTick(Symbol(),tick))
      return;
//--- Exit if unable to get the bar data by the specified index
   if(CopyRates(Symbol(),PERIOD_CURRENT,index,1,rates)!=1)
      return;

//--- Set font parameters for bar and indicator data headers
   int  size=0;
   uint flags=0;
   uint angle=0;
   string name=panel.FontParams(size,flags,angle);
   panel.SetFontParams(name,9,FW_BOLD);
   panel.DrawText("Bar data ["+(string)index+"]",3,panel.TableY1(0)-16,clrMaroon,panel.Width()-6);
   panel.DrawText("Indicator data ["+(string)index+"]",3,panel.TableY1(1)-16,clrGreen,panel.Width()-6);
//--- Set font parameters for bar and indicator data
   panel.SetFontParams(name,9);

//--- Display the data of the specified bar in table 0 on the panel
   panel.DrawText("Date",  panel.CellX(0,0,0)+2, panel.CellY(0,0,0)+2); panel.DrawText(TimeToString(  rates[0].time,TIME_DATE),     panel.CellX(0,0,1)+2, panel.CellY(0,0,1)+2,clrNONE,90);
   panel.DrawText("Time",  panel.CellX(0,1,0)+2, panel.CellY(0,1,0)+2); panel.DrawText(TimeToString(  rates[0].time,TIME_MINUTES),  panel.CellX(0,1,1)+2, panel.CellY(0,1,1)+2,clrNONE,90);
   panel.DrawText("Open",  panel.CellX(0,2,0)+2, panel.CellY(0,2,0)+2); panel.DrawText(DoubleToString(rates[0].open,Digits()),      panel.CellX(0,2,1)+2, panel.CellY(0,2,1)+2,clrNONE,90);
   panel.DrawText("High",  panel.CellX(0,3,0)+2, panel.CellY(0,3,0)+2); panel.DrawText(DoubleToString(rates[0].high,Digits()),      panel.CellX(0,3,1)+2, panel.CellY(0,3,1)+2,clrNONE,90);
   panel.DrawText("Low",   panel.CellX(0,4,0)+2, panel.CellY(0,4,0)+2); panel.DrawText(DoubleToString(rates[0].low,Digits()),       panel.CellX(0,4,1)+2, panel.CellY(0,4,1)+2,clrNONE,90);
   panel.DrawText("Close", panel.CellX(0,5,0)+2, panel.CellY(0,5,0)+2); panel.DrawText(DoubleToString(rates[0].close,Digits()),     panel.CellX(0,5,1)+2, panel.CellY(0,5,1)+2,clrNONE,90);

//--- Display the indicator data from the specified bar on the panel in table 1
   panel.DrawText(ind_title, panel.CellX(1,0,0)+2, panel.CellY(1,0,0)+2);
   double value=IndicatorValue(handle,index,0);
   string value_str=(value!=EMPTY_VALUE ? DoubleToString(value,ind_digits) : "");
   panel.DrawText(value_str,panel.CellX(1,0,1)+2,panel.CellY(1,0,1)+2,clrNONE,90);

//--- Create Volumes indicator handle
   static bool create=false;
   static int hv=INVALID_HANDLE;
   if(!create)
     {
      ResetLastError();
      hv=iVolumes(Symbol(),PERIOD_CURRENT,InpVolume);
      if(hv==INVALID_HANDLE)
        {
         PrintFormat("%s: Failed to create indicator handle Volumes. Error %ld",__FUNCTION__,GetLastError());
         return;
        }
      create=true;
     }

//--- Get Volumes indicator status
   ENUM_LINE_STATE state_vol=LineState(hv,index,0);
//--- Display a description of the indicator line state
   panel.DrawText("BW MFI State", panel.CellX(1,1,0)+2, panel.CellY(1,1,0)+2);
   ENUM_LINE_STATE state=LineState(handle,index,0);
   color clr=clrNONE;
   string state_str=LineStateDescription(state);
   if((state==LINE_STATE_UP || state==LINE_STATE_TURN_UP) && (state_vol==LINE_STATE_UP || state_vol==LINE_STATE_TURN_UP))
     {
      state_str="MFI Up, Vol Up";
      clr=clrGreen;
     }
   if((state==LINE_STATE_DOWN || state==LINE_STATE_TURN_DOWN) && (state_vol==LINE_STATE_DOWN || state_vol==LINE_STATE_TURN_DOWN))
     {
      state_str="MFI Dn, Vol Dn";
      clr=clrSaddleBrown;
     }
   if((state==LINE_STATE_UP || state==LINE_STATE_TURN_UP) && (state_vol==LINE_STATE_DOWN || state_vol==LINE_STATE_TURN_DOWN))
     {
      state_str="MFI Up, Vol Dn";
      clr=clrBlue;
     }
   if((state==LINE_STATE_DOWN || state==LINE_STATE_TURN_DOWN) && (state_vol==LINE_STATE_UP || state_vol==LINE_STATE_TURN_UP))
     {
      state_str="MFI Dn, Vol Up";
      clr=clrLightCoral;
     }

//--- Set font parameters for indicator state data (bold font)
   name=panel.FontParams(size,flags,angle);
   panel.SetFontParams(name,9,FW_BOLD);
   panel.DrawText(state_str,panel.CellX(1,1,1)+2,panel.CellY(1,1,1)+2,clr,90);
//--- Restore the normal thickness of the panel font
   panel.SetFontParams(name,9);

//--- Redraw the chart to immediately display all changes on the panel
   ChartRedraw(ChartID());
  }
여기에 제공되는 범용 기능을 통해 일반적인 방법으로 BW MFI 지표 데이터를 얻을 수 있습니다. 그러나 지표 열의 수치를 해석하려면 히스토그램 열의 색상을 지정하기 위해 히스토그램 열의 값과 이전 값에 대한 볼륨 값이라는 두 가지 지표를 비교하므로 우리는 볼륨 지표라는 또 다른 지표가 필요합니다. 함수에서 볼륨을 가져오려면 볼륨 지표 핸들을 생성하고(처음 액세스할 때 한 번) BW MFI와 볼륨 라인의 상태를 비교합니다. 상호 관계에 대한 설명이 패널에 텍스트로 표시됩니다.
또한 대시보드를 사용할 때 패널 이벤트 핸들러는 OnChartEvent() EA 이벤트 핸들러에서 호출되며 커서 아래의 바 인덱스를 수신하는 이벤트도 처리됩니다:
//+------------------------------------------------------------------+
//| ChartEvent function                                              |
//+------------------------------------------------------------------+
void OnChartEvent(const int id,
                  const long &lparam,
                  const double &dparam,
                  const string &sparam)
  {
//--- Handling the panel
//--- Call the panel event handler
   panel.OnChartEvent(id,lparam,dparam,sparam);

//--- If the cursor moves or a click is made on the chart
   if(id==CHARTEVENT_MOUSE_MOVE || id==CHARTEVENT_CLICK)
     {
      //--- Declare the variables to record time and price coordinates in them
      datetime time=0;
      double price=0;
      int wnd=0;
      //--- If the cursor coordinates are converted to date and time
      if(ChartXYToTimePrice(ChartID(),(int)lparam,(int)dparam,wnd,time,price))
        {
         //--- write the bar index where the cursor is located to a global variable
         mouse_bar_index=iBarShift(Symbol(),PERIOD_CURRENT,time);
         //--- Display the bar data under the cursor on the panel
         DrawData(mouse_bar_index,time);
        }
     }

//--- If we received a custom event, display the appropriate message in the journal
   if(id>CHARTEVENT_CUSTOM)
     {
      //--- Here we can implement handling a click on the close button on the panel
      PrintFormat("%s: Event id=%ld, object id (lparam): %lu, event message (sparam): %s",__FUNCTION__,id,lparam,sparam);
     }
  }
EA를 컴파일하고 차트에서 실행하면 패널에서 지표 값과 선의 상태를 모니터링할 수 있습니다:
이 문서에 첨부된 파일에서 TestWilliamsBWMFI.mq5 테스트 EA를 확인할 수 있습니다.
대시보드 클래스 개선. 찾아보기
이 시리즈의 테스트 EA에서는 첫 번째 글에서 만든 대시보드를 사용합니다. 패널에 하나의 테이블을 만들 수 있었습니다. 테이블 좌표는 대시보드에 데이터를 표시하는 데 사용할 수 있습니다. 이제 대시보드 클래스가 완성되었으므로 데이터를 배치할 테이블을 얼마든지 만들 수 있습니다. 또한 대시보드를 축소하고 기간을 전환한 후 대시보드를 다시 펼치면 대시보드 데이터가 일시적으로 사라지는 문제도 수정했습니다. 변경 사항을 간략하게 살펴보겠습니다.
이제 패널에 생성된 각 테이블은 해당 좌표를 반환할 수 있습니다: X1, Y1 - 왼쪽 상단 모서리, X2 및 Y2 - 오른쪽 하단 모서리. 각 플레이트에는 고유한 ID와 이름이 할당되며 이를 통해 각각에 액세스하여 데이터를 얻을 수 있습니다.
이제 CTableData 표 형식 데이터 클래스에는 이러한 값을 쓰고 반환하는 비공개 변수와 공개 메서드가 있습니다:
//+------------------------------------------------------------------+
//| Table data class                                                 |
//+------------------------------------------------------------------+
class CTableData : public CObject
  {
private:
   CArrayObj         m_list_rows;               // List of rows
   uint              m_id;                      // Table ID
   int               m_x1;                      // X1 coordinate
   int               m_y1;                      // Y1 coordinate
   int               m_x2;                      // X2 coordinate
   int               m_y2;                      // Y2 coordinate
   int               m_w;                       // Width
   int               m_h;                       // Height
   string            m_name;                    // Table name
public:
//--- Set table name
   void              SetName(const string name) { this.m_name=name;              }
//--- Return table (1) ID and (2) name
   uint              ID(void)             const { return this.m_id;              }
   string            Name(void)           const { return this.m_name;            }

//--- Set coordinate (1) X1, (2) X2
   void              SetX1(const uint x1)       { this.m_x1=(int)x1;             }
   void              SetX2(const uint x2)       { this.m_x2=(int)x2;             }
//--- Set coordinate (1) Y1, (2) Y2
   void              SetY1(const uint y1)       { this.m_y1=(int)y1;             }
   void              SetY2(const uint y2)       { this.m_y2=(int)y2;             }
//--- Set table coordinates
   void              SetCoords(const int x1,const int y1,const int x2,const int y2)
                       {
                        this.SetX1(x1);
                        this.SetY1(y1);
                        this.SetX2(x2);
                        this.SetY2(y2);
                       }

//--- Return coordinate (1) X1, (2) X2
   int               X1(void)             const { return this.m_x1;              }
   int               X2(void)             const { return this.m_x2;              }
//--- Return coordinate (1) Y1, (2) Y2
   int               Y1(void)             const { return this.m_y1;              }
   int               Y2(void)             const { return this.m_y2;              }

//--- Return (1) width and (2) height
   int               Width(void)          const { return this.m_x2-this.m_x1+1;  }
   int               Height(void)         const { return this.m_y2-this.m_y1+1;  }

//--- Return the list of table rows
지정된 행의 셀 수를 반환하는 공개 메서드를 추가했습니다:
   int               ColumnsInRow(const int row_index)
                       {
                        //--- If there is no row in the list, return 0
                        if(this.RowsTotal()==0)
                           return 0;
                        //--- Get a pointer to the specified row and return the number of cells in it
                        CTableRow *row=this.GetRow(row_index);
                        return(row!=NULL ? row.CellsTotal() : 0);
                       }
//--- Return the total number of cells in the table
테이블 셀의 총 개수를 반환하는 공개 메서드를 추가했습니다:
//--- Return the total number of cells in the table
   int               CellsTotal(void)
                       {
                        //--- If there is no row in the list, return 0
                        if(this.RowsTotal()==0)
                           return 0;
                        //---
                        int num=0;
                        int total=this.RowsTotal();
                        for(int i=0;i<total;i++)
                           num+=this.ColumnsInRow(i);
                        return num;
                       }
//--- Clear lists of rows and table cells
이전에는 단순히 테이블의 첫 번째 행에 있는 열의 개수가 각 행에서 같기를 바라며 열의 개수를 반환했었습니다. 이제 테이블의 각 행에 배치된 셀의 수로 테이블 셀의 총 개수를 구할 수 있습니다. 지정된 행에서 여러개의 셀을 가져올 수도 있습니다. 따라서 격자가 아닌 테이블을 만들 수 있습니다. 행에서 셀의 수가 다른 테이블을 생성하는 것은 테스트되지 않았습니다. 대부분의 경우 추가적인 개선이 필요할 것입니다. 하지만 현재로서는 그러한 테이블이 필요하지 않습니다.
이 클래스에는 가상 비교 메서드가 있어 ID(mode = 0) 또는 이름(mode != 0)으로 테이블을 비교할 수 있습니다:
//--- Virtual method for comparing two objects
   virtual int       Compare(const CObject *node,const int mode=0) const
                       {
                        const CTableData *compared=node;
                        if(mode==0)
                           return(this.ID()>compared.ID() ? 1 : this.ID()<compared.ID() ? -1 : 0);
                        else
                           return(this.Name()==compared.Name() ? 0 : this.Name()>compared.Name() ? 1 : -1);
                       }
이제 생성된 테이블의 ID가 클래스의 파라메트릭 생성자에게 전달됩니다:
//--- Constructor/destructor
                     CTableData(const uint id) : m_id(id){ this.m_list_rows.Clear(); this.m_name="";  }
                    ~CTableData(void)                    { this.m_list_rows.Clear();                  }
이전에는 표 형식 데이터 객체 인스턴스가 패널 클래스에서 선언되었지만 이제 우리는 패널에서 생성된 테이블에 대한 포인터를 포함하도록 목록을 선언합니다.
//+------------------------------------------------------------------+
//| Dashboard class                                                  |
//+------------------------------------------------------------------+
class CDashboard : public CObject
  {
private:
   CCanvas           m_canvas;                  // Canvas
   CCanvas           m_workspace;               // Work space
   CArrayObj         m_list_table;              // List of tables
   ENUM_PROGRAM_TYPE m_program_type;            // Program type
   ENUM_MOUSE_STATE  m_mouse_state;             // Mouse button status
변수를 선언하여 배경 및 작업 영역 픽셀을 비공개 섹션의 파일에 저장하기 위한 파일 이름을 만듭니다:
   string            m_name_gv_m;               // Name of the global terminal variable storing the collapsed panel flag

   string            m_name_gv_u;               // Name of the global terminal variable storing the flag of the pinned panel
   string            m_filename_bg;             // File name to save background pixels
   string            m_filename_ws;             // File name for saving work space pixels

   uint              m_array_wpx[];             // Array of pixels to save/restore the workspace
   uint              m_array_ppx[];             // Array of pixels to save/restore the panel background
패널 글꼴로 작업하고 테이블과 그 좌표를 만들고 가져오는 메서드를 추가하고 개선했습니다:
//--- Set default panel font parameters
   void              SetFontParams(const string name,const int size,const uint flags=0,const uint angle=0);
//--- Return the specified dashboard font parameters
   string            FontParams(int &size,uint &flags,uint &angle);
//--- Return the specified panel (1) font, (2) size and font flags
   string            FontName(void)    const { return this.m_workspace.FontNameGet();  }
   int               FontSize(void)    const { return this.m_workspace.FontSizeGet();  }
   uint              FontFlags(void)   const { return this.m_workspace.FontFlagsGet(); }
//--- Display a text message at the specified coordinates
   void              DrawText(const string text,const int x,const int y,const color clr=clrNONE,const int width=WRONG_VALUE,const int height=WRONG_VALUE);
//--- Create a new table
   bool              CreateNewTable(const int id=WRONG_VALUE);
//--- Return tabular data object by (1) ID and (2) name
   CTableData       *GetTable(const uint id);
   CTableData       *GetTable(const string name);
//--- Draw a (1) background grid (2) with automatic cell size
   void              DrawGrid(const uint table_id,const uint x,const uint y,const uint rows,const uint columns,const uint row_size,const uint col_size,const color line_color=clrNONE,bool alternating_color=true);
   void              DrawGridAutoFill(const uint table_id,const uint border,const uint rows,const uint columns,const color line_color=clrNONE,bool alternating_color=true);
//--- Print grid data (line intersection coordinates)
   void              GridPrint(const uint table_id,const uint indent=0)
                       {
                        CTableData *table=this.GetTable(table_id);
                        if(table==NULL)
                          {
                           ::PrintFormat("%s: Error. Failed to get table object with id %lu",__FUNCTION__,table_id);
                           return;
                          }
                        table.Print(indent);
                       }
//--- Write the X and Y coordinate values of the specified table cell to variables
   void              CellXY(const uint table_id,const uint row,const uint column, int &x, int &y)
                       {
                        CTableData *table=this.GetTable(table_id);
                        if(table==NULL)
                          {
                           ::PrintFormat("%s: Error. Failed to get table object with id %lu",__FUNCTION__,table_id);
                           return;
                          }
                        table.CellXY(row,column,x,y);
                       }
//--- Return the (1) X and (2) Y coordinate of the specified table cell
   int               CellX(const uint table_id,const uint row,const uint column)
                       {
                        CTableData *table=this.GetTable(table_id);
                        if(table==NULL)
                          {
                           ::PrintFormat("%s: Error. Failed to get table object with id %lu",__FUNCTION__,table_id);
                           return WRONG_VALUE;
                          }
                        return table.CellX(row,column);
                       }
   int               CellY(const uint table_id,const uint row,const uint column)
                       {
                        CTableData *table=this.GetTable(table_id);
                        if(table==NULL)
                          {
                           ::PrintFormat("%s: Error. Failed to get table object with id %lu",__FUNCTION__,table_id);
                           return WRONG_VALUE;
                          }
                        return table.CellY(row,column);
                       }
//--- Write X1 and Y1, X2 and Y2 coordinate values of the specified table to the variables
   void              TableCoords(const uint table_id,int &x1,int &y1,int &x2,int &y2)
                       {
                        x1=y1=x2=y2=WRONG_VALUE;
                        CTableData *table=this.GetTable(table_id);
                        if(table==NULL)
                           return;
                        x1=table.X1();
                        y1=table.Y1();
                        x2=table.X2();
                        y2=table.Y2();
                       }

//--- Return the (1) X1, (2) Y1, (3) X2 and (4) Y2 coordinate of the specified table
   int               TableX1(const uint table_id)
                       {
                        CTableData *table=this.GetTable(table_id);
                        return(table!=NULL ? table.X1() : WRONG_VALUE);
                       }
   int               TableY1(const uint table_id)
                       {
                        CTableData *table=this.GetTable(table_id);
                        return(table!=NULL ? table.Y1() : WRONG_VALUE);
                       }
   int               TableX2(const uint table_id)
                       {
                        CTableData *table=this.GetTable(table_id);
                        return(table!=NULL ? table.X2() : WRONG_VALUE);
                       }
   int               TableY2(const uint table_id)
                       {
                        CTableData *table=this.GetTable(table_id);
                        return(table!=NULL ? table.Y2() : WRONG_VALUE);
                       }

//--- Event handler
   void              OnChartEvent(const int id,const long &lparam,const double &dparam,const string &sparam);
//--- Constructor/destructor
                     CDashboard(const uint id,const int x,const int y, const int w,const int h,const int wnd=-1);
                    ~CDashboard();
클래스 생성자에서 배경 및 작업 공간을 저장할 파일 이름을 만듭니다:
//--- Set the names of global terminal variables to store panel coordinates, collapsed/expanded state and pinning
   this.m_name_gv_x=this.m_program_name+"_id_"+(string)this.m_id+"_"+(string)this.m_chart_id+"_X";
   this.m_name_gv_y=this.m_program_name+"_id_"+(string)this.m_id+"_"+(string)this.m_chart_id+"_Y";
   this.m_name_gv_m=this.m_program_name+"_id_"+(string)this.m_id+"_"+(string)this.m_chart_id+"_Minimize";
   this.m_name_gv_u=this.m_program_name+"_id_"+(string)this.m_id+"_"+(string)this.m_chart_id+"_Unpin";

//--- Set file names for saving background and work space pixels
   this.m_filename_bg=this.m_program_name+"\\Dashboard"+(string)this.m_id+"\\background.bin";
   this.m_filename_ws=this.m_program_name+"\\Dashboard"+(string)this.m_id+"\\workspace.bin";
생성자 맨 마지막에 패널이 접히면 파일의 데이터가 배경 및 작업 공간 픽셀 배열에 로드됩니다:
//--- If the panel collapse flag is set, load the background and work space pixels from the files into arrays
   if(this.m_minimized)
     {
      if(::FileIsExist(this.m_filename_bg))
         this.FileLoadBackground();
      if(::FileIsExist(this.m_filename_ws))
         this.FileLoadWorkspace();
     }
  }
따라서 픽셀이 이전에 파일에 저장되어 있고 패널이 최소화된 형태로 생성된 경우 파일에서 패널의 모양이 로드되고 패널이 축소된 형태로 그려집니다. 확장하면 파일에서 채워진 픽셀 배열에서 모양을 얻을 수 있습니다.
소멸자에서 패널이 축소된 경우 패널 객체를 삭제하기 전에 패널을 확장하고 픽셀 데이터를 파일에 쓴 다음 다시 축소해야 합니다. 그 후 패널 객체를 삭제할 수 있으며 그 모양은 파일에 이미 저장되어 나중에 하위의 생성자가 만들어지는 동안 저장된 파일에서 복원되게 됩니다:
//+------------------------------------------------------------------+
//| Destructor                                                       |
//+------------------------------------------------------------------+
CDashboard::~CDashboard()
  {
//--- Write the current values to global terminal variables
   ::GlobalVariableSet(this.m_name_gv_x,this.m_x);
   ::GlobalVariableSet(this.m_name_gv_y,this.m_y);
   ::GlobalVariableSet(this.m_name_gv_m,this.m_minimized);
   ::GlobalVariableSet(this.m_name_gv_u,this.m_movable);

//--- If the panel is collapsed,
//--- expand the panel, save the appearance into pixel arrays and collapse the panel
   if(this.m_minimized)
     {
      this.Expand();
      this.SaveBackground();
      this.SaveWorkspace();
      this.Collapse();
     }
//--- otherwise, if the panel is expanded,
//--- save the appearance into pixel arrays
   else
     {
      this.SaveBackground();
      this.SaveWorkspace();
     }
//--- Save pixel arrays to files
   this.FileSaveBackground();
   this.FileSaveWorkspace();

//--- Delete panel objects
   this.m_canvas.Destroy();
   this.m_workspace.Destroy();
  }
패널 축소/확장 버튼의 클릭 처리 블록에서 플래그를 선택하고 패널이 확장된 경우 배경과 작업 공간을 픽셀 배열로 저장합니다:
      //--- If the panel collapse/expand button is pressed
      else if(state==MOUSE_STATE_PRESSED_INSIDE_MINIMIZE)
        {
         //--- Disable chart scrolling, right-click menu and crosshair
         this.SetChartsTool(false);
         //--- If the panel is not collapsed, save the background and work space into pixel arrays
         if(!this.m_minimized)
           {
            this.SaveWorkspace();
            this.SaveBackground();
           }
         //--- "flip" the panel collapse flag,
         this.m_minimized=!this.m_minimized;
         //--- redraw the panel taking into account the new state of the flag,
         this.Draw(this.m_title);
         //--- redraw the panel header area
         this.RedrawHeaderArea();
         //--- If the panel is pinned and expanded, move it to the stored location coordinates
         if(this.m_minimized && !this.m_movable)
            this.Move(this.m_x_dock,this.m_y_dock);
         //--- Update the canvas with chart redrawing and
         this.m_canvas.Update();
         //--- write the state of the panel expand flag to the global terminal variable
         ::GlobalVariableSet(this.m_name_gv_m,this.m_minimized);
        }
패널 축소 메서드에서 픽셀 배열을 저장하는 문자열이 제거되었습니다. 이제 최소화/확대 버튼을 누를 때만 픽셀을 저장할 수 있습니다:
//+------------------------------------------------------------------+
//| Collapse the panel                                               |
//+------------------------------------------------------------------+
void CDashboard::Collapse(void)
  {
//--- Save the pixels of the working space and the panel background into arrays
   this.SaveWorkspace();
   this.SaveBackground();
//--- Remember the current height of the panel
   int h=this.m_h;
//--- Change the dimensions (height) of the canvas and working space
   if(!this.SetSizes(this.m_canvas.Width(),this.m_header_h))
      return;
//--- Draw the header area
   this.DrawHeaderArea(this.m_title);
//--- Return the saved panel height to the variable
   this.m_h=h;
  }
설정된 대시보드 글꼴 매개 변수를 반환하는 메서드를 구현합니다:
//+------------------------------------------------------------------+
//| Return the specified dashboard font parameters                   |
//+------------------------------------------------------------------+
string CDashboard::FontParams(int &size,uint &flags,uint &angle)
  {
   size=this.m_workspace.FontSizeGet();
   flags=this.m_workspace.FontFlagsGet();
   angle=this.m_workspace.FontAngleGet();
   return this.m_workspace.FontNameGet();
  }
이 메서드는 글꼴의 이름을 반환합니다. 글꼴 크기, 플래그 및 각도는 링크가 전달한 변수에 기록됩니다.
이제 텍스트 색상도 그리기 메서드에 전달됩니다. 기본값은 이전에 설정한 텍스트 색상을 의미하는 clrNONE 입니다:
//+------------------------------------------------------------------+
//| Display a text message at the specified coordinates              |
//+------------------------------------------------------------------+
void CDashboard::DrawText(const string text,const int x,const int y,const color clr=clrNONE,const int width=WRONG_VALUE,const int height=WRONG_VALUE)
  {
//--- Declare variables to record the text width and height in them
   int w=width;
   int h=height;
//--- If the width and height of the text passed to the method have zero values,
//--- then the entire working space is completely cleared using the transparent color
   if(width==0 && height==0)
      this.m_workspace.Erase(0x00FFFFFF);
//--- Otherwise
   else
     {
      //--- If the passed width and height have default values (-1), we get its width and height from the text
      if(width==WRONG_VALUE && height==WRONG_VALUE)
         this.m_workspace.TextSize(text,w,h);
      //--- otherwise,
      else
        {
         //--- if the width passed to the method has the default value (-1) - get the width from the text, or
         //--- if the width passed to the method has a value greater than zero, use the width passed to the method, or
         //--- if the width passed to the method has a zero value, use the value 1 for the width
         w=(width ==WRONG_VALUE ? this.m_workspace.TextWidth(text)  : width>0  ? width  : 1);
         //--- if the height passed to the method has a default value (-1), get the height from the text, or
         //--- if the height passed to the method has a value greater than zero, use the height passed to the method, or
         //--- if the height passed to the method has a zero value, use value 1 for the height
         h=(height==WRONG_VALUE ? this.m_workspace.TextHeight(text) : height>0 ? height : 1);
        }
      //--- Fill the space according to the specified coordinates and the resulting width and height with a transparent color (erase the previous entry)
      this.m_workspace.FillRectangle(x,y,x+w,y+h,0x00FFFFFF);
     }
//--- Display the text to the space cleared of previous text and update the working space without redrawing the screen
   this.m_workspace.TextOut(x,y,text,::ColorToARGB(clr==clrNONE ? this.m_fore_color : clr));
   this.m_workspace.Update(false);
  }
새로운 테이블을 만들고 ID와 테이블 이름으로 표 형식의 데이터를 가져오는 메서드를 구현합니다:
//+------------------------------------------------------------------+
//| Create a new table                                               |
//+------------------------------------------------------------------+
bool CDashboard::CreateNewTable(const int id=WRONG_VALUE)
  {
   uint num=(id>WRONG_VALUE ? id : this.m_list_table.Total());
   CTableData *table=new CTableData(num);
   this.m_list_table.Sort();
   if(this.m_list_table.Search(table)!=WRONG_VALUE)
     {
      PrintFormat("%s: Error. Table with id %lu already exists in the list",__FUNCTION__,num);
      delete table;
      return false;
     }
   if(!this.m_list_table.Add(table))
     {
      PrintFormat("%s: Error. Failed to add table with id %lu to the list",__FUNCTION__,num);
      delete table;
      return false;
     }
   return true;
  }
//+------------------------------------------------------------------+
//| Return tabular data object by ID                                 |
//+------------------------------------------------------------------+
CTableData *CDashboard::GetTable(const uint id)
  {
   if(this.m_list_table.Total()==0)
     {
      PrintFormat("%s: Error. The list of tables is empty. First you need to create a table using CreateNewTable",__FUNCTION__);
      .return NULL;
     }
   CTableData *table=new CTableData(id);
   if(table==NULL)
     {
      ::PrintFormat("%s: Error. Failed to create table object with id %lu",__FUNCTION__,id);
      .return NULL;
     }
   this.m_list_table.Sort();
   int index=this.m_list_table.Search(table);
   delete table;
   return this.m_list_table.At(index);
  }
//+------------------------------------------------------------------+
//| Return tabular data object by name                               |
//+------------------------------------------------------------------+
CTableData *CDashboard::GetTable(const string name)
  {
   if(this.m_list_table.Total()==0)
     {
      PrintFormat("%s: Error. The list of tables is empty. First you need to create a table using CreateNewTable",__FUNCTION__);
      .return NULL;
     }
   CTableData *table=new CTableData(0);
   if(table==NULL)
     {
      ::PrintFormat("%s: Error. Failed to create table object");
      .return NULL;
     }
   table.SetName(name);
   this.m_list_table.Sort(1);
   int index=this.m_list_table.Search(table);
   delete table;
   return this.m_list_table.At(index);
  }
테이블 그리기 메서드의 변경 사항:
//+------------------------------------------------------------------+
//| Draw the background grid                                         |
//+------------------------------------------------------------------+
void CDashboard::DrawGrid(const uint table_id,
                          const uint x,const uint y,const uint rows,const uint columns,const uint row_size,const uint col_size,
                          const color line_color=clrNONE,bool alternating_color=true)
  {
//--- Get a table object by ID
   CTableData *table=this.GetTable(table_id);
   if(table==NULL)
     {
      PrintFormat("%s: Error. Failed to get table object with id %lu",__FUNCTION__,table_id);
      return;
     }
//--- Clear all lists of the tabular data object (remove cells from rows and all rows)
   table.Clear();
//--- Line height cannot be less than 2
   int row_h=int(row_size<2 ? 2 : row_size);
//--- Column width cannot be less than 2
   int col_w=int(col_size<2 ? 2 : col_size);

//--- The X1 (left) coordinate of the table cannot be less than 1 (to leave one pixel around the perimeter of the panel for the frame)
   int x1=int(x<1 ? 1 : x);
//--- Calculate the X2 coordinate (right) depending on the number of columns and their width
   int x2=x1+col_w*int(columns>0 ? columns : 1);
//--- The Y1 coordinate is located under the panel title area
   int y1=this.m_header_h+(int)y;
//--- Calculate the Y2 coordinate (bottom) depending on the number of lines and their height
   int y2=y1+row_h*int(rows>0 ? rows : 1);
//--- Set table coordinates
   table.SetCoords(x1,y1-this.m_header_h,x2,y2-this.m_header_h);

//--- Get the color of the table grid lines, either by default or passed to the method
   color clr=(line_color==clrNONE ? C'200,200,200' : line_color);
//--- If the initial X coordinate is greater than 1, draw a table frame
//--- (in case of the coordinate 1, the table frame is the panel frame)
   if(x1>1)
      this.m_canvas.Rectangle(x1,y1,x2,y2,::ColorToARGB(clr,this.m_alpha));
//--- In the loop by table rows,
   for(int i=0;i<(int)rows;i++)
     {
      //--- calculate the Y coordinate of the next horizontal grid line (Y coordinate of the next table row)
      int row_y=y1+row_h*i;
      //--- if the flag of "alternating" line colors is passed and the line is even
      if(alternating_color && i%2==0)
        {
         //--- lighten the table background color and draw a background rectangle
         color new_color=this.NewColor(clr,45,45,45);
         this.m_canvas.FillRectangle(x1+1,row_y+1,x2-1,row_y+row_h-1,::ColorToARGB(new_color,this.m_alpha));
        }
      //--- Draw a table grid horizontal line
      this.m_canvas.Line(x1,row_y,x2,row_y,::ColorToARGB(clr,this.m_alpha));

      //--- Create a new table row object
      CTableRow *row_obj=new CTableRow(i);
      if(row_obj==NULL)
        {
         ::PrintFormat("%s: Failed to create table row object at index %lu",(string)__FUNCTION__,i);
         continue;
        }
      //--- Add it to the list of rows of the tabular data object
      //--- (if adding an object failed, delete the created object)
      if(!table.AddRow(row_obj))
         delete row_obj;
      //--- Set its Y coordinate in the created row object taking into account the offset from the panel title
      row_obj.SetY(row_y-this.m_header_h);
     }

//--- In the loop by table columns,
   for(int i=0;i<(int)columns;i++)
     {
      //--- calculate the X coordinate of the next vertical grid line (X coordinate of the next table row)
      int col_x=x1+col_w*i;
      //--- If the grid line goes beyond the panel, interrupt the loop
      if(x1==1 && col_x>=x1+m_canvas.Width()-2)
         break;
      //--- Draw a vertical line of the table grid
      this.m_canvas.Line(col_x,y1,col_x,y2,::ColorToARGB(clr,this.m_alpha));

      //--- Get the number of created rows from the table data object
      int total=table.RowsTotal();
      //--- In the loop by table rows
      for(int j=0;j<total;j++)
        {
         //--- get the next row
         CTableRow *row=table.GetRow(j);
         if(row==NULL)
            continue;
         //--- Create a new table cell
         CTableCell *cell=new CTableCell(row.Row(),i);
         if(cell==NULL)
           {
            ::PrintFormat("%s: Failed to create table cell object at index %lu",(string)__FUNCTION__,i);
            continue;
           }
         //--- Add the created cell to the row
         //--- (if adding an object failed, delete the created object)
         if(!row.AddCell(cell))
           {
            delete cell;
            continue;
           }
         //--- In the created cell object, set its X coordinate and the Y coordinate from the row object
         cell.SetXY(col_x,row.Y());
        }
     }
//--- Update the canvas without redrawing the chart
   this.m_canvas.Update(false);
  }
//+------------------------------------------------------------------+
//| Draws the background grid with automatic cell sizing             |
//+------------------------------------------------------------------+
void CDashboard::DrawGridAutoFill(const uint table_id,const uint border,const uint rows,const uint columns,const color line_color=clrNONE,bool alternating_color=true)
  {
//--- Get a table object by ID
   CTableData *table=this.GetTable(table_id);
   if(table==NULL)
     {
      PrintFormat("%s: Error. Failed to get table object with id %lu",__FUNCTION__,table_id);
      return;
     }
//--- X1 (left) table coordinate
   int x1=(int)border;
//--- X2 (right) table coordinate
   int x2=this.m_canvas.Width()-(int)border-1;
//--- Y1 (upper) table coordinate
   int y1=this.m_header_h+(int)border;
//--- Y2 (lower) table coordinate
   int y2=this.m_canvas.Height()-(int)border-1;
//--- Set table coordinates
   table.SetCoords(x1,y1,x2,y2);

//--- Get the color of the table grid lines, either by default or passed to the method
   color clr=(line_color==clrNONE ? C'200,200,200' : line_color);
//--- If the offset from the edge of the panel is greater than zero, draw a table border,
//--- otherwise, the panel border is used as the table border
   if(border>0)
      this.m_canvas.Rectangle(x1,y1,x2,y2,::ColorToARGB(clr,this.m_alpha));

//--- Height of the entire table grid
   int greed_h=y2-y1;
//--- Calculate the row height depending on the table height and the number of rows
   int row_h=(int)::round((double)greed_h/(double)rows);
//--- In the loop based on the number of rows
   for(int i=0;i<(int)rows;i++)
     {
      //--- calculate the Y coordinate of the next horizontal grid line (Y coordinate of the next table row)
      int row_y=y1+row_h*i;
      //--- if the flag of "alternating" line colors is passed and the line is even
      if(alternating_color && i%2==0)
        {
         //--- lighten the table background color and draw a background rectangle
         color new_color=this.NewColor(clr,45,45,45);
         this.m_canvas.FillRectangle(x1+1,row_y+1,x2-1,row_y+row_h-1,::ColorToARGB(new_color,this.m_alpha));
        }
      //--- Draw a table grid horizontal line
      this.m_canvas.Line(x1,row_y,x2,row_y,::ColorToARGB(clr,this.m_alpha));

      //--- Create a new table row object
      CTableRow *row_obj=new CTableRow(i);
      if(row_obj==NULL)
        {
         ::PrintFormat("%s: Failed to create table row object at index %lu",(string)__FUNCTION__,i);
         continue;
        }
      //--- Add it to the list of rows of the tabular data object
      //--- (if adding an object failed, delete the created object)
      if(!table.AddRow(row_obj))
         delete row_obj;
      //--- Set its Y coordinate in the created row object taking into account the offset from the panel title
      row_obj.SetY(row_y-this.m_header_h);
     }

//--- Table grid width
   int greed_w=x2-x1;
//--- Calculate the column width depending on the table width and the number of columns
   int col_w=(int)::round((double)greed_w/(double)columns);
//--- In the loop by table columns,
   for(int i=0;i<(int)columns;i++)
     {
      //--- calculate the X coordinate of the next vertical grid line (X coordinate of the next table row)
      int col_x=x1+col_w*i;
      //--- If this is not the very first vertical line, draw it
      //--- (the first vertical line is either the table frame or the panel frame)
      if(i>0)
         this.m_canvas.Line(col_x,y1,col_x,y2,::ColorToARGB(clr,this.m_alpha));

      //--- Get the number of created rows from the table data object
      int total=table.RowsTotal();
      //--- In the loop by table rows
      for(int j=0;j<total;j++)
        {
         //--- get the next row
         CTableRow *row=table.GetRow(j);
         if(row==NULL)
            continue;
         //--- Create a new table cell
         CTableCell *cell=new CTableCell(row.Row(),i);
         if(cell==NULL)
           {
            ::PrintFormat("%s: Failed to create table cell object at index %lu",(string)__FUNCTION__,i);
            continue;
           }
         //--- Add the created cell to the row
         //--- (if adding an object failed, delete the created object)
         if(!row.AddCell(cell))
           {
            delete cell;
            continue;
           }
         //--- In the created cell object, set its X coordinate and the Y coordinate from the row object
         cell.SetXY(col_x,row.Y());
        }
     }
//--- Update the canvas without redrawing the chart
   this.m_canvas.Update(false);
  }
이제 파일에 픽셀을 저장/로드하는 메서드는 생성자에서 이전에 생성한 파일 이름을 적용합니다:
//+------------------------------------------------------------------+
//| Save the pixel array of the working space to a file              |
//+------------------------------------------------------------------+
bool CDashboard::FileSaveWorkspace(void)
  {
//--- If the saved array is empty, inform of that and return 'false'
   if(this.m_array_wpx.Size()==0)
     {
      ::PrintFormat("%s: Error. The workspace pixel array is empty.",__FUNCTION__);
      return false;
     }
//--- If the array could not be saved to a file, report this and return 'false'
   if(!::FileSave(this.m_filename_ws,this.m_array_wpx))
     {
      ::PrintFormat("%s: FileSave '%s' failed. Error %lu",__FUNCTION__,this.m_filename_ws,::GetLastError());
      return false;
     }
//--- Successful, return 'true'
   return true;
  }
//+------------------------------------------------------------------+
//| Save the pixel array of the panel background to a file           |
//+------------------------------------------------------------------+
bool CDashboard::FileSaveBackground(void)
  {
//--- If the saved array is empty, inform of that and return 'false'
   if(this.m_array_ppx.Size()==0)
     {
      ::PrintFormat("%s: Error. The background pixel array is empty.",__FUNCTION__);
      return false;
     }
//--- If the array could not be saved to a file, report this and return 'false'
   if(!::FileSave(this.m_filename_bg,this.m_array_ppx))
     {
      ::PrintFormat("%s: FileSave '%s' failed. Error %lu",__FUNCTION__,this.m_filename_bg,::GetLastError());
      return false;
     }
//--- Successful, return 'true'
   return true;
  }
//+------------------------------------------------------------------+
//| Upload the array of working space pixels from a file             |
//+------------------------------------------------------------------+
bool CDashboard::FileLoadWorkspace(void)
  {
//--- If failed to upload data from the file into the array, report this and return 'false'
   if(::FileLoad(this.m_filename_ws,this.m_array_wpx)==WRONG_VALUE)
     {
      ::PrintFormat("%s: FileLoad '%s' failed. Error %lu",__FUNCTION__,this.m_filename_ws,::GetLastError());
      return false;
     }
//--- Successful, return 'true'
   return true;
  }
//+------------------------------------------------------------------+
//| Upload the array of panel background pixels from a file          |
//+------------------------------------------------------------------+
bool CDashboard::FileLoadBackground(void)
  {
   if(::FileLoad(this.m_filename_bg,this.m_array_ppx)==WRONG_VALUE)
     {
      ::PrintFormat("%s: FileLoad '%s' failed. Error %lu",__FUNCTION__,this.m_filename_bg,::GetLastError());
      return false;
     }
//--- Successful, return 'true'
   return true;
  }
결론
이 글에서는 볼륨과 빌 윌리엄스의 지표 EA에 대해 살펴봤습니다. 문서에 제공된 모든 코드를 '있는 그대로' 사용하여 사용자 지정 코드에 삽입할 수 있습니다. 다음으로 마지막 지표 범주인 추세 지표를 EA에서 연결하고 사용 측면에서 살펴보겠습니다.
모든 파일(테스트 EA 및 패널 클래스)은 아래 첨부된 파일 목록에서 다운로드할 수 있습니다. 패널 클래스는 \MQL5\Include\Dashboard\Dashboard.mqh.에 위치합니다.
MetaQuotes 소프트웨어 사를 통해 러시아어가 번역됨.
원본 기고글: https://www.mql5.com/ru/articles/13277
경고: 이 자료들에 대한 모든 권한은 MetaQuotes(MetaQuotes Ltd.)에 있습니다. 이 자료들의 전부 또는 일부에 대한 복제 및 재출력은 금지됩니다.
이 글은 사이트 사용자가 작성했으며 개인의 견해를 반영합니다. Metaquotes Ltd는 제시된 정보의 정확성 또는 설명 된 솔루션, 전략 또는 권장 사항의 사용으로 인한 결과에 대해 책임을 지지 않습니다.

한 가지 세부 사항; Bill Williams 책에서 눈먼 닭에 대한 문장은 다음과 같습니다.
"눈먼 닭도 가끔 옥수수 귀를 찾을 것입니다."
여기에 이렇게 적혀 있습니다.
"눈먼 닭도 항상 동시에 먹이를 주면 옥수수를 찾을 것입니다." 그러나 번역 효과 러시아어/영어 일 수 있습니다.
빌 윌리엄스는 그의 책에서 "현대의 대중 최면 트렌드"라고 가정하고 악어 지표의 세 가지 이동평균 곡선을
"양자 물리학, 홀로그래피, 사이버네틱스, 비선형 역학, 정보 이론 및 프랙탈 기하학과 함께 혼돈의 과학"과 관련이 있는 것처럼 과장하고 있습니다. 그러나 그의 혼돈의 말은 약간 과장된 면이 있습니다. 이 책에는 훌륭한 지혜도 담겨 있습니다. 그럼에도 불구하고 앨리게이터는 MA의 편리한 조합입니다.
"양자 물리학, 홀로그래피, 사이버네틱스, 비선형 역학, 정보 이론 및 프랙탈 기하학과 함께 혼돈의 과학"과 관련이 있는 것처럼 과장하고 있습니다. 그러나 그의 혼돈의 말은 약간 과장된 면이 있습니다. 이 책에는 훌륭한 지혜도 담겨 있습니다. 그럼에도 불구하고 악어는 MA의 편리한 조합입니다.
평가해 주셔서 감사합니다.
윌리엄스의 작품을 읽지 않았기 때문에 그가 정확히 어떻게 그리고 무엇을 말했는지는 말하지 않겠습니다.
글쎄, 당신은 많이 말하고 쓸 수 있습니다. 하지만 더 중요한 것은 그것을하는 것입니다. 그리고 더 좋은 방법은 제대로 하는 것입니다.)
패널을 최소화하고 기간을 전환하면 그리드를 볼 수 있습니다.
어떻게 수정하나요?
비디오, 재생하려면 누릅니다.
-
동영상, 재생하려면 누릅니다.
-
아래쪽에는 이 라이브러리를 사용하는 더 많은 문서가 있습니다. 상당히 많이 개선되었습니다. 이 라이브러리의 최신 버전을 사용하세요. 이제 어떤 문서에서 마지막으로 사용되었는지 정확히 말할 수 없습니다. 하지만 제 기사 목록에서 찾을 수 있습니다. 라이브러리가 마지막으로 사용된 글은 이 라이브러리의 최신 버전입니다. 확인해 보셔야 합니다. 아직은 그럴 수 없습니다.