
Google Chart API를 통해 차트를 구성하는 라이브러리
소개
Google Chart를 사용하면 11 가지 유형의 다양한 차트를 만들 수 있습니다. 여기 있습니다.- 라인 차트
- 바 차트
- 분산형 차트
- 레이더 차트
- 캔들 스틱 차트
- 벤 차트
- QR 코드
- 지도 차트
- 방식
- 그래프 차트
- 파이 차트
이 글에서 언급 된대로 충분한 작업 세트 (준비된 차트를 얻기 위해 수행해야 하는 모든 작업)는 특별히 조립 된 쿼리를 Google 서버로 보내는 것입니다. 이를 수행하는 방법에 대한 간단한 예는 표준 라이브러리 클래스 및 Google Chart API를 사용하여 정보 게시판 만들기 글에서 구현되었지만이 서비스가 제공 할 수있는 것의 10 분의 1도 되지 않습니다. 당연히 요청을 적절하게 어셈블하기 위해서는 그 구조와 키워드를 조사해야 하므로 이 글에서는 사용자가 원하는 차트를 빠르게 만들 수 있는 클래스 라이브러리를 만들려고 합니다. 차트에 배치하고 차트가 구성된 기준에 따라 데이터를 동적으로 업데이트합니다.
이 글에서는 라이브러리 코드를 대량으로 계산하지 않을 것이지만 대신 Doxygen을 사용하여 생성 첨부된 인증서가 있을 것입니다 (자세한 내용은 이 글의 MQL5 코드에 대한 자동 생성 문서를 참조할 것). 여기에서 차트를 만드는 과정에서 발생하는 열거 및 예외에 대한 라이브러리 클래스의 공개 메소드에 대한 설명과 문서를 찾을 수 있습니다.
1. 차트 획득 및 표시 방법 설명
끝에서부터 시작해봅시다. 요청을 올바르게 공식화했다고 가정합니다. 이제 차트를 표시하려면 서버로 전송하고 응답을 파일에 기록한 다음 파일을 그래프의 그래픽 개체에 첨부해야 합니다. 인터넷으로 작업하기 위해 인터넷을 통한 터미널 간 데이터 교환을 위해 WinInet.dll 사용 문서에 설명 된 함수를 사용합니다.
또한 한 가지 작은 문제가 있습니다. 이미지를 표시하도록 설계된 구성 요소 (그림 및 그래픽 태그)는 BMP 형식의 이미지에서만 작동하는 반면 Google 차트는 PNG 또는 GIF만 반환합니다. 따라서 이미지를 변환해야 합니다. 이 ID는 Convert_PNG () 함수에 의해 생성됩니다. 차트를 얻기 위한 함수 코드는 다음과 같습니다.
bool CDiagram::GetChart()
{
   if(!ObjExist()) {SetUserError(DIAGRAM_ERR_OBJ_NOT_EXIST); return false;}
   string request=CreateRequest();
   //Print(request);
   if(StringLen(request)>2048) {SetUserError(DIAGRAM_ERR_TOO_LARGE_REQUEST); return false;}
   //try to establish a connection
   int rv=InternetAttemptConnect(0);
   if(rv!=0) {SetUserError(DIAGRAM_ERR_INTERNET_CONNECT_FAILED); return false;}
   //initialize the structures
   int hInternetSession=InternetOpenW("Microsoft Internet Explorer", 0, "", "", 0);
   if(hInternetSession<=0) {SetUserError(DIAGRAM_ERR_INTERNET_CONNECT_FAILED); return false;}
   //send request
   int hURL=InternetOpenUrlW(hInternetSession, request, "", 0, 0, 0);
   if(hURL<=0) SetUserError(DIAGRAM_ERR_INTERNET_CONNECT_FAILED);
   //prepare the paths for conversion
   CString src;
   src.Assign(TerminalInfoString(TERMINAL_PATH));
   src.Append("\MQL5\Files\\"+name+".png");
   src.Replace("\\","\\\\");
   CString dst;
   dst.Assign(TerminalInfoString(TERMINAL_PATH));
   dst.Append("\MQL5\Images\\"+name+".bmp");
   dst.Replace("\\","\\\\");
   DeleteFileW(dst.Str());
   DeleteFileW(src.Str());
   CFileBin chart_file;//file into which the results are recorded
                       //create it
   chart_file.Open(name+".png",FILE_BIN|FILE_WRITE);
   //****************************
   int dwBytesRead[1];// number of recorded documents
   char readed[1000];//the actual data
                    //read the data, received from the server after the request
   while(InternetReadFile(hURL,readed,1000,dwBytesRead))
     {
      if(dwBytesRead[0]<=0) break;//no data - exit
      chart_file.WriteCharArray(readed,0,dwBytesRead[0]);//record the data into the file
     }
   InternetCloseHandle(hInternetSession);//terminate the connection
   chart_file.Close();//and file
   //convert the file
   if(!Convert_PNG(src.Str(), dst.Str())) SetUserError(DIAGRAM_ERR_IMAGE_CONVERSION_FAILED);
   //attach the file to the graphic object
   switch (obj_type)
   {
      case OBJ_BITMAP:
      {
         ObjectSetString(chart_ID, name, OBJPROP_BMPFILE, name+".bmp");
         return true;
      }
      case OBJ_BITMAP_LABEL:
      {
         ObjectSetString(chart_ID, name, OBJPROP_BMPFILE, 0, name+".bmp");
         ObjectSetString(chart_ID, name, OBJPROP_BMPFILE, 1, name+".bmp");
         return true;
      }
      default: return false;
   }
   //redraw the chart
   ChartRedraw();
}
Google Charts 라이브러리를 만드는 동안 표준 라이브러리의 클래스를 광범위하게 사용했다는 점은 주목할 가치가 있습니다. 개발자 분들께 특별히 감사를드립니다.
2. Google Charts 라이브러리의 구성 요소 개요
서버에 대한 요청은 다음과 같이 시작해야 합니다. http://chart.apis.google.com/chart?cht = , 추가로 차트 유형을 표시한 다음 모든 다른 매개 변수. 요청은 헤더 외에 명령과 매개 변수로 구성됩니다. 명령은 "&" 기호로 서로 구분됩니다. 예를 들어, & Chtt = Title 명령은 차트 헤더에 "Title" 이라는 단어를 설정합니다.
자 그럼 이제 한 번 봅시다.
2.1 라인 차트
속성 수가 가장 많은 가장 자주 사용되는 차트 일 것입니다. 차트 구성은 CLineXYChart 클래스에 의해 수행됩니다. 예:
CLineXYChart chart;
chart.Attach(0, "test diagram");
chart.SetSize(200,200);
double Y[10]={-50, -40, -25, -35, 10, 50, 70, 40, 15, 80};
chart.AddLine(Y, Red, 0, "Test line");
chart.GetChart();
결과적으로 "테스트 다이어그램"이라는 구성 요소에 다음 이미지가 표시됩니다.
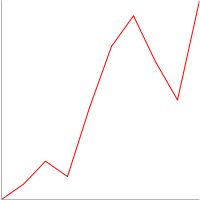
그림 1. 꺾은 선형 차트를 만드는 간단한 예
클래스 메소드의 인증서는 첨부된 인증서에서 찾을 수 있습니다. 여기에 몇 가지 사용 예가 있습니다.
축과 그리드의 다른 선을 추가하여 차트를 복잡하게 만듭니다.
//create a copy of the class
CLineXYChart chart;
//attach it to the object constructed earlier
chart.Attach(0, "test diagram");
//set the size
chart.SetSize(200,200);
//prepare the data
double Y2[10]={-70, -5, 6, 8, 10, 20, 100, 130, 90, 60};
double Y[10]={-50, -40, -25, -35, 10, 50, 70, 40, 15, 80};
//add lines
chart.AddLine(Y, Red, 0, "Test line");
chart.AddLine(Y2, Blue, 0, "Test line 2");
//axis
chart.SetAxis(DIAGRAM_AXIS_BOTTOM|DIAGRAM_AXIS_LEFT, -1, 0, 0, 10, 0);
//and grid
chart.SetGrid();
//obtain the chart
chart.GetChart();
이제 차트는 아래 이미지와 동일한 보기를 사용합니다. 한 가지 중요한 함수에 주목할 가치가 있습니다. GetChart () 메소드는 차트를 받는 메소드이기 때문에 다른 메소드 다음에 호출해야 합니다.
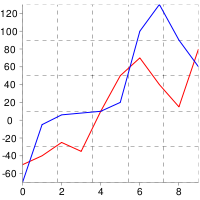
그림 2. 선형 그래프의 더 복잡한 예
그게 다가 아닙니다. 마커, 제목, 범례 및 채우기를 추가합니다.
//create a class copy
CLineXYChart chart;
//attach it to the object created earlier
chart.Attach(0, "test diagram");
//set the size
chart.SetSize(500,300);
//prepare the data
double Y2[10]={-70, -5, 6, 8, 10, 20, 100, 130, 90, 60};
double Y[10]={-50, -40, -25, -35, 10, 50, 70, 40, 15, 80};
//add lines
int first_line=chart.AddLine(Y, Red, 0, "Test line");
int second_line=chart.AddLine(Y2, Blue, 0, "Test line 2");
//axis
chart.SetAxis(DIAGRAM_AXIS_BOTTOM|DIAGRAM_AXIS_LEFT, -1, 0, 0, 10, 0);
//grid
chart.SetGrid();
//legend
chart.ShowLegend();
//title
chart.SetTitle("My Chart", Green, 15);
//filling
chart.SetFill(Linen);
//markers
chart.SetLineMarker(first_line, DIAGRAM_LINE_MARKERS_DIAMOND, BlueViolet, 10);
chart.SetLineMarker(second_line, DIAGRAM_LINE_MARKERS_CROSS, YellowGreen, 15);
//obtain the chart
chart.GetChart();
특정 줄에 고유한 속성 구성을 위해 식별자 (first_line 및 second_line)를 사용하여 적절한 메소드로 전달합니다.
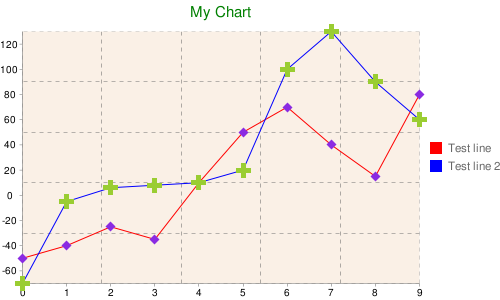
그림 3. 더 많은 b 꺾은 선형 차트의 복잡한 예
그러나 이게 끝이 아닙니다. 선에 태그를 추가하고, 선 아래와 선 사이 영역을 채우고, 선 크기를 조정하고, 보조 축에 선을 추가할 수 있습니다.
//create a class copy
CLineXYChart chart;
//attach it to the object created earlier
chart.Attach(0, "test diagram");
//set the size
chart.SetSize(700,400);
//prepare the data
double Y3[10]={1000, 1200, 1800, 1700, 1300, 900, 700, 750, 800, 600};
double X3[10]={2, 4, 5, 6, 10, 15, 17, 20, 21, 23};
double Y2[10]={-70, -5, 6, 8, 10, 20, 100, 130, 90, 60};
double Y[10]={-50, -40, -25, -35, 10, 50, 70, 40, 15, 80};
//add lines
int first_line=chart.AddLine(Y, Red, 0, "Test line");
int second_line=chart.AddLine(Y2, Blue, 0, "Test line 2");
int third_line=chart.AddLine(Y3, X3, Green, 0, "Test line 3");
//major axis
chart.SetAxis(DIAGRAM_AXIS_BOTTOM|DIAGRAM_AXIS_LEFT, -1, 0, 0, 10, 0);
//minor axis
chart.SetAxis(DIAGRAM_AXIS_RIGHT|DIAGRAM_AXIS_TOP, third_line, 0, Red, 15, 2);
//grid
chart.SetGrid();
//legend
chart.ShowLegend(DIAGRAM_LEGEND_POSITION_BOTTOM_HORIZONTAL);
//title
chart.SetTitle("My Chart", Green, 15);
//filling in the chart
chart.SetFill(Linen, Silver);
//markers
chart.SetLineMarker(first_line, DIAGRAM_LINE_MARKERS_DIAMOND, BlueViolet, 10);
chart.SetLineMarker(second_line, DIAGRAM_LINE_MARKERS_CROSS, YellowGreen, 15);
//set the filling between the two lines
chart.SetLineFilling(first_line, Lime , second_line);
//add tags
chart.AddLabel(first_line, DIAGRAM_LABEL_TYPE_FLAG, 5, "Flag", Red, 15);
chart.AddLabel(second_line, DIAGRAM_LABELS_TYPE_ANNOTATION, 3, "annotation", Blue, 25);
//slightly compress the lines (by 20%)
chart.SetLineScaling(second_line, false, 20);
//attach the third line to the minor axis
chart.SetLineScaling(third_line, true, 20);
//obtain the chart
chart.GetChart();
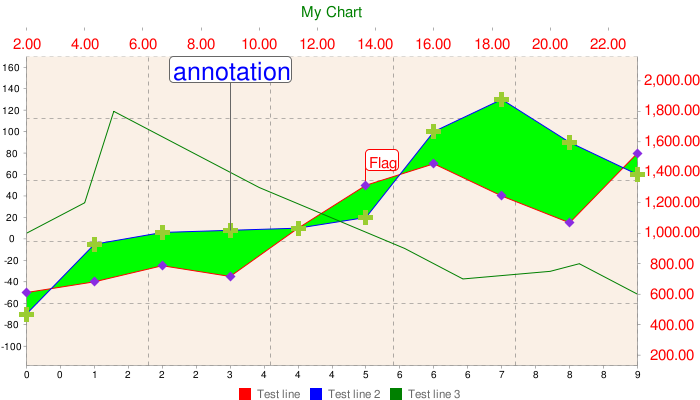
그림 4. 꺾은 선형 차트의 모든 함수
차트의 데이터를 동적으로 업데이트하려면 SetLineData () 메소드를 사용하거나 DeleteLine ()을 사용하여 이전 데이터가 있는 선을 완전히 제거하고 새로 만들 수 있습니다. 그러나 첫 번째 방법이 바람직합니다.
2.2 바 차트
즉, 이것은 바 그래프입니다. CBarChart 클래스는 이를 구성합니다. 마커가 없고 X 축에 대한 데이터 집합을 지정해야 하고 이 유형의 차트에 고유한 특정 함수가 존재하기 때문에 CLineXYChart와 다릅니다. 다른 모든 측면에서 모든 것이 CLineXYChart와 동일합니다.
예:
CBarChart chart;
chart.Attach(0, "test diagram");
//set the size
chart.SetSize(700,400);
//prepare the data
double Y3[10]={100, 120, 18, 17, 13, 9, 70, 75, 80, 60};
double Y2[10]={70, 5, 6, 8, 10, 20, 100, 130, 90, 60};
double Y[10]={50, 40, 25, 35, 10, 50, 70, 40, 15, 80};
//add lines
int first_line=chart.AddLine(Y, Red, 0, "Test bar 1");
int second_line=chart.AddLine(Y2, Blue, 0, "Test bar 2");
int third_line=chart.AddLine(Y3, Green, 0, "Test bar 3");
//major axis
chart.SetAxis(DIAGRAM_AXIS_BOTTOM|DIAGRAM_AXIS_LEFT, -1, 0, 0, 10, 0);
//grid
chart.SetGrid();
//legend
chart.ShowLegend();
//title
chart.SetTitle("My Chart", Green, 15);
//chart filling
chart.SetFill(Linen, Silver);
//obtain the chart
chart.GetChart();
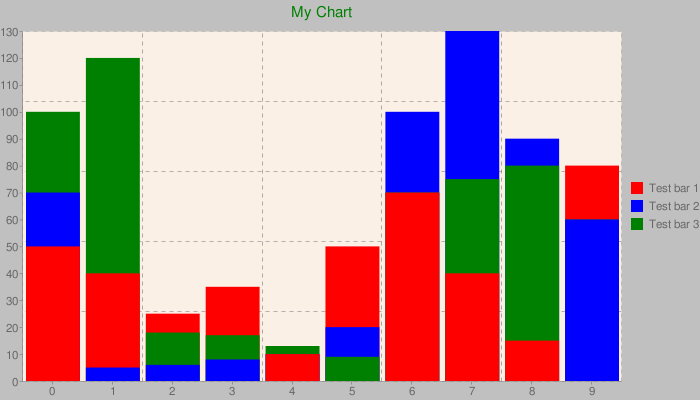
그림 5. 바 차트의 예
세 개의 데이터 세트가 있으며 바는 표시에 최적화된 순서대로 서로 위에 있습니다. 그러나 열을 그룹화하는 다른 방법이 있습니다. SetGrouped () 메소드를 사용하여 설정됩니다.
/ / Set the grouping chart.SetGrouped (true);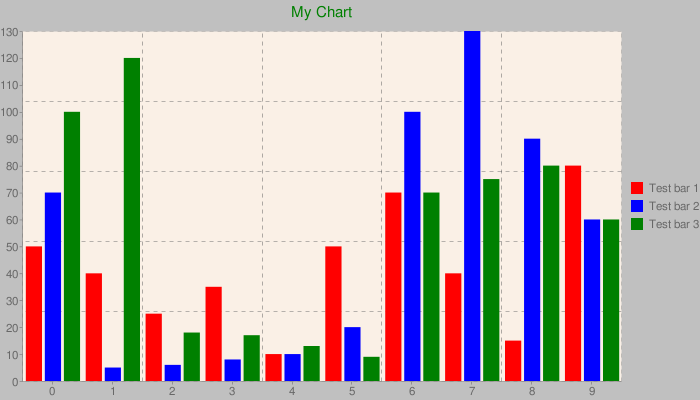
그림 6. SetGrouped () 메소드를 사용하여 설정됩니다.
보시다시피 이제 기둥은 서로 위에 위치하지 않고 생성 순서에 따라 배치됩니다.
2.3 파이 차트
CPieChart 클래스는 원형 차트를 구성합니다. 2차원 및 3차원 차트를 만들 수 있습니다.
CPieChart chart;
chart.Attach(0, "test diagram");
//set the size
chart.SetSize(300,200);
//add sections
chart.AddPieSlice(10, 0, Red, 0, "Test slice 1");
chart.AddPieSlice(20, 0, Green, 0, "Test slice 2");
chart.AddPieSlice(30, 0, Blue, 0, "Test slice 3");
//legends
chart.ShowLegend();
//title
chart.SetTitle("My Chart", Green, 15);
//display mode - 2D
chart.SetPieType(true);
//obtain the chart
chart.GetChart();

그림 7. 파이 차트의 2D 및 3D 예
디스플레이 유형 (2D 또는 3D)은 SetPieType () 메소드를 호출하여 설정됩니다. 또 다른 유용한 함수는 여러 개의 벨소리를 설정하는 함수가지만 이 경우 2D 모드만 사용할 수 있습니다. 두 번째 링을 설정하려면 AddPieSlice () 메소드의 치수 매개 변수를 0과 다르게 지정합니다.
//add the second ring
chart.AddPieSlice(50, 1, YellowGreen, 0, "Test ring 1");
chart.AddPieSlice(20, 1, Magenta, 0, "Test ring 2");
chart.AddPieSlice(70, 1, Maroon, 0, "Test ring 3");
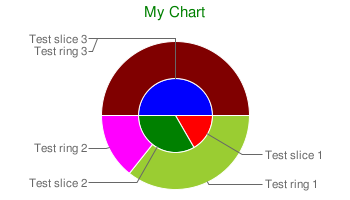
그림 8. 동심원 원형 차트
위의 차트에는 원격 섹터 태그도 포함되어 있습니다. SetPieLabels () 메소드로 설정되며 범례를 대체할 수 있습니다. 그러나 한 가지 단점이 있습니다. 태그 크기가 차트 크기에 자동으로 맞춰지지 않아 태그가 경계를 넘어 넘칠 수 있습니다. 이 경우 차트의 너비를 늘려야 합니다. 그리드, 축, 마커 및 스케일 설정은 이 차트 유형에서 제공되지 않습니다. 섹터는 DeleteLine () 메소드로 제거 할 수 있습니다.
2.4 레이더 차트
CRadarChart 클래스는 레이더 차트를 구성합니다. CLineXYChart 클래스와 차이가 없습니다. 모든 방법은 CRadarChart에서 사용할 수 있습니다.
CRadarChart chart;
chart.Attach(0, "test diagram");
//set the size
chart.SetSize(300,300);
//add lines
double Y3[10]={100, 120, 18, 17, 13, 9, 70, 75, 80, 60};
double Y2[10]={70, 5, 6, 8, 10, 20, 100, 130, 90, 60};
double Y[10]={50, 40, 25, 35, 10, 50, 70, 40, 15, 80};
int first_line=chart.AddLine(Y, Red, 0, "Test line");
int second_line=chart.AddLine(Y2, Blue, 0, "Test line 2");
int third_line=chart.AddLine(Y3, Green, 0, "Test line 3");
//set the filling between the two lines
chart.SetLineFilling(first_line, Lime , second_line);
//markers
chart.SetLineMarker(first_line, DIAGRAM_LINE_MARKERS_CIRCLE, BlueViolet, 10);
chart.SetLineMarker(second_line, DIAGRAM_LINE_MARKERS_DIAMOND, YellowGreen, 15);
//title
chart.SetTitle("My Chart", Green, 15);
//grid
chart.SetGrid();
//legend
chart.ShowLegend(DIAGRAM_LEGEND_POSITION_BOTTOM_HORIZONTAL);
//obtain the chart
chart.GetChart();
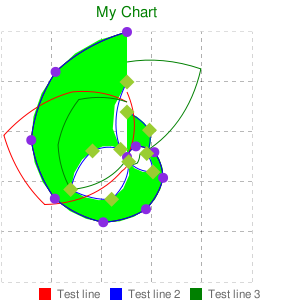
그림 9. 레이더 차트
2.5 캔들 스틱 차트
CCandleChart 클래스는 캔들 스틱 차트를 구성합니다. 캔들 스틱은 AddCandles () 메소드에 의해 추가됩니다.
CCandleChart chart;
chart.Attach(0, "test diagram");
//set the size
chart.SetSize(300,300);
//add 10 candlesticks to the current chart
double Open[10], Close[10], High[10], Low[10];
CopyOpen(Symbol(), PERIOD_CURRENT, 0, 10, Open);
CopyClose(Symbol(), PERIOD_CURRENT, 0, 10, Close);
CopyHigh(Symbol(), PERIOD_CURRENT, 0, 10, High);
CopyLow(Symbol(), PERIOD_CURRENT, 0, 10, Low);
chart.AddCandles(Open, Close, High, Low);
//title
chart.SetTitle(Symbol(), Green, 15);
//grid
chart.SetGrid();
//major axis
chart.SetAxis(DIAGRAM_AXIS_LEFT, -1, 0, 0, 10, 4);
//obtain the chart
chart.GetChart();
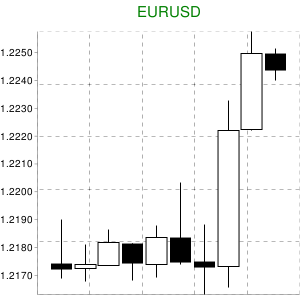
그림 10. 캔들 스틱 차트
이 유형의 차트에는 마커, 범례 및 레이블을 사용할 수 없습니다.
2.6 방식
CFormulaChart 클래스를 사용하면 수식을 만들 수 있습니다. 이 수식은 TeX 언어의 한 줄 형식으로 SetFormulaString () 메소드에 전달됩니다.
CFormulaChart chart;
chart.Attach(0, "test diagram");
//set the size
chart.SetSize(300,75);
//add the formula
chart.SetFormulaString("x=-b\pm\sqrt{b^2-4ac}\over(2a)");
//its color
chart.SetFormulaColor(Blue);
//title
chart.GetChart();
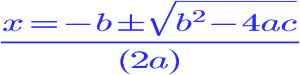
그림 11. 방식
채우기는 SetFill () 메소드를 사용하여 설정할 수도 있습니다. 추가 함수는 지원되지 않습니다.
2.7 그래프 차트
CGraphChart 클래스는 차트를 구성합니다. AddNode () 및 AddEdge () 메소드는 차트에 노드와 간선을 추가합니다.
CGraphChart chart;
chart.Attach(0, "test diagram");
//set the size
chart.SetSize(300,220);
//add nodes and edges
int A=chart.AddNode("A");
int B=chart.AddNode("B");
int C=chart.AddNode("C");
int D=chart.AddNode("D");
chart.AddEdge(A,B);
chart.AddEdge(B,C);
chart.AddEdge(C,D);
chart.AddEdge(A,C);
//set the engine
chart.SetEngine(DIAGRAM_GRAPH_ENGINE_NEATO);
//and arrows
chart.SetGraphType(false);
//title
chart.GetChart();
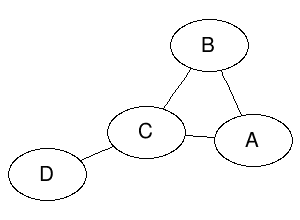
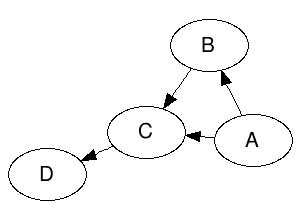
그림 11. 그래프
SetEngine () 메소드는 그래프 구성에 사용되는 특정 유형의 그래픽 엔진을 설정합니다. 직접 실험해 볼 수 있습니다. DeleteNode () 및 DeleteEdge () 메소드는 차트에서 노드와 간선을 삭제합니다.
2.8 벤 차트
CVennChart 클래스는 Venn 차트를 구성합니다.
SetCircleSizes () 메소드는 집합의 크기, SetCircleColors (), 색상, SetVennLegend () 해당 서명 및 SetIntersections () 교차의 크기를 결정합니다.
CVennChart chart;
chart.Attach(0, "test diagram");
//set the size
chart.SetSize(300,220);
//add sets(set their sizes)
chart.SetCircleSizes(100, 90, 80);
//color
chart.SetCircleColors(Yellow, Lime, Maroon);
//signatures
chart.SetVennLegend("EURUSD", "USDJPY", "EURJPY");
//dimensions of intersections
chart.SetIntersections(30,30,30,10);
//legend
chart.ShowLegend();
//title
chart.SetTitle("Venn", Green, 15);
//title
chart.GetChart();
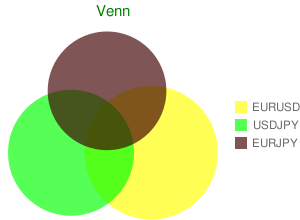
그림 11. 벤 차트
2.9 QR 코드
CQRCode 클래스를 사용하면 QR 코드를 만들 수 있습니다.
CQRCode chart;
chart.Attach(0, "test diagram");
//set the size
chart.SetSize(300,220);
//add data
chart.SetData("test data");
//set the level of error correction during coding
chart.SetErrCorrection(DIAGRAM_QRCODE_ERROR_CORRECTION_LOW);
//and the coding
chart.SetEncoding(DIAGRAM_QRCODE_ENCODING_UTF_8);
//title
chart.GetChart();

그림 11. QR 코드
SetData () 메소드는 코드가 생성될 데이터를 설정합니다. SetErrCorrection () 및 SetEncoding () 메소드는 코딩 및 코딩 중 오류 수정을 설정합니다.
2.10 지도 차트
CMapChart 클래스는 필요한 국가를 선택할 수있는 세계 또는 대륙의 지도를 만듭니다.
CMapChart chart;
chart.Attach(0, "test diagram");
//set the size
chart.SetSize(440,220);
//set the region
chart.SetZoomArea(DIAGRAM_MAP_AREA_AFRICA);
//and the country
chart.SetCountries("DZEGMGAOBWNGCFKECGCVSNDJTZGHMZZM");
//color
chart.SetColors(White, Red, Blue);
//color of the ocean - blue (2nd parameter)
chart.SetFill(Gray, Blue);
//title
chart.GetChart();
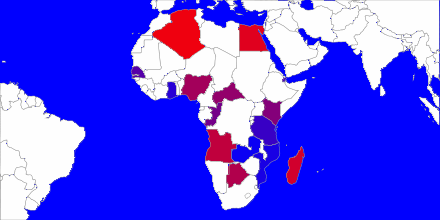
그림 11. 아프리카 지도
필요한 국가의 코드는 ISO 3166-1-alpha-2 형식의 SetCountries () 메소드로 전송됩니다. SetZoomArea() 는 지도의 대륙을 설정하고 SetColors() 는 국가의 색상을 설정합니다.
2.11 분산형 차트
CScatterChart 클래스는 분산형 차트를 구성합니다. CLineXYChart와의 유일한 차이점은 데이터가 지정되는 방식입니다.
여기서 데이터를 지정하기 위해 점의 좌표와 치수가 전송되는 AddLineScatter () 메소드를 사용합니다.
//create a class copy
CScatterChart chart;
//attach it to the object created earlier
chart.Attach(0, "test diagram");
//set the size
chart.SetSize(300,300);
//prepare the data
double Y2[10]={70, 5, 6, 8, 10, 20, 100, 130, 90, 60};
double X2[10]={1, 2, 3, 4, 5, 6, 7, 8, 9, 10};
double Z2[10]={90, 80, 75, 90, 10, 700, 80, 90, 90, 88};
double Y[10]={50, 40, 25, 35, 10, 50, 70, 40, 105, 80};
double X[10]={1, 2, 3, 4, 5, 6, 7, 8, 9, 10};
double Z[10]={60, 90, 90, 80, 70, 90, 73, 80, 77, 100};
//add the scatters
int first_line=chart.AddLineScatter(Y, X, Z, Red, 0, "scatters 1");
int second_line=chart.AddLineScatter(Y2, X2, Z2, Blue, 0, "scatters 2");
//major axis
chart.SetAxis(DIAGRAM_AXIS_BOTTOM|DIAGRAM_AXIS_LEFT, -1, 0, 0, 10, 0);
//grid
chart.SetGrid();
//legend
chart.ShowLegend(DIAGRAM_LEGEND_POSITION_BOTTOM_HORIZONTAL);
//title
chart.SetTitle("My Chart", Green, 15);
//filling the chart
chart.SetFill(Linen, Silver);
//obtain the chart
chart.GetChart();
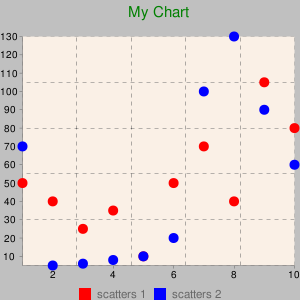
그림 11. 분산형 차트
결론
독자 여러분, 이 도서관이 트레이더로서의 어려운 삶을 덜어주기를 바랍니다. OOP를 사용하면 대규모 프로젝트 생성이 상당히 단순화되고 더 유연하고 사용자 친화적으로 만든다는 점을 덧붙이고 싶습니다.
행운을 빕니다.
첨부:
| № | 파일 이름 | 기술 |
|---|---|---|
| 1 | google_charts.mqh | MQL5에 위치한 라이브러리 \\ 포함 |
| 2 | google_charts_test.mq5 | MQL5 \\ 스크립트에 있는 테스트 스크립트 |
| 3 | google_charts_help.zip | Doxygen 생성 문서와 함께 라이브러리 클래스에 보관 |
| 4 | Libraries.zip | 라이브러리 및 해당 소스 코드와 함께 보관, MQL5\\Libraries (C++ Builder로 작성된 라이브러리)에서 압축 해제 |
MetaQuotes 소프트웨어 사를 통해 러시아어가 번역됨.
원본 기고글: https://www.mql5.com/ru/articles/114
경고: 이 자료들에 대한 모든 권한은 MetaQuotes(MetaQuotes Ltd.)에 있습니다. 이 자료들의 전부 또는 일부에 대한 복제 및 재출력은 금지됩니다.
이 글은 사이트 사용자가 작성했으며 개인의 견해를 반영합니다. Metaquotes Ltd는 제시된 정보의 정확성 또는 설명 된 솔루션, 전략 또는 권장 사항의 사용으로 인한 결과에 대해 책임을 지지 않습니다.
 Named Pipes를 사용하여 MetaTrader 5 터미널 간 통신을 위한 DLL없는 솔루션
 ORDER_MAGIC을 사용하여 단일 상품에서 여러 Expert Advisors와의 거래
 MQL5 객체 지향 프로그래밍 접근 방식을 사용한 Expert Advisor 작성하기
 인디케이터의 경제적 계산 원칙
차트를 웹....
몇 가지 지표가 있는
이 오류가 발생합니다.
이 라이브러리는 32비트용인 것으로 알고 있습니다. 이 라이브러리를 64비트용으로 만들어주세요.64비트 .DLL 버전은 어디에서 찾을 수 있나요? 2015.06.13 18:00:28.836 google_charts_test (EURUSD,M5) 'C:\사용자\관리자\앱데이터\로밍\MetaQuotes\터미널\D0E8209F77C8CF37AD8BF550E51FF075\MQL5\Libraries\ColorToText.dll' 2015.06.13 18:00:28.836 google_charts_test (EURUSD,M5) 'C:\사용자\관리자\앱데이터\로밍\MetaQuotes\Terminal\D0E8209F77C8CF37AD8BF550E51FF075\MQL5\Libraries\PNG_to_BMP.dll' 로드하지 못했습니다.
안녕하세요, 메타트레이더 5에서 구글 차트 API를 통해 분산형 차트를 볼 수 없는 방법을 알고 계신가요?
일부 국가에서는 정부가 방문을 차단했기 때문에 Google 차트 API를 통해 사용할 수 없습니다.
메타트레이더 5에서 분산형 차트를 볼 수 있는 편리한 방법이 있나요?