Gann Square Indicator MT4
- Indicateurs
- Eda Kaya
- Version: 1.3
Gann Square Indicator for MetaTrader 4
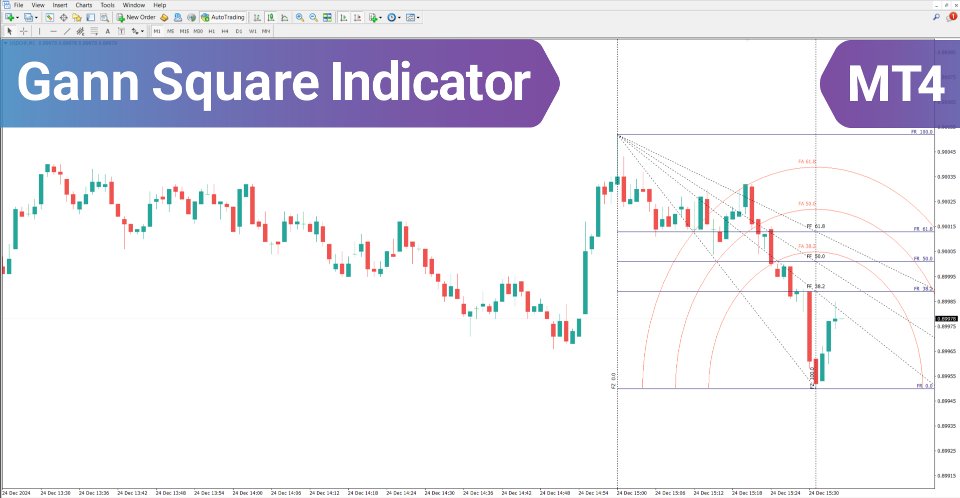
The Gann Square Indicator for MetaTrader 4 is a specialized charting tool rooted in the market theories of W.D. Gann. By applying the relationship between time and price, it helps traders identify turning points, major support and resistance levels, as well as overall trend formations.
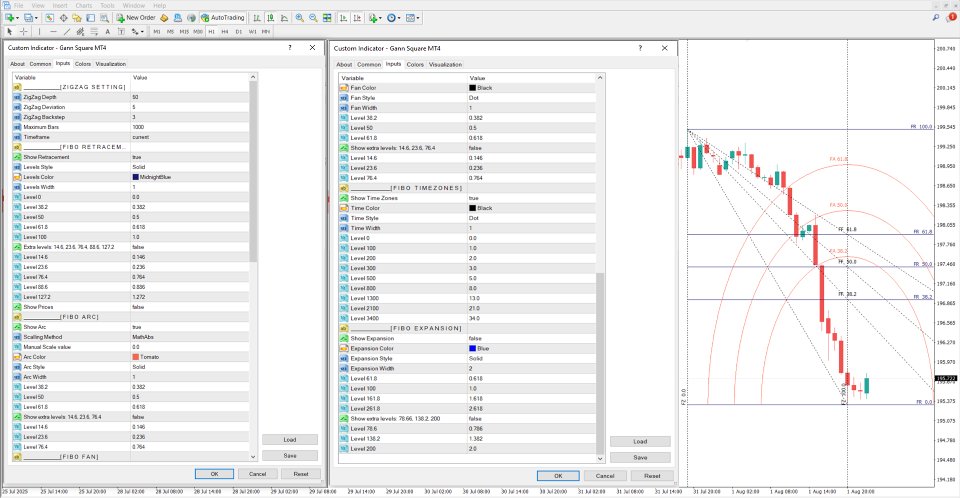
This indicator integrates multiple geometric and cyclical components — such as Gann Angles, the Gann Square, Gann Fan, and Time Arcs — each contributing to a detailed approach to market forecasting.
«Indicator Installation & User Guide»
MT4 Indicator Installation | Gann Square Indicator MT5 | ALL Products By TradingFinderLab | Best MT4 Indicator: Refined Order Block Indicator for MT4 | Best MT4 Utility: Trade Assistant Expert TF MT4 | TP & SL Tool: Risk Reward Ratio Calculator RRR MT4 | Prop Firm Protector: Prop Draw Down Protector Expert Advisor MT4 | Money Management: Easy Trade Manager MT4
Gann Square Indicator Table
| Category | Levels & Zones – Forecasting Tool – Signals |
| Platform | MetaTrader 4 |
| Skill Level | Intermediate |
| Indicator Type | Reversal – Breakout |
| Timeframe | Multi-Timeframe |
| Trading Style | Intraday Trading |
| Market Coverage | Forex, Stocks, Commodities, Indices |
Gann Square Indicator Overview
The Gann Square Indicator blends price movement with time cycles to determine strategic entry and exit zones. Its structure is based on three fundamental concepts:
- Balance of Time and Price – When both align at the same level, reversal probability becomes higher.
- Angle & Diagonal Line Analysis – A price interaction with significant Gann angles signals either trend continuation or a possible shift.
- Time-Price Confluence – Intersections of Gann fans, horizontal support/resistance, and vertical time lines often mark zones of strong price reaction.
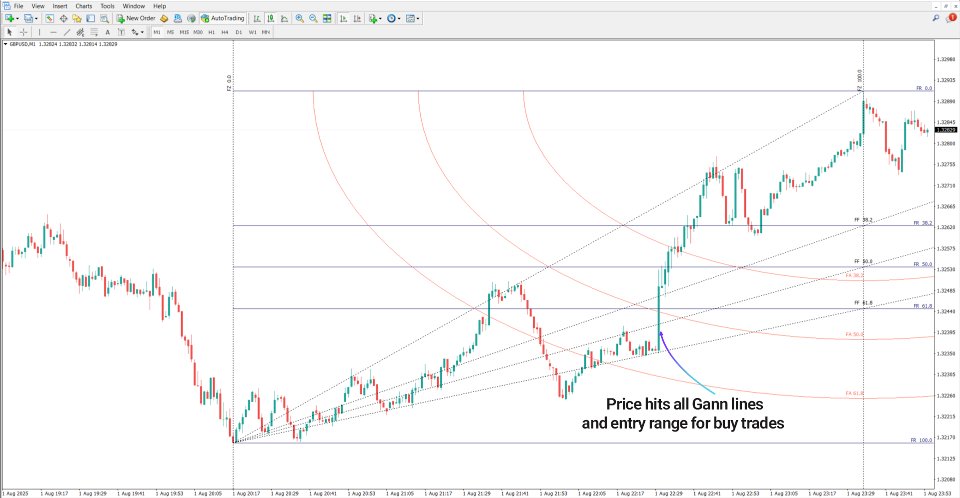
Indicator in an Uptrend
Example: GBP/USD on a 1-minute chart. When price remains above the 61.8% retracement level while breaking upward Gann angles (e.g., 50), it shows dominant buying strength. Additionally, overlaps between rising fan lines and time cycles confirm long entry signals.
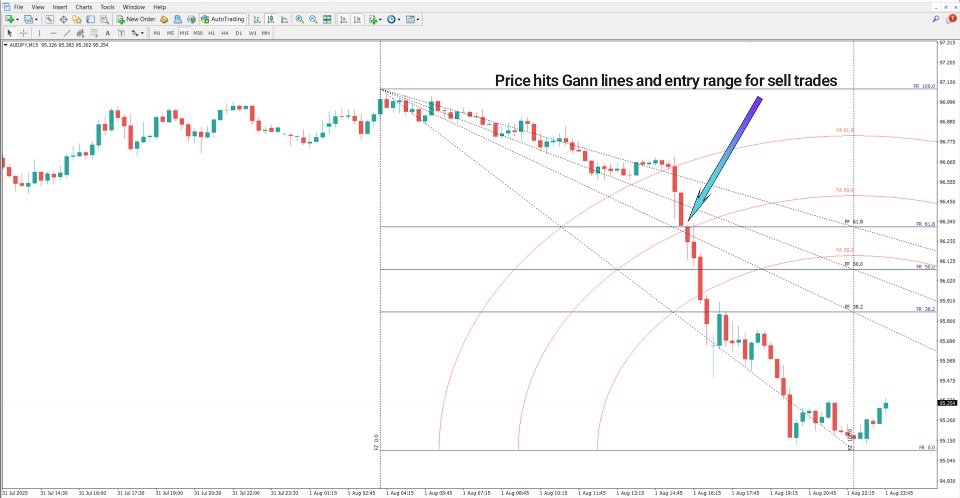
Indicator in a Downtrend
Example: AUD/JPY on a 15-minute chart. A break below the 61.8% retracement alongside lower Gann angles highlights heavy selling pressure. When this aligns with a price peak near a key time cycle or a bearish confluence of fan lines, the probability of extended downside increases.
Gann Square Indicator Settings
ZIGZAG PARAMETERS
- Depth: Adjusts sensitivity to swings
- Deviation: Minimum required move for a new leg
- Backstep: Filters false pivots
- Max Bars: Number of candles used
- Timeframe: Period applied
FIBONACCI RETRACEMENT
- Show Retracement, Style, Color, Width
- Levels: 0%, 38.2%, 50%, 61.8%, 100%
- Extra Levels: 14.6%, 23.6%, 76.4%, 88.6%, 127.2%
- Display Price Labels
FIBONACCI ARC
- Show Arcs, Scaling Method, Manual Scale
- Arc Line: Color, Style, Width
- Levels: 38.2%, 50%, 61.8%
- Extra Levels: 14.6%, 23.6%, 76.4%
FIBONACCI FAN
- Fan Color, Style, Width
- Levels: 38.2%, 50%, 61.8%
- Extra Levels: 14.6%, 23.6%, 76.4%
FIBONACCI TIME ZONES
- Show Zones, Line Style, Width, Color
- Levels: 0%, 100%, 200%, 300%, 500%, 800%, 1300%, 2100%, 3400%
FIBONACCI EXPANSION
- Show Expansions, Color, Style, Width
- Levels: 61.8%, 100%, 161.8%, 261.8%
- Extra Levels: 78.6%, 138.2%, 200%
Conclusion
The Gann Square Indicator for MetaTrader 4 is a sophisticated, multi-layered analysis tool combining geometry, price, and time cycles. By leveraging its components — Gann Angles, Gann Fan, Time Arcs, and Gann Square — traders gain deeper insights into reversal points, trend continuation zones, and critical price areas.
It provides not only historical context but also forward-looking signals, allowing traders to refine their strategies and improve decision-making for precise market entries and exits.
