Regardez les tutoriels vidéo de Market sur YouTube
Comment acheter un robot de trading ou un indicateur
Exécutez votre EA sur
hébergement virtuel
hébergement virtuel
Test un indicateur/robot de trading avant d'acheter
Vous voulez gagner de l'argent sur Market ?
Comment présenter un produit pour qu'il se vende bien
Indicateurs techniques pour MetaTrader 4 - 6
User Manual For more information pm me SL Currency28 Pair Dashboard is even used by the Banks to make profits. They take a strong currency and pitch against a weak currency This strategy i am made my other indicator SL Currency Strength Meter 28 Pair more improvement We can easily study the financial strength of multi-faceted trading SL Currency28 Pair Dashboard strength meter which creates multiple charts in a single window based on the price action of each currency in relation to

L'indicateur de tendance EZT vous montrera la tendance, le retrait et les opportunités d'entrée. Un filtrage optionnel et tous types d'alertes sont disponibles. Des alertes par e-mail et par notification push sont ajoutées. Nous développons également une évaluation environnementale basée sur cet indicateur, qui sera bientôt disponible.
Il s'agit d'un indicateur multifonctionnel composé de deux histogrammes de couleurs et d'une ligne. Il s'agit d'une représentation visuelle de la direction et d
Buy Sell Signal Low TF gives buy/sell signals and alerts with up and down arrow at potential reversal of a pullback or a trend continuation pattern in low timeframe. This is an indicator which gives signals based on trend => It works best in trend market with the principle is to ride on the trend not trade against the trend.
The components of Buy Sell Signal Low TF: - The trend is determined by SMMA 13 , SMMA 21 and SMMA 35 ( can be changed manually to suit your preference). - The signal is b
FREE
False Breakout MT4 est un indicateur conçu pour repérer les cas où le prix franchit brièvement un niveau récent de support ou de résistance, puis retourne rapidement dans sa fourchette précédente. Ces faux breakouts sont utiles pour l’analyse discrétionnaire ou les stratégies contrariennes, en fournissant des repères visuels sans émettre de signaux prédictifs automatiques. Fonctionnalités principales : Détection automatique des faux breakouts autour des plus hauts et plus bas récents (par ex. ni
FREE
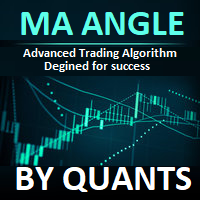
Quants, la pente moyenne mobile est un indicateur très puissant pour donner une indication directionnelle et un élan. L'indicateur ne repeint pas. Vous pouvez calculer efficacement l'angle ma et trouver la tendance.
Le décompte des bénéfices commence une fois la bougie de signal fermée. Ce sont donc des résultats exacts qui seraient en direct.
TimeFrame suggéré l'utilise sur H1. Toutes les options de l'indicateur sont modifiables.
Conseils : Tradez les directions de swing et de cassure de ten
FREE
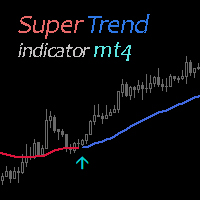
Super Trend Indicator uses two moving averages for calculating the trend direction. Combination with other market signals and analysis is necessary and provides more stable results. Indicator can be easily customized by the user including change of colors, with and arrow sizes.
FREE Super Trend Expert Advisor > https://www.mql5.com/en/market/product/81160?source=Site +Profile+Seller
FREE

Ants Lite ATR allows you to enter and manage your trades based on the market volatility, giving you safer entries and better exits. Based on the work by Daryl Guppy.
Features Ability to define the bar the Long and Short calculation starts from. Can be used to generate both entry or exit signals. Customizable ATR period and multiplier. GMMA is a tried and tested indicator with a long pedigree. Volatility based entry and exit signal rather than time based.
How To Use Simply drag the indicator fr

The indicator of the indicators. The Most Powerful Technique to Determine Forex Trend Strength in 2023. We have perfected Supreme Commander that it calculates an average of the selected indicators (up to 16) and the selected timeframe (all) with the result of a single trend that indicates the potential of buying and selling. It includes the following indicators:
Accelerator/Decelerator oscillator Average Directional Movement Index Awesome oscillator; Bulls and Bears Commodity Channel Index; De

Moyenne Mobile Adaptative AMD (AAMA)
AAMA est un indicateur de moyenne mobile adaptative pour MetaTrader 4 qui ajuste automatiquement sa réactivité selon les conditions du marché. Fonctionnalités principales : Moyenne mobile adaptative basée sur le ratio d’efficience de Kaufman – réagit rapidement en tendance, filtre le bruit en phase de range Détection automatique des 4 phases de marché AMD : Accumulation, Markup (hausse), Distribution, Markdown (baisse) Adaptation à la volatilité via l’ATR –

The Identify Trend indicator, using fairly simple but robust filtering methods (based on the moving median – algorithm XM ) and more complex algorithms (XC, XF, XS, four types of non-lagging moving averages SMAWL, EMAWL, SSMAWL, LWMAWL ) developed by the author , allows determined (1) the beginning of a true trend movement very precisely and, most importantly, with a small delay, and (2) identifying the flat. Such an indicator can be used for trading scalper strategies as well
FREE

Dual Timeframe VWAP Indicator for MT4
Description Professional VWAP indicator that displays both **Daily** and **Weekly** VWAP simultaneously on your chart.
Features: - Dual VWAP Lines: Blue for Daily, Red for Weekly - Configurable Bands: Two deviation bands for each timeframe - Session Control: Customizable trading hours for Daily VWAP - Clean Visuals: Solid lines for main VWAP, dashed for bands - Optimizable: Parameters can be optimized using Genetic Algorithm
Key Settings: - Enable/di

This is the best Support and Resistance Indicator on the market, and it shows both confirmed Support and Resistance as well as Retests. Support & Resistance: Support marks where buying demand halts price declines, acting as a safety net. Resistance caps price surges, driven by selling pressure. Traders leverage these levels to predict reversals, plan entries, exits, and manage risks, making them trading's fundamental guideposts. Join To Learn Market Depth - https://www.mql5.com/en/channels/suv
FREE

Fair Value Gap Finder detects fair value gaps and generates a signal when price returns to one. Set the minimum and maximum fvg size, customize the colors, style, and length, then let the indicator highlight them for you.
Key Features: Automatic FVG highlights - The indicator detects all fair value gaps that fit your criteria and marks them on the chart.
Entry Signal - A signal is created whenever price retests a fair value gap.
Notification - Alerts notify you when a fair value gap
FREE
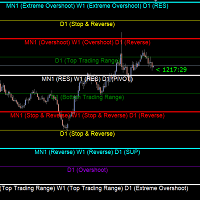
Gold Levels MTF - this is a fine stock technical indicator. The indicator algorithm analyzes the movement of the asset price, displays price levels of support and resistance from all time frames (TF) using the Murray method based on the Gann theory. The indicator indicates overbought and oversold fields, giving an idea of possible reversal points and at the same time giving some idea of the strength of the current trend. Description of levels: (Extreme Overshoot) - these levels are the ultimat
FREE

Are You Tired Of Getting Hunted By Spikes And Whipsaws?
Don't become a victim of the market's erratic moves.. Do Something About It!
Instantly make smarter decisions with Impulse Pro's precise balance of filters and accurate statistics.
Timing Is Everything In Trading
To learn more, please visit www.mql5.com/en/blogs/post/718212 Anticipate the next big move before it unfolds in 3 Simple Steps!
Advantages You Get
Early impulse detection algorithm.
Flexible combination to different trading s

Modification multidevises et multitemporelles de l'indicateur Moving Average (MA). Sur le tableau de bord, vous pouvez voir l'état actuel de l'indicateur - les cassures et les touches (par prix) du Fast MA et du Slow MA, ainsi que l'intersection des lignes MA entre elles (croisement de moyenne mobile). Dans les paramètres, vous pouvez spécifier les devises et les délais souhaités. En outre, l'indicateur peut envoyer des notifications sur le prix touchant les lignes et sur leur franchissement. E

The indicator displays peak levels of activity formed by the maximum volume, tracks the correlation of the candles on all timeframes (from the highest to the lowest one). Each volume level is a kind of key trading activity. The most important cluster is inside a month, week, day, hour, etc.
Indicator operation features A volume level receives Demand status if the nearest volume level located to the left and above has been broken upwards. A volume level receives Supply status if the nearest volu

It identifies the pivot, support, and resistance price levels of the selected timeframe and then draws lines onto the chart. FEATURES: Option to specify the Timeframe Period in the PivotSR calculation. Option to display the PivotSR of the last candle, of every candle, or of the current candle. Options for displaying labels, line thickness, and line color. PivotSR can be interpreted as reversal levels or past price reactions that can be used as the basis for current price analysis. Some traders b
FREE
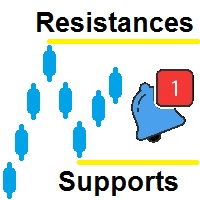
Supports et résistances, a été créé pour vous aider à identifier automatiquement les hauts et les bas sur plusieurs périodes différentes et ainsi tracer ces hauts et ces bas sur le graphique actuel. Passons à l'explication de la création des résistances Il y a un champ de règle, que vous pouvez définir ce qu'est un haut et un bas, la règle du haut est définie par défaut comme ceci : H[ 0 ]<=H[ 1 ] and H[ 1 ]=>H[ 2 ]
Où:
Élément Description H signifie haut
[0] signifie bougie actuelle [1
FREE

Панель предназначена для быстрого визуального нахождения и отображения пин-баров по всем периодам и на любых выбранных валютных парах одновременно. Цвет сигнальных кнопок, указывает на направление пин-бара. По клику на сигнальную кнопку, осуществляется открытие графика с данным паттерном. Отключить не используемые периоды, можно кликом по его заголовку. Имеется поиск в истории (по предыдущим барам). Прокрутка (scrolling) панели, осуществляется клавишами "UP" "DOWN" на клавиатуре. Имеется Push-ув

RSI divergence indicator finds divergences between price chart and RSI indicator and informs you with alerts (popup, mobile notification or email). Its main use is to find trend reversals in the chart. Always use the divergence indicators with other technical assets like support resistance zones, candlestick patterns and price action to have a higher possibility to find trend reversals. Three confirmation type for RSI divergences: RSI line cross 50 level (doesn't repaint) Price returns to
FREE

Contact me after payment to send you the User-Manual PDF File. Harmonic Trading The secret is the Fibonacci. It has been proven in the markets that price always reacts to Fibonacci levels. Fibonacci levels are one of the most important indicators of price changes. Sometimes the sequence of reactions to these levels in the chart make geometric shapes, which are called harmonic patterns. The price creates harmonic patterns with its fluctuation and reaction to Fibonacci levels. Harmonic patterns c

Shadow Zone Detector Shadow Zone Detector is a professional and advanced MT4/MT5 indicator designed to identify and visualize optimal premium and discount zones based on higher timeframe (HTF) candlestick shadows. Inspired by ICT (Inner Circle Trader) techniques, this tool allows traders to quickly spot high-probability areas for entries and exits with a clear, visual representation. Key Features: Premium & Discount Zones: Automatically detects the upper and lower wick zones of previous HTF cand

Title: Price Action Pro - Advanced Multi-Timeframe Reversal Scanner Product Overview: Price Action Pro is not just another candlestick pattern indicator. It is a complete trading system designed to detect high-probability reversal setups. Unlike standard indicators that spam signals on every pattern, Price Action Pro uses a Smart Swing Filter to ensure patterns are only detected at valid swing highs or lows. Combined with Multi-Timeframe (MTF) capabilities and Dynamic ATR Sizing , this tool adap

TrendlyOP – Professional Non-Repaint MT4 Indicator TrendlyOP is a professional-grade MT4 indicator built for traders who refuse repainting, delays, or unreliable signals. It delivers clear, real-time buy and sell signals you can trust—exactly when you need them. 100% Non-Repaint & No Recalculation TrendlyOP never repaints and never recalculates past signals.
Once a signal appears on your chart, it is locked forever.
No tricks. No hindsight. What you see is the real market behavior. True N
Special offer : ALL TOOLS , just $35 each! New tools will be $30 for the first week or the first 3 purchases ! Trading Tools Channel on MQL5 : Join my MQL5 channel to update the latest news from me Nous vous présentons le SuperTrend by Kivanc Ozbilgic with Scanner – un outil puissant et polyvalent conçu pour vous aider à anticiper les tendances du marché, avec des fonctionnalités personnalisables et des alertes en temps réel. Vous pouvez ajuster la méthode de calcul de l' ATR entr
FREE
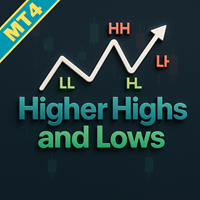
Améliorez votre trading d'action des prix avec l'indicateur Higher Highs and Lows MT4, un outil robuste qui exploite l'analyse fractale pour repérer les points de swing clés et identifier les patterns définissant les tendances comme Higher Highs (HH), Lower Highs (LH), Lower Lows (LL) et Higher Lows (HL) pour des insights clairs sur la direction du marché. S'inspirant des principes fondamentaux d'action des prix enracinés dans la Théorie de Dow du début des années 1900 et popularisés dans le tra
FREE

After purchase, contact me in private to get 7 days of FREE testing with EA Forex Proton where the robot automatically takes the trade alerts from MBFX Timing! MBFX Timing is an indicator that was developed and created by Mostafa Belkhayate, one of the best traders in the world. We decided to create a modified version that takes inspiration from the Stochastic Oscillator and the Relative Strength Quality Index indicators to improve your trading.
One of the main reasons we released MBFX Timing

"Dragon's Tail" is an integrated trading system, not just an indicator. This system analyzes each candle on a minute-by-minute basis, which is particularly effective in high market volatility conditions. The "Dragon's Tail" system identifies key market moments referred to as "bull and bear battles". Based on these "battles", the system gives trade direction recommendations. In the case of an arrow appearing on the chart, this signals the possibility of opening two trades in the indicated directi

L'indicateur Pips Chaser a été développé pour compléter votre trading manuel. Cet indicateur peut être utilisé à la fois pour le scalping court et le swing trading long // Version MT5
Caractéristiques Indicateur sans repeindre Cet indicateur ne change pas ses valeurs lorsque de nouvelles données arrivent Paires de trading Toute paire de devises Cadre temporel H1 est préférable, mais vous pouvez l'adapter à n'importe quel cadre temporel Temps de trading 24 heures sur 24 Buffers Buy Buffer:
FREE

CONCEPT DE SWING TRADE
À QUOI SERT-IL ?
Indicateur MT4 conçu pour le swing trading. Il détecte les renversements de tendance à l'aide de la logique SuperTrend et affiche les points TP avec des niveaux de Fibonacci automatiques.
COMMENT FONCTIONNE-T-IL ?
1. Suivi de tendance
Utilise un algorithme SuperTrend basé sur l'ATR. Il signale lorsque la tendance des prix s'inverse.
2. Génération de signaux
Renversement de tendance à la hausse → Boîte verte ACHETER + flèche (sous la bougie)
R
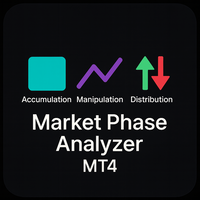
Description
Market Phase Analyzer est un indicateur avancé conçu pour identifier les trois principales phases du marché : Accumulation , Manipulation et Distribution .
Grâce à l’analyse automatique des sessions, l’indicateur trace la Asia Box , détecte les mouvements de sweep au-dessus ou en dessous des niveaux clés et confirme les retournements à l’aide du filtre ATR afin de réduire les faux signaux. Caractéristiques principales Mise en évidence de la session asiatique avec une boîte personnal
FREE
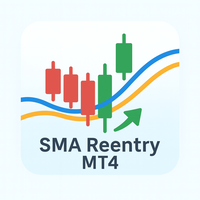
Description
SMA Reentry est un indicateur pour MetaTrader 4 conçu pour identifier les points de réentrée dans la tendance principale. Il utilise deux moyennes mobiles simples : une rapide pour capter les mouvements à court terme et une lente pour filtrer la direction générale du marché. Un signal d’achat apparaît lorsque la moyenne rapide est au-dessus de la moyenne lente et que le prix repasse au-dessus de la moyenne rapide après avoir été en dessous à la bougie précédente. Un signal de vente
FREE

Lion Arrow Super Arrow Indicator for MetaTrader 4
The Lion Arrow Super Arrow Indicator for MetaTrader 4 is a hybrid technical analysis system designed to deliver accurate trading signals by combining multiple advanced indicators. By analyzing trend direction, market momentum, and buying/selling pressure simultaneously, this indicator helps traders identify high-probability trade opportunities while minimizing false signals. Core Components of the Indicator
The Lion Arrow Super Arrow indicat
FREE

Ou M Oving A S upport R MOYENNE Bandes ésistance.
L'indicateur de bandes MASR est une moyenne mobile entourée de deux bandes qui fonctionnent ensemble comme niveaux de support et de résistance. Statistiquement, les bandes MASR contiennent des bougies de prix 93% du temps. Voici comment il est calculé par étapes : 1. La première étape consiste à calculer le plus haut (HHV) et le plus bas (LLV) pour une période de temps X.
2. La deuxième étape consiste à diviser HHV par LLV pour obtenir la larg

Histogramme Multi-Temps de l’Offre et de la Demande (Multi-Timeframe Supply Demand Histogram)
Description :
L’Histogramme Multi-Temps de l’Offre et de la Demande est un indicateur puissant et clair qui montre la force de la demande et de l’offre sur plusieurs unités de temps, spécifiquement H4 et D1. Il affiche des histogrammes mettant en évidence quand les acheteurs ou les vendeurs dominent, permettant aux traders d’identifier rapidement les zones de pression clés sur le marché. Fonctionnalit
FREE

The ADX Dashboard V11.03 is a professional MT4 indicator designed to provide traders with an intuitive visual overview of trend strength and market sentiment across multiple timeframes. It integrates ADX (Average Directional Index) and RSI (Relative Strength Index) indicators, presenting key data in a concise dashboard to help traders make quick and informed trading decisions without complex analysis of individual indicator charts. First, the installation process is straightforward. Copy the co

Stochastic Candles Indicator It will convert the stochastic indicator from separate window to the chart window by drawing oversold-overbought coloring candles. Red is overbought and blue is oversold by default.And you can change the color later on the external indicator setting.This is Multi timeframe indicator that means it can show appearance result from another timeframe.E.g: If you set timeframe H1 then it will draw candles from Timeframe H1 whatever timeframe you attach on. It will be us

FutureForecast is one of the few indicators looking into the future, or rather calculating the current candle's High and Low price values.
Advantages of the indicator no repainting works on any timeframes works with any trading instruments perfectly suitable for scalping and trading binary options
Parameters alert - enable/disable alerts about signals. Enabled by default.
Parameters (Colors) FutureHigh - estimated High price line color. FutureLow - estimated Low price line color.
Recommendat
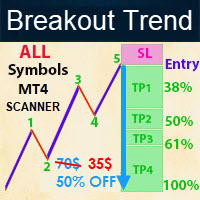
- Real price is 70$ - 50% Discount (It is 35$ now) Contact me for instruction, any questions! - Lifetime update free - Non-repaint - I just sell my products in Elif Kaya Profile, any other websites are stolen old versions, So no any new updates or support. Introduction Breakout Trend Scanner indicator works based on the Elliott Wave in technical analysis describes price movements in the financial market that are related to changes in trader sentiment and psychology and finds end of movement and

Huge 70% Halloween Sale for 24 hours only!
This indicator is unstoppable when combined with our other indicator called Support & Resistance . After purchase, send us a message and you will get it for FREE as a BONUS! Introducing Trend Punch , the revolutionary forex trend indicator that will transform the way you trade! Trend Punch is uniquely designed to provide precise buy and sell arrows during strong market trends, making your trading decisions clearer and more confident. Whether you

L'indicateur de base de l'offre et de la demande est un outil puissant conçu pour améliorer votre analyse du marché et vous aider à identifier les zones clés d'opportunité sur n'importe quel graphique. Avec une interface intuitive et facile à utiliser, cet indicateur Metatrader gratuit vous donne une vision claire des zones d'offre et de demande, vous permettant de prendre des décisions de trading plus informées et plus précises / Version MT5 gratuite Scanner du tableau de bord pour cet indicate
FREE

Cet indicateur est utilisé pour afficher les lieux de Flat et de tendance. La conception est basée sur l'oscillateur. Il est utilisé comme filtre supplémentaire, à la fois pour le commerce sur un graphique normal et pour les options binaires. Les places plates sont utilisées dans l'indicateur UPD1 volume Cluster pour le commerce conformément au concept Smart Money. L'alerte intégrée signale les endroits les plus surachat/survente.
Conditions d'entrée.
Paramètres de base. Bars Count - spécifie
FREE
It is a tool for technical analysis. It allows you to make measurements: Fibo, including the search for clusters Fibo levels (by the DiNapoli method) Overbalance Trend line Selecting S/D levels
Input parameters Trend_Color - color of the trend line Trend_Width - width of the trend line Trend_info - if true, along with the trend line additional information is displayed (low, high, medium of the trend line) Trend_info_color_up_dn - color of the text describing the trend line Trend_info_font_up_dn

Volume Profile Order Blocks - A smarter way to visualize liquidity, volume, and key levels. Volume Profile Order Blocks is a cutting-edge indicator that enhances traditional order block strategies by embedding a detailed volume profile directly within each zone. This provides traders with a clear, data-driven view of where institutional interest may lie — not just in price, but in volume distribution. MT5 Version - https://www.mql5.com/en/market/product/146215/ Join To Learn Market Depth
SR PrevPeriods MT4 Aperçu
SR PrevPeriods trace en temps réel les plus hauts et plus bas du jour précédent, de la semaine précédente et du mois précédent directement sur le graphique MetaTrader 4. C’est un indicateur léger, conçu pour mettre en évidence les zones historiques de support et de résistance qui coïncident souvent avec des zones de réaction du prix, des cassures ou des zones de rééquilibrage. Fonctionnalités
Trace des lignes horizontales sur les niveaux clés précédents et, si souhait
FREE

Ever wondered why standard ADX is made unsigned and what if it would be kept signed? This indicator gives the answer, which allows you to trade more efficient. This indicator calculates ADX values using standard formulae, but excludes operation of taking the module of ADX values, which is forcedly added into ADX for some reason. In other words, the indicator preserves natural signs of ADX values, which makes it more consistent, easy to use, and gives signals earlier than standard ADX. Strictly s

Trend Dot Indicator
– Clean & Powerful Reversal System A fast-reacting Trend Step Regression (TSR) line with color-coded dots instantly shows the current trend. High-probability BUY/SELL signals appear only when a real reversal occurs, confirmed by minimum trend length and ADX strength. Description here: https://www.mql5.com/en/blogs/post/765867 Features: Clear visual TSR line + dots (blue = up, red = down) Filtered reversal signals with text labels Real-time volume pressure dashboard (Buy/S

It works based on the Stochastic Indicator algorithm. Very useful for trading with high-low or OverSold/Overbought swing strategies. StochSignal will show a buy arrow if the two lines have crossed in the OverSold area and sell arrows if the two lines have crossed in the Overbought area. You can put the Stochastic Indicator on the chart with the same parameters as this StochSignal Indicator to understand more clearly how it works. This indicator is equipped with the following parameters: Inputs d
FREE

First time on MetaTrader, introducing IQ Star Lines - an original Vedic Astrology based indicator. "Millionaires don't use astrology, billionaires do" . - J.P. Morgan, Legendary American financier and banker.
IQ Star Lines, an unique astrological indicator purely based on Vedic astrology calculations, published for the first time on Metatrader. This unique tool plots dynamic planetary grid lines based on real-time stars, constellations, and celestial movements, which allows you to plot t

BeST_Darvas Boxes is an MT4 Indicator based on the trading method developed in the 50’s by the Hungarian Nicolas Darvas . BeST_Darvas Boxes indicator draws the Top and the Bottom of every Darvas Box that can be confirmed on the current Chart. draws Buy and Sell Arrows for every confirmed Upwards or Downwards Breakout of the above levels. draws always only after the bar closing and so is non-repainting or backpainting .
Note : Every customer who wants to have the older version v_1.75 with th

Free Market structure zig zag to assist in price action trading the screenshots describe how to use and how to spot patterns new version comes with alerts, email alert and push notification alert can be used on all pairs can be used on all timeframes you can add additional confirmation indicators the indicator shows you your higher high and low highs as well as your lower lows and lower highs the indication makes price action analysis easier to spot.
FREE
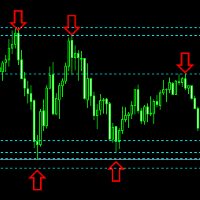
.....................................hi....................... ................for showing high s and low s and support and resistanses .....................we have a lot of ways............................... it can be helpful for finding trends , higher highs , higher lows , lower highs , lower lows
.......................today i write on of thems.......................... ........................you can enter the number of last support and resistanses .........................and it will dra
FREE

Le tableau de bord d'alerte RSI / TDI vous permet de surveiller les RSI à la fois (sélectionnables par vous) sur chaque paire majeure que vous négociez.
Vous pouvez l'utiliser de deux manières :
1. Sélectionnez plusieurs périodes et le tiret vous montrera quand il y a plusieurs périodes prolongées au-delà des conditions commerciales normales. Un excellent indicateur que le prix a poussé fort récemment, car il a atteint un niveau de surachat ou de survente sur plusieurs périodes, de sorte qu'

Smart Volume Box is designed to give MetaTrader users a powerful, analytical tool for uncovering the hidden dynamics in the market. This precision-built tool, complete with user-friendly settings, integrates essential volume insights and advanced features like Volume Profile, VWAP (Volume Weighted Average Price), and Point of Control (POC) levels. Unlike typical indicators, Smart Volume Box doesn’t provide specific trade signals but instead offers a clearer perspective on market trends, making

Venom Trend Pro — Outil d'Analyse de Tendance Multi-Temporalité Venom Trend Pro est un indicateur de suivi de tendance et de trading swing conçu pour aider à identifier des mouvements directionnels clairs sur n'importe quelle paire et n'importe quelle unité de temps. Il fonctionne bien pour les configurations intrajournalières et swing sur le Forex, l'or, les crypto-monnaies, les indices et plus encore. L'indicateur analyse la structure des prix récents et le momentum pour détecter les tendances
FREE

Special offer in honor of the New Year and Christmas!! https://www.mql5.com/ru/users/bossik2810 System Trend Pro - This is the best trend trading indicator!!! The indicator no repaint!!! The indicator has MTF mode, which adds confidence to trading on the trend ( no repaint ).
How to trade? Everything is very simple, we wait for the first signal (big arrow), then wait for the second signal (small arrow) and enter the market in the direction of the arrow.
(See screens 1 and 2.) Exit on

MACD Intraday Trend est un indicateur développé à partir d'une adaptation du MACD original créé par Gerald Appel dans les années 1960. Au cours des années de trading, il a été observé qu'en modifiant les paramètres du MACD avec les proportions de Fibonacci, nous obtenons une meilleure présentation de la continuité des mouvements de tendance, ce qui permet de détecter plus efficacement le début et la fin d'une tendance de prix. En raison de son efficacité à détecter les tendances des prix, il est
FREE
Special offer : ALL TOOLS , just $35 each! New tools will be $30 for the first week or the first 3 purchases ! Trading Tools Channel on MQL5 : Join my MQL5 channel to update the latest news from me Vue d’ensemble
OA SnR Power est un outil puissant conçu pour aider les traders à identifier et évaluer la force des niveaux de support et de résistance. En intégrant des facteurs clés tels que le volume de trading, la fréquence des rebonds et le nombre de retests, cet indicateur offre u
FREE

Cet indicateur d'information sera utile pour ceux qui veulent toujours être au courant de la situation actuelle du compte. L'indicateur affiche des données telles que le profit en points, en pourcentage et en devise, ainsi que le spread pour la paire actuelle et le temps jusqu'à la fermeture de la barre sur la période actuelle. VERSIONMT5 - Des indicateurs plus utiles
Il existe plusieurs options pour placer la ligne d'information sur le graphique : À droite du prix (passe derrière le prix) ;
FREE

Smart Reversal Signal is a professional indicator for the MetaTrader 4 platform; it has been developed by a group of professional traders. This indicator is designed for Forex and binary options trading. By purchasing this indicator, you will receive: Excellent indicator signals. Free product support. Regular updates. Various notification options: alert, push, emails. You can use it on any financial instrument (Forex, CFD, options) and timeframe.
Indicator Parameters Perod - indicator calculat

The indicator finds candlestick patterns based on Gregory L.' Morris "Candlestick Charting Explained: Timeless Techniques for Trading Stocks and Futures". If a pattern is detected, the indicator displays a message at a bar closure. If you trade using the MetaTrader 5 terminal, then you can download the full analogue of the " Candle Pattern Finder for MT5 " indicator It recognizes the following patterns: Bullish/Bearish (possible settings in brackets) : Hammer / Shooting Star (with or without con

MACD divergence indicator finds divergences between price chart and MACD indicator and informs you with alerts (popup, mobile notification or email). Its main use is to find trend reversals in the chart. Always use the divergence indicators with other technical assets like support resistance zones, candlestick patterns and price action to have a higher possibility to find trend reversals. Three confirmation type for MACD divergences: MACD line cross zero level Price returns to previous H/L Creat
FREE

The Supply and Demand Zone Indicator is a powerful and easy-to-use tool designed to help traders identify critical supply and demand zones on the chart. These zones can provide valuable insight into potential market reversals, breakouts, and important price levels where buyers or sellers are likely to take control. The best FREE Trade Manager . If you want to create your own Hedging or Grid strategies without any coding make sure to check out the ManHedger Key Features: Automatic Zone Detect
FREE
FX Dynamic : Suivez la volatilité et les tendances grâce à une analyse ATR personnalisable Vue d’ensemble
FX Dynamic est un outil performant s’appuyant sur les calculs de l’Average True Range (ATR) pour fournir aux traders des informations incomparables sur la volatilité quotidienne et intrajournalière. En définissant des seuils de volatilité clairs — par exemple 80 %, 100 % et 130 % — vous pouvez rapidement repérer des opportunités de profit ou recevoir des avertissements lorsque le marché dé

Il s'agit d'un produit gratuit que vous êtes libre d'utiliser pour vos besoins !
J'apprécie également beaucoup vos commentaires positifs ! Merci beaucoup !
Cliquez ici pour découvrir des robots de trading et des indicateurs de haute qualité !
Indicateur Crypto_Forex : Bougies Heiken Ashi pour MT4. Pas de repeinture. - Heiken_Ashi_Candles a une excellente combinaison avec l'indicateur Trend Line MA tel qu'il est sur la photo. - L'indicateur Heiken_Ashi_Candles est un indicateur auxiliaire trè
FREE

Was: $99 Now: $49
Blahtech Daily Range indicator displays the average daily range alongside the individual session ranges. Using the daily open price as a reference the indicator shows fixed range and dynamic range targets as lines on the charts. These lines clearly show when the average range has been exhausted. Daily and session ranges can be useful for confirming entries or setting targets and is an excellent odds enhancer for many trading systems. Links [ Documentation | Install
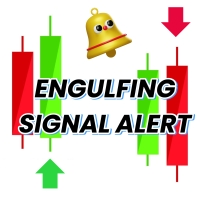
Engulfing Candle Signal Alert: Elevate Your Trading Strategy Unlock the full potential of your trading with the Engulfing Candle Signal Alert, the ultimate tool for identifying market reversals and enhancing your trading precision. Designed specifically for traders who value accuracy and timely alerts, this powerful indicator detects engulfing candle patterns, a key signal in technical analysis that often indicates a potential shift in market direction. What is an Engulfing Candle? An engu
FREE

Free automatic Fibonacci is an indicator that automatically plots a Fibonacci retracement based on the number of bars you select on the BarsToScan setting in the indicator. The Fibonacci is automatically updated in real time as new highest and lowest values appears amongst the selected bars. You can select which level values to be displayed in the indicator settings. You can also select the color of the levels thus enabling the trader to be able to attach the indicator several times with differe
FREE

Indicateur de projection graphique La projection graphique a commencé comme un petit indicateur qui utilisait l'indicateur technique en zigzag intégré pour prévoir l'action future des prix (vous pouvez trouver l'ancien algorithme dans les commentaires)
L'idée est simple, l'action passée des prix ne se traduit pas dans le futur, mais peut-être que si nous ne devenons pas trop spécifiques ou trop génériques, nous pouvons extraire des lignes directrices sur ce qui pourrait arriver.
La "thèse" de
FREE
Le MetaTrader Market est le meilleur endroit pour vendre des robots de trading et des indicateurs techniques.
Il vous suffit de développer une application pour la plateforme MetaTrader avec un design attrayant et une bonne description. Nous vous expliquerons comment publier votre produit sur Market pour le proposer à des millions d'utilisateurs de MetaTrader.
Vous manquez des opportunités de trading :
- Applications de trading gratuites
- Plus de 8 000 signaux à copier
- Actualités économiques pour explorer les marchés financiers
Inscription
Se connecter
Si vous n'avez pas de compte, veuillez vous inscrire
Autorisez l'utilisation de cookies pour vous connecter au site Web MQL5.com.
Veuillez activer les paramètres nécessaires dans votre navigateur, sinon vous ne pourrez pas vous connecter.