Regardez les tutoriels vidéo de Market sur YouTube
Comment acheter un robot de trading ou un indicateur
Exécutez votre EA sur
hébergement virtuel
hébergement virtuel
Test un indicateur/robot de trading avant d'acheter
Vous voulez gagner de l'argent sur Market ?
Comment présenter un produit pour qu'il se vende bien
Indicateurs techniques pour MetaTrader 4 - 22
ChartFix – Fixed Scale and Pan Chart Controls for MT4 ChartFix is a lightweight indicator that adds convenient on-chart navigation tools to MetaTrader 4. The controls are designed to offer a chart interaction style that creates an optional switch between MT4 default auto scale feature and a fixed scale chart that can be moved up and down and easily scaled vertically. Main Functions Zoom In / Zoom Out – Adjust the chart scale directly from on-screen buttons. Scale Mode Switch – Toggle between MT4

Th indicator is a technical analysis tool that helps identify significant changes in price trends and filter out minor price fluctuations. It is used to highlight price swings and provide a clearer picture of market movements. The Pivots are found by checking if a certain candle is the highest/lowest in a given number of candles that come before and after it. This indicator has only one input, its period. The Higher the period, the more strict the indicator is about what constitutes a Pivot. Th
FREE

This indicators automatically draws the support and resistances levels (key levels) for you once you've dropped it on a chart. It reduces the hustle of drawing and redrawing these levels every time you analyse prices on a chart. With it, all you have to do is drop it on a chart, adjust the settings to your liking and let the indicator do the rest.
But wait, it gets better; the indicator is absolutely free! For more information: https://youtu.be/rTxbPOBu3nY For more free stuff visit: https:
FREE

RaysFX Supertrend + Alert RaysFX Supertrend è un indicatore di tendenza superiore progettato per i trader che desiderano avere un vantaggio nel mercato. Questo indicatore utilizza una combinazione di CCI (Commodity Channel Index) e ATR (Average True Range) per identificare le tendenze del mercato e fornire segnali di trading accurati. Caratteristiche principali Indicatori CCI e ATR: Utilizza due degli indicatori più popolari e affidabili per identificare le tendenze del mercato e generare segnal
FREE

This indicator calculates Correlation among currency pairs (Selected by user) to find the least and/or most correlated symbols in real time. Correlation ranges from -100% to +100%, where -100% represents currencies moving in opposite directions (negative correlation) and +100% represents currencies moving in the same direction.
Note The Correlation more than 80 (Adjustable) between two currency pairs, Shows that they are quite similar in the kind of movement and side. The Correlation less than

Download directly the indicator file here. (if you can't open on MT4) MACD Indicator is one of the most popular momentum indicators among users. Searching and detecting MACD signals by the eye may not be easy. Scan Full Charts Dashboard Indicator with simple user interface and search customization panel saves time and scans all charts for MACD signals search and notifies the user with high accuracy. After finding the signal, the user was aware of the result by alerts and notifications. This ind
FREE

BB-Sub – Bandes de Bollinger en sous-fenêtre BB-Sub est un indicateur simple mais puissant qui affiche les bandes de Bollinger indépendamment dans une sous-fenêtre du graphique. Contrairement aux bandes de Bollinger classiques qui s’affichent sur le graphique principal, BB-Sub fonctionne dans une fenêtre séparée. Cela évite tout chevauchement avec les chandeliers ou d'autres indicateurs, idéal pour les traders qui souhaitent se concentrer uniquement sur le mouvement et la forme des bandes. Princ
FREE

This is the Indicator is free to use and based on my "TheTurtleTrader" EA. Introducing the Turtle Traders Donchian Channel Indicator – inspired by an advanced trading system by the legendary Turtle Traders of the early 1980s, designed to bring authentic and diverse strategies to your trading portfolio.
Core Strategy:
This Indicator leverages a proven breakout strategy by displaying the highest high or lowest low over a defined period. Whether you prefer quick scalping trades or long holdin
FREE

Get ready to transform your trading with Absolute Edge Reversal ! This smart indicator is your new secret weapon for spotting high-probability entry and exit points right on your chart. Forget complex, cluttered analysis—we cut straight to the signal so you can act fast and trade with confidence. Why You Need Absolute Edge Reversal Absolute Edge Reversal isn't just another signal line; it's a dynamic momentum system designed for precision. It combines multiple strength calculations with trend f
FREE

The parabolic stop and reverse (PSAR) indicator was developed by J. Welles Wilder, Jr. as a tool to find price reversals which can be utilized as stop-loss levels as well as trade triggers. The notable difference about the PSAR indicator is the utilization of time decay. The PSAR indicator forms a parabola composed of small dots that are either above or below the trading price. When the parabola is below the stock price, it acts as a support and trail-stop area, while indicating bullish up t
FREE

Features:
- Current TF GMMA Cross and Trend (Mandatory Check.. G-Up/G-Down) - HTF GMMA Trend Check (Optional.. slanting arrow) - TDI or NRTR Trend Check (Optional.. diamond)
Read post for detailed description and downloading extra indicators: https://www.mql5.com/en/blogs/post/758264
Scanner:
This is a Dashboard Scanner for finding good trades using the GMMA method as base and TDI method for trend verification. All buttons for all Pairs and Timeframes are clickable and will change the chart f
Il s'agit d'un produit gratuit que vous êtes libre d'utiliser pour vos besoins !
J'apprécie également beaucoup vos commentaires positifs ! Merci beaucoup !
Cliquez ici pour découvrir des robots de trading et des indicateurs de haute qualité !
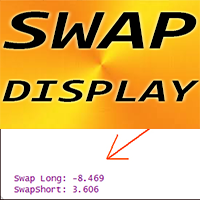
Affichage SWAP de l'indicateur Forex pour MT4, excellent outil de trading auxiliaire.
- L'indicateur SWAP Display affiche les SWAP actuels pour les transactions longues et courtes de la paire de devises à laquelle il est attaché. - Il est possible de l
FREE

** All Symbols x All Timeframes scan just by pressing scanner button ** *** Contact me to send you instruction and add you in "ABCD scanner group" for sharing or seeing experiences with other users. Introduction This indicator scans AB=CD retracement patterns in all charts. The ABCD is the basic foundation for all harmonic patterns and highly repetitive with a high success rate . The ABCD Scanner indicator is a scanner reversal ABCD pattern that helps you identify when the price is about to ch

Dominate the Market with Reversal Dominator! Tired of chasing trends only to get caught in a sudden reversal? Reversal Dominator is your ultimate weapon for spotting high-probability market turns before they become obvious. This powerful indicator leverages a sophisticated Absolute Strength calculation, paired with an intelligent moving average filter, to give you the precise edge needed to enter or exit trades with confidence. Why Choose Reversal Dominator? Pinpoint Reversals: Never miss a cr
FREE

This indicator shows the breakeven line level for the total number of open positions of the current symbol with P/L value and total volume. This indicator is helpful to decide the exit level when using a trading grid strategy. The style of the breakeven line is customizable to choose the color, line shape and font size of the positions description. Send mobile notification when crossing a positive P/L target
FREE

CPR Pivot Lines It Will Draw Pivot Point R1,R2,R3 S1,S2,S3 Tc Bc Best Part Is That You Can Even Add Values Of High,Low,Close Manually Also To Get Your All Levels On Chart. So If Your Broker Data Of High ,Low ,Close Is Incorrect Then You Don’t Have To Depend On Them Anymore. You Can Even Modify All Lines Style. It Will Show Line In Floating Style And Not Continues Mess.
FREE

The "MACD Trend Follower" is an indicator based on the MACD oscillator. It serves to spot the trend direction by giving it a fixed color until the trend changes (the trend direction colors are customizable). The default MACD settings for the indicator has been changed to adapt to the fast moving Forex market, but they can be changed to suit the trader.
Recommended settings for the indicator : - MACD Fast EMA : 8 Periods. - MACD Slow EMA : 13 Periods. - MACD SMA : 5 Periods.
Indicator inputs :
FREE

What is a Point of Interest? Traders who follow Smart Money Concepts may call this a Liquidity Point, or where areas of liquidity have been built up by retail traders for for Big Banks to target to create large price movements in the market. As we all know, retail traders that use outdated and unreliable methods of trading like using trendlines, support and resistance, RSI, MACD, and many others to place trades and put their stop losses at keys points in the market. The "Big Banks" know these me

Heiken Ashi Toggle – Instant Chart Mode Control for MT4 Heiken Ashi Toggle (Also spelled Heikin Ashi) is a small utility indicator for MetaTrader 4 that provides Heiken Ashi candles — with one key upgrade: instant ON/OFF control directly from the chart . Instead of constantly adding, removing, or reloading indicators, this tool allows traders to switch between standard candlesticks and Heiken Ashi visualization with a single click. What This Indicator Does Displays classic Heiken Ashi candles
FREE

Renko Charts with Heiken Ashi Filter now have the alerts and the Win-rate . Now you can know which signal will give you that edge your trading needs. Risk to Reward Settings Wins versus Losses Count There are four alert types to choose from for notification on screen, email or phone notification. The alert types also have buffers for use with automation. This indicator can be incorporated with any system that requires renko charts. The four (4) alert types are: Three-bar Formation ; Pinbar

Unlock Smarter Trading with the Bands Breakout! Are you tired of confusing charts and missed opportunities? Get clear, high-probability entry and exit signals right on your chart with the Bands Breakout indicator! This isn't just another indicator; it's a complete, trend-aware system designed to simplify your trading decisions and focus only on the best moves. Our unique engine combines the momentum power of the EMA 10 with the volatility framework of the Bollinger Bands to find definitive buy
FREE

Master Candle (MC) Indicator automatically detects "Master Candles", also known as "Mother Candles", i.e. candle that engulf several candles that follow them. See screenshots. You can choose how many candles Master Candle should engulf. By default it is set to 4. Feel free to change colour and thickness of lines as it suites you.
I find this indicator to be very useful to identify congestions and breakouts, especially on 60 minutes charts. Usually if you see candle closing above or below "Maste
FREE

FZR indicator determines fractal zigzag reversal pattern of all the time frames of the chosen symbol and shows the information in the Info label. Indicator draws the detected pattern in the chosen time frame and also you can select in the menu to draw the trend line according to FZR peaks. What it is FZR? See the first picture in the screenshots. As you can see for every peak of FZR the AO indicator must cross zero line. FZR indicator determines the trend direction.
How to use FZR for trading?
FREE
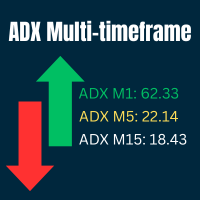
Ultimate ADX Multi-timeframe Indicator Free for limited time.
This indicator provides real-time ADX values for multiple timeframes in one unobtrusive label panel. It i s especially useful for gauging trend strength across timeframes without constantly switching charts. Choose which periods to display, anchor the panel to any chart corner, and color-code ADX strength levels to your taste. Key Features & Personalization Multi-Timeframe ADX - Toggle visibility for 9 built-in periods (M1, M5, M15,
FREE

4 trendlines are given by 2 timeframes, defined by the zigzag indicator. It leverages the Zig Zag indicator to identify significant highs and lows across two configurable timeframes (default: M15 for short-term and H1 for medium-term), automatically plotting upward and downward trendlines for each. This helps visualize trend structures, reversals, and alignments between timeframes without switching charts, while adhering to trendline rules that contain the high and low points of the previous two
FREE

This indicator is an addition to "Trend Edges."
The "Trend Edges histogram" indicator determines whether the trend is rising or falling. It is suitable for any time frame (tested on DAX).
Find a trending pair, index or CFD. Additionally :
-Sound alert on trend change.
-Alert Notification
-Alert Notification on your mobile phone Check my other indicators.
FREE

ATR Volatility plots the ATR-based volatility, and triggers alerts when it crosses user-defined upper and lower thresholds (purple and tan lines, please see screenshots). Circles are painted when ATR volatility crosses either above the upper threshold, or below the lower threshold. This is a small tool custom-built by our group, by specific request of one of our customers. We hope you enjoy! Do you have an indicator you would like to see designed? Feel free to send us a message! Click here for m
FREE

Advanced Renko & Point & Figure Indicator with Win/Loss Pattern Analysis This powerful indicator combines two proven strategies—Renko and Point & Figure (P&F)—into one comprehensive tool for trend identification, pattern recognition, and risk management. With dynamic Box Size calculation (Fixed or ATR-based), moving average filters, and win/loss pattern detection, traders can make smarter, data-driven decisions.
Key Features
Hybrid Renko + P&F System Renko: Noise-free price action with fixed
FREE

Are you tired of having many open charts and watching many different currency pairs? MCTSI will monitor the strengths of 56 currency pairs and show you the best pairs to trade, no more guessing which currency is stronger/weaker, no more trading a pair that is not moving positively. This is the BASIC version. MCTSIP is the more advanced version and can be found here: https://www.mql5.com/en/market/product/20994 You may have many charts open trying to determine the best currency pair to trade on
FREE
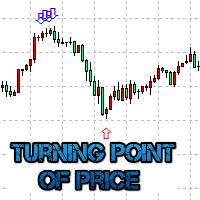
The Turning point of price indicator displays assumed turning points of the price on the chart. It is based on data of the Prise Reversal oscillator and standard ADX. When the value of Prise Reversal is in overbought or oversold area (area size is set by a user), and the value of the ADX main line exceeds the preset value, the Turning point of price indicator draws an arrow pointed to the further assumed price movement. This idea is described in the article Indicator of Price Reversal .
Indicat

Ultimate Market Master Trend Maîtrisez la direction du marché avec précision L’indicateur Ultimate Market Master Trend est un analyseur complet du sentiment de marché, conçu pour les traders exigeants qui recherchent clarté, précision et confiance dans chaque mouvement.
Il combine une détection intelligente de la tendance , un Stochastique multi-unités de temps , et des repères visuels dynamiques pour vous aider à identifier facilement les points d’entrée et de sortie à forte probabilité. Cara
This indicator finds the "Double Bottom" and "Double Top" technical analysis patterns, shows them on the chart of the currency pair and can signal if the pattern was formed recently. These patterns are reversal, often after the emergence of the trend turns back or a correction occurs. In order not to search for them yourself, it is enough to add the indicator to the chart, after that, you can change different timeframes in order to quickly find such figures on one of the timeframes. There are so
FREE
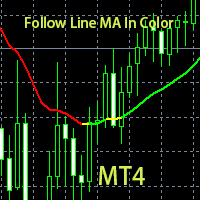
· This indicator generates trading signals based on the color of the line. · When the line shows green color, executes only long orders based on your own trading strategy · When the line shows red color, executes only short orders. · If the line turns yellow, it signifies a reversal is imminent. You can either close all your open positions and stay out; or alternatively you can devise a trading strategy to catch a reversal at its very early stage.
T
FREE

Rejoignez le Canal Koala Trading Solution dans la communauté MQL5 pour découvrir les derniers signaux, les actualités sur tous les produits Koala. Le lien d'adhésion est ci-dessous : https://www.mql5.com/en/channels/koalatradingsolution La description :
nous sommes heureux de vous présenter notre nouvel indicateur gratuit basé sur l'un des indicateurs professionnels et populaires du marché des changes (PSAR). Cet indicateur est une nouvelle modification de l'indicateur SAR parabolique origi
FREE
Ultimate Signal Generator: Your Edge in the Market Are you tired of guessing your next move in the market? The Ultimate Signal Generator is here to change that. This powerful MQL4 indicator is designed to give you a clear trading advantage by providing reliable buy and sell signals. It's a smart, effective tool that helps you make confident decisions, so you can focus on your strategy, not on uncertainty. Key Advantages and Features Pinpoint Accuracy: Our indicator uses a unique blend of Bollin
FREE
1. Indicator Purpose and Inputs Overview The Linear Regression Forecaster is an advanced analytical indicator designed to perform comprehensive trend evaluation and short-term price forecasting using the Linear Regression (LR) statistical method.
It is optimized for the Weekly (W1) timeframe and combines both long-term trend analysis and short-term rolling trend dynamics to generate reliable weekly forecasts. The indicator operates using two distinct timeframes : Long-Term Period (e.g., 52 weeks
FREE
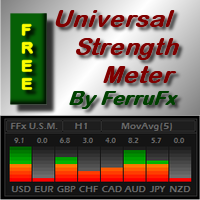
PRO version is available here: https://www.mql5.com/en/market/product/12648 FFx Universal Strength Meter is more than a basic strength meter. Instead of limiting the calculation to price, it can be based on any of the 19 integrated strength modes + 9 timeframes. With the FFx USM, you are able to define any period for any timeframe. For example, you can set the dashboard for the last 10 candles for M15… Full flexibility! Very easy to interpret... It gives a great idea about which currency is weak
FREE
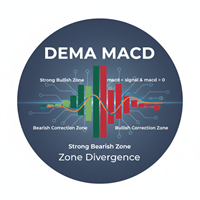
Indicator: The DEMA MACD Zone Divergence This is a powerful, multi-timeframe trend-following indicator based on the Moving Average Convergence Divergence (MACD) , but enhanced using Double Exponential Moving Averages (DEMA) for reduced lag. Its main function is to paint the background of the price chart with color-coded rectangular zones, clearly signaling the current momentum phase and potential shifts in market control (bullish or bearish). Core Purpose To visually map the strength and phas
FREE

Comment créer un robot de trading automatisé avec Rule Plotter Avez-vous déjà rêvé de pouvoir automatiser vos stratégies de trading en quelques clics seulement ? Imaginez avoir la liberté de créer et de tester différentes stratégies de trading sans avoir besoin de plonger dans des codes compliqués. Avec Rule Plotter, cette vision devient réalité. Voici comment vous pouvez créer votre propre robot de trading personnalisé en utilisant Rule Plotter, un outil de création de système de trading qui si
FREE
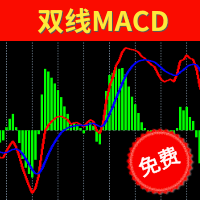
Two Lines MACD Many people who conduct technical transactions on MT4 like to use MACD to judge the turning or continuation of the market. When everyone uses the MACD indicator that comes with MT4, they find that the indicator is a single-line MACD, and the histogram seems to be similar to the past. The MACD that I understand does not match. In order to provide traders with a perfect trading experience, we especially provides free two-line MACD indicators for all traders! The single line in the
FREE
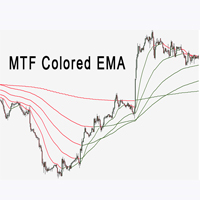
L'indicateur Multi Time Frame EMA est d'une grande aide pour déterminer la direction de la tendance. Cela peut être un excellent ajout à votre stratégie existante ou à une nouvelle fondation. Nous, les humains, pouvons prendre de meilleures décisions lorsque nous voyons mieux visuellement. Nous l'avons donc conçu pour afficher différentes couleurs pour les tendances haussières et les tendances baissières. Tout le monde peut personnaliser cela de la manière qui lui convient le mieux. Nous pouvons
FREE
Restez en avance sur l’élan du marché avec le Pip Movement Alert MT4, un indicateur polyvalent multi-devises conçu pour suivre et alerter les traders sur des mouvements précis en pips à travers plusieurs symboles, idéal pour le trading de forex, actions, cryptomonnaies et matières premières. Loué dans les communautés de trading telles que Forex Factory et Reddit’s r/Forex, et mis en avant dans les discussions sur Investopedia et TradingView pour sa capacité à détecter les changements soudains du
FREE

The indicator is completely based on the classic MFI indicator. I recommend watching my advisor - Night Zen EA
It contains two basic trading strategies: The output of the MFI line from overbought/oversold zones. The entry of the MFI line into the overbought/oversold zones. Arrows are drawn after confirming the signal by strategies and are not redrawn.
Alerts are also registered: Alerts Push notifications to the mobile terminal email Settings: MFI period - the period of the MFI indicator Lev
FREE
An EA version is being prepared. You can send a private message "notify about EA version".
EA will be versatile with many settings for trading on various indicators. The new EA will also allow trading on this indicator. For example, allowing signals after X signals/bars to X signals/bars in one direction, before changing direction. If Break Out happened before/after the signal of another indicator. Collect profit on each next signal above/below the previous one.
Send a private message "notify
FREE
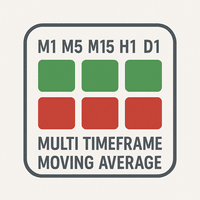
The "MTF Moving Average Panel" indicator is more of a helping tool than an indicator, it serves to help know the trend direction for the current currency pair of all timeframes in one place. It is best used with other indicators and signals, to help filter the signals according the trend based on multiple timeframes.
Indicator inputs : - Moving Average period : Default is set to 34. - Moving Average method : The method of calculation of the Moving Average. Default is set to Exponential. - Movin
FREE
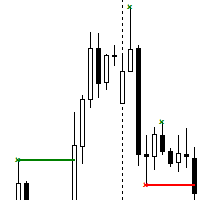
The Contraction/Expansion Breakout Indicator for MetaTrader 4 (MT4) is a powerful tool crafted to identify and signal the breakout of bullish and bearish contraction or expansion formations within financial markets. Utilizing advanced algorithmic calculations, this indicator assists traders in recognizing significant price movements that frequently accompany these formations, providing valuable insights for strategic trading decisions. Key Features: Contraction and Expansion Identification: The
FREE

The indicator gives buy or sell signals based on the Parabolic SAR indicator, and it also contains strategies with Moving Average. There are alerts and alerts to the mobile terminal and to the mail. Arrows are drawn on the chart after the signal is confirmed. They don't redraw. I recommend watching my advisor - Night Zen EA
To keep up to date with my latest products and ideas, join my telegram channel and subscribe to my profile. The link in my profile contacts - My profile The indicator in
FREE
What is the Market Sessions Indicator? The Market Sessions Indicator is a technical analysis tool designed for the MetaTrader 4 platform. It visually represents the trading hours of major financial markets (Asia, Europe, USA, and other key sessions) on the chart. By marking each market session with colored rectangles, it helps traders understand which markets are active and their impact on price movements. What Does It Do? Visualizes Market Sessions : Displays key trading sessions such as Asia,
FREE

Parce que le style compte
Je sais combien il est ennuyeux de cliquer à chaque fois sur les propriétés pour changer la couleur de la bougie, l'arrière-plan en clair ou foncé, et mettre ou enlever la grille. Voici la solution en un seul clic : Trois boutons personnalisables pour choisir le style de bougie que les commerçants souhaitent. Un bouton pour passer du mode Jour au mode Nuit. Un bouton pour afficher ou masquer la grille sur les graphiques. ***** Dans les paramètres, vous pouvez choisir
FREE

Stop Guessing, Start Sniping: Introducing SR Sniper! Tired of entry points that seem random? The SR Sniper indicator is your new essential tool for finding high-probability trades with surgical precision. It's designed to cut through the market noise, giving you clear Buy and Sell signals right at the most critical price zones. This powerful indicator combines the dynamic analysis of the Commodity Channel Index (CCI) with automatic Support and Resistance (S/R) detection —and then filters everyt
FREE

Features:
1- Get OB/OS Levels from Golden MA Levels
2- Wait for Buy/Sell Start Level Cross
3- Optional: Should price cross Mid Level in earlier bars
4- Optional: Crossing bar High/Medium Volume
5- Optional: MA Stacked to check up/down trend for current TF
6- Optional: NRTR higher timeframes aligned Check
Detailed blog post explained: https://www.mql5.com/en/blogs/post/758457
Levels with Buffers available here: Golden MA Levels Indicator: https://www.mql5.com/en/market/product/119515 Note: Arr
FREE
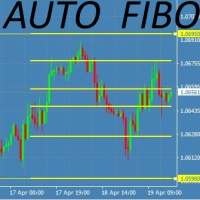
This Fibonacci Indicator is showing fibo retracement lines on chart for EA trading same as the default tool from Metatrader's menu, except this one is fully automatic and changes along with the chart (with modes B and C, then mode A is always fixed by set levels)
AND it also offers the line levels for the Expert Advisors to read (buffers) , so you can set your trades based on crossover\crossunder on those fibo lines.
You can choose from 3 modes for selecting the max HIGH and min LOW limit,
and
FREE

Discover Your Edge with Trend Hunter Ultimate Are you tired of second-guessing your trades? Trend Hunter Ultimate is the powerful MT4 indicator designed to cut through the market noise and give you clear, precise trading signals. Built on a proven strategy that combines multiple moving averages and the Stochastic oscillator, this tool is your key to identifying high-probability trend and reversal opportunities. Key Features & Benefits Pinpoint Accuracy: Our unique filtering system uses two EMAs
FREE
This indicator provides a true volume surrogate based on tick volumes. It uses a specific formula for calculation of a near to real estimation of trade volumes distribution , which may be very handy for instruments where only tick volumes are available. Please note that absolute values of the indicator do not correspond to any real volumes data, but the distribution itself, including overall shape and behavior, is similar to real volumes' shape and behavior of related instruments (for example, c
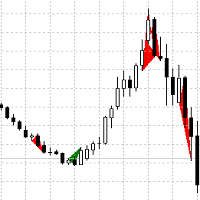
A trend indicator based on the definition of several types of candle combinations, the triangle formed is colored with the corresponding color, the red trend is down, the green one is up. Candlestick combinations of standard and non-standard types with additional conditions for their definition. The recommended timeframe is M30,H1,H4, D1. When combined with other trend indicators, it will provide more accurate points of entry and exit from the market (buying and selling).

This trading system is based on mathematical probability. In this case, 5 consecutive candles are compared with each other. For a logical comparison, consider these 5 candles as 1 candle on the M5 timeframe. Therefore, the comparison begins with the opening of a candle on the M5 timeframe. The probability of a match is 50% in the 1st candle, 25% in the 2nd candle, 12.5% in the 3rd candle, 6.25% in the 4th candle, 3.125% in the 5th candle. Thus, the 5th candle has a probability of matching in 1
DESCRIPTION: Discover the power of adaptation with Adaptive RSI Bands, a revolutionary indicator based on the concepts of self-adaptive trading rules. Unlike traditional RSI with static levels of 70 and 30, this indicator “breathes” with the market, dynamically adjusting its overbought and oversold bands according to recent volatility.
Why use Adaptive RSI Bands? Markets are not static. An RSI level of 70 may be significant in a sideways market, but irrelevant in a strong trend. This indicator
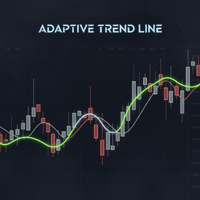
Adaptive Trend Line is not an ordinary moving average. It is an intelligent trend line that changes color based on the internal strength of the market, as measured by the RSI.
How does it work? It combines the smoothness of an Exponential Moving Average (EMA) with the sensitivity of the RSI. - Green Line: The RSI is above 55, indicating that buyers are in control. - Red Line: The RSI is below 45, indicating that sellers are in control. - Gray Line: The RSI is in the neutral zone (45-55), indic

This is a self-explanatory indicator - do nothing when the current price in the "fence" (flat) mode. Definition of a flat market: A market price that is neither Up nor Down. The input parameter counted_bars determines on how many bars the indicator's lines will be visible starting from the current Bar backward. The input parameter barsNum is used as a Period for aqua "fence" calculation.

The Quality trend indicator expresses the ratio of the strength of a trend or the speed of its growth (fall) to the degree of its noisiness or a certain norm of amplitudes of chaotic fluctuations of a growing (falling) price. The position of the indicator line above zero shows an increasing trend, below zero - a falling trend, the fluctuation of the indicator line near zero shows a flat. If the indicator line begins to fluctuate rapidly around zero and approach it, then this indica

M1Arrows is a MT4 trend arrows Indicator
* Smart Scalper Setup (M1) :: Signal 5 Main 20 + Signal 20 Main 80 + Fibonacci ZigArcs 20
(Screenshot1) Add the indicator with first setting,
then add it again to the same graph with other settings.
You can add as many as you want, but 2 M1Arrows in just one graph is enought
Never open orders againt the slow setting trend
Do not open more than 3 orders per slow setting trend
It will work better in Europe/USA markets, * M15 Day Trade Setup: Signal 20 ma
FREE

Power Renko is an indicator which plots Renko bricks underneath the chart using a histogram. You can select the brick size and the timeframe of the Renko bricks as well as whether or not to use the close price or the high/low price of the candles. Renko bricks are based on price alone, not time, therefor the Renko bricks will not be aligned with the chart's time. They are extremely useful for trend trading and many different strategies can be formed from them. Buffers are provided allowing you t

Based on TheStrat by Rob Smith (@robintheblack) #thestrat , which is a trading method that Rob has developed over a 30 year career in the market. This is TheStrat Timeframe Continuity scanner that allows you to constantly scan either the Stocks, Currency pairs, indices or commodities that you want to watch. The time frames that you can watch can be (Year, Quarter, Month, Week, Day, H4, H1, 15M and smaller if you feel like it). It tells what the current candle is doing. It is either inside b
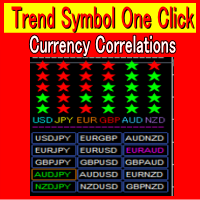
Currency Strength Meter 1:Correctly identifying trends in foreign exchange investments is critical. 2:TrendSymbolOneClick quickly detects and displays trends that have just begun and those that have already been in place for an extended period of time. 3:There is also a USD JPY EUR GBP AUD NZD strength function. 4:Volatility allows you to know exactly when there is a major market move. 5:You can save time in your market analysis by using Trend Symbol One Click. 6:Analysis available from 1 minut
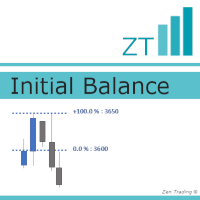
Initial Balance is a concept for the first hour of a trading session, lowest(starting) to highest point, that often determines important support / resistance for the next hours. It is based on Fibonacci levels and offers very relevant levels of reaction. Nowadays, it's mainly used for the first hour BEFORE the open. --------------- The advantage of this indicator lies here : - you could define by yourself the period for YOUR Initial Balance (first hour of a trading session, one hour before the o
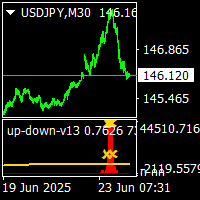
up-down v13 indicator is no repaint and works all pairs and all time frames charts. it consumes too much time need at least i5 cpu.pc v.2.2 use les cpu.but it sometimes cahange back signals.any one request it i will give bonus it. it is suitable also 1 m charts for all pairs. and hold long way to signal. dont gives too many signals. when red histogram cross trigger line that is up signal.and price probably will down when blue histogram cross trigger line that is down signal.and price probably
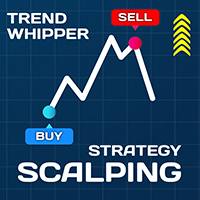
Scalping Strategy Trend detection is one of the basic challenges of every trader. Finding a way to tell when to enter a trade is very important, timing is a game changer, not too early and not too late. Sometimes, due to not knowing the market conditions, the trader closes his positions with a small profit or allows the losses to grow, these are the mistakes that novice traders make. Indicator Trend Whipper is a complete trading strategy and can improve the trader's trading process. The trend de

In the ever-evolving world of Forex trading, understanding the different trading sessions is paramount to making informed trading decisions. Each trading session brings its own unique characteristics, opportunities, and challenges, and recognizing these can greatly enhance your trading strategies. Whether you're a novice or a seasoned trader, the Forex market's three main trading sessions – Asian, London, and New York – are crucial milestones that dictate market behavior and potential trade set

Offer 249 down from 350 for the next 3 copies. then back to 350 $
Are you tired of using outdated indicators that leave you guessing where to set your profit targets? Look no further than the AK CAP Opening Range Breakout Indicator. This powerful tool is backed by a US patent and has already helped countless traders pass funded challenges like FTMO. We use it daily on our prop traders and internal funds, and now it's available to you as well. The calculation behind the indicator is incredibly a

MACD is probably one of the most popular technical indicators out there. When the market is trending, it actually does a pretty good job, but when the market starts consolidating and moving sideways, the MACD performs not so well. SX Impulse MACD for MT5 is available here . Impulse MACD is a modified version of MACD that works very well for trading Forex, stocks, and cryptocurrencies. It has its own unique feature which perfectly filters out the values in a moving average range and enables it t
Le MetaTrader Market offre un lieu pratique et sécurisé pour acheter des applications pour la plateforme MetaTrader. Téléchargez des versions démo gratuites de Expert Advisors et des indicateurs directement depuis votre terminal pour les tester dans le testeur de stratégie.
Testez les applications dans différents modes pour surveiller les performances et effectuez un paiement pour le produit que vous souhaitez en utilisant le système de paiement MQL5.community.
Vous manquez des opportunités de trading :
- Applications de trading gratuites
- Plus de 8 000 signaux à copier
- Actualités économiques pour explorer les marchés financiers
Inscription
Se connecter
Si vous n'avez pas de compte, veuillez vous inscrire
Autorisez l'utilisation de cookies pour vous connecter au site Web MQL5.com.
Veuillez activer les paramètres nécessaires dans votre navigateur, sinon vous ne pourrez pas vous connecter.