Regardez les tutoriels vidéo de Market sur YouTube
Comment acheter un robot de trading ou un indicateur
Exécutez votre EA sur
hébergement virtuel
hébergement virtuel
Test un indicateur/robot de trading avant d'acheter
Vous voulez gagner de l'argent sur Market ?
Comment présenter un produit pour qu'il se vende bien
Indicateurs techniques pour MetaTrader 4 - 10

The indicator displays volume profiles based on the nesting principle. Profiles periods are pre-set so that each subsequent profile has a length twice as long as the length of the previous profile. In addition to profiles, the indicator displays volume clusters sorted by color, depending on the volume they contain.
Indicator operation features The indicator works on typical timeframes from M5 to MN, but for calculations uses historical data from smaller timeframes: M1 - for timeframes from M5
FREE

Il s'agit d'un scanner multi-symboles et multi-unités de temps pour notre indicateur ACB Breakout Arrows . Avec les paramètres par défaut, il analyse les signaux d'achat/vente sur 28 paires de devises et 9 unités de temps simultanément .
Fonctionnalités
Peut analyser 252* combinaisons de symboles et d’unités de temps depuis un seul graphique. Ouvrez le graphique du signal avec un modèle prédéfini en un seul clic. Déplacement facile du panneau n’importe où sur le graphique par glisser-déposer.
L'indicateur Candle_Timer_and_Spread affiche sur un graphique le temps jusqu'à la fin de la bougie et le pourcentage de variation de prix ainsi que le spread pour les symboles sélectionnés.
Le minuteur pour le temps jusqu'à la fin de la bougie sur la période actuelle et la variation du prix en pourcentage par rapport au prix d'ouverture du jour est situé par défaut dans le coin supérieur droit du graphique. Le panneau affiche l'écart et la variation en pourcentage du prix actuel par rapport à
FREE

YOU CAN NOW DOWNLOAD FREE VERSIONS OF OUR PAID INDICATORS . IT'S OUR WAY OF GIVING BACK TO THE COMMUNITY ! >>> GO HERE TO DOWNLOAD The system is a free open source pine script originally published on TradingView by everget . It was converted to Mt4 by Forex Robot Makers. This system is a popular trend indicator based on ATR ( Average True Range ) , Moving Averages and the Donchian channel .
System BackGround
ATR The average true range is an indicator of the price volatility of an asse
FREE

This indicator finds Three Drives patterns. The Three Drives pattern is a 6-point reversal pattern characterised by a series of higher highs or lower lows that complete at a 127% or 161.8% Fibonacci extension. It signals that the market is exhausted and a reversal can happen. [ Installation Guide | Update Guide | Troubleshooting | FAQ | All Products ] Customizable pattern sizes
Customizable colors and sizes
Customizable breakout periods Customizable 1-2-3 and 0-A-B ratios
It implements visual/s
FREE

Long-Term Supply Demand Indicator – Description
The Long-Term Supply Demand Indicator is a professional MT4 tool designed for traders who want to track higher-timeframe support and resistance zones on lower timeframes. It identifies supply and demand areas formed on the H4 timeframe and displays them clearly on M15, M5, and M1 charts, giving traders a precise view of key market zones across multiple timeframes.
The indicator provides alerts when a new supply or demand zone is formed, allowing
FREE

Detect strength for uptrends and downtrends by tracking Buy Power and Sell Power. Stay on the right side of the market by being able to determine whether the market is in a bull or bear trend and how strong the trend is.
Free download for a limited time! We hope you enjoy, with our very best wishes during this pandemic!
Trend Trigger Factor aims to ride out sideways movement, while positioning the trader in the correct side of the market to capture big trends when they occur. It was origin
FREE
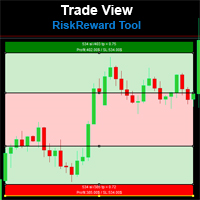
Risk Reward Tool , It is easy to use. With this tool you can see the rates of profit loss profit. You can see your strategy and earnings reward status of your goals.Double calculation can be done with single tool. Move with drag and drop. You can adjust the lot amount for calculations. The calculation results are shown in the comment section. There may sometimes be graphical errors during movements. Calculations works at all currency. Calculations All CFD works. Updates and improvements will co
FREE

Индикатор MQLTA Supertrend Multi Timeframe сочетает в себе значения Supertrend, найденные на нескольких таймфреймах, чтобы подтвердить тренд пары. Для работы утилиты необходим бесплатный индикатор MQLTA Supertrend Line - https://www.mql5.com/en/market/product/25951.
Как он работает? Индикатор проверяет состояние Supertrend на всех выбранных таймфреймах и отображает результат в виде легко читаемой таблицы.
Как торговать с помощью индикатора Supertrend Multi Timeframe Покупку следует совершать,
FREE
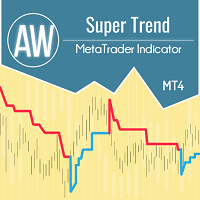
AW Super Trend - C'est l'un des indicateurs de tendance classiques les plus populaires. Il a un réglage simple, vous permet non seulement de travailler avec la tendance, mais affiche également le niveau de stop loss, qui est calculé par cet indicateur. Avantages:
Instruments: Paires de devises , actions, matières premières, indices, crypto-monnaies. Délai : М15 et supérieur. Temps de négociation : 24 heures sur 24. Affiche la direction de la tendance actuelle. Calcule le stop loss. I
FREE

RSI divergence indicator is a multi-timeframe and multi-symbol indicator that help us find divergences between price chart and RSI indicator. Always use the divergence indicators with other technical assets like support resistance zones, candlestick patterns and price action to have a higher possibility to find trend reversals. This indicator will identify the peaks and troughs of both price and the RSI indicator. You can adjust the parameters to adjust the strength and weakness of these peaks a
FREE
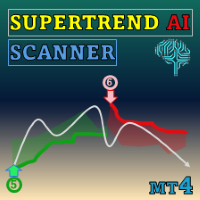
Special offer : ALL TOOLS , just $35 each! New tools will be $30 for the first week or the first 3 purchases ! Trading Tools Channel on MQL5 : Join my MQL5 channel to update the latest news from me Découvrez la puissance de l'IA avec le SuperTrend AI Clustering avec Scanner , un outil révolutionnaire pour MetaTrader 4 (MT4). Cet indicateur redéfinit l'analyse du marché en combinant le clustering K-means avec l'indicateur SuperTrend largement populaire, offrant aux traders un avanta

L'indicateur SMC Venom Model BPR est un outil professionnel pour les traders travaillant dans le concept Smart Money (SMC). Il identifie automatiquement deux modèles clés sur le graphique des prix: FVG (Fair Value Gap) est une combinaison de trois bougies, dans laquelle il y a un écart entre la première et la troisième bougie. Forme une zone entre les niveaux où il n'y a pas de support de volume, ce qui conduit souvent à une correction des prix. BPR (Balanced Price Range) est une combinaiso

Discover Your Edge with Golden Trend Finder Are you tired of second-guessing your trades? Golden Trend Finder is the all-in-one indicator designed to give you a decisive advantage in the market. It's not just another tool; it's a powerful signal generator that combines multiple advanced indicators to provide you with clear, confirmed trading opportunities. Imagine having a smart system that tells you exactly when to enter and exit a trade, filtered to avoid false signals. Golden Trend Finder doe
FREE
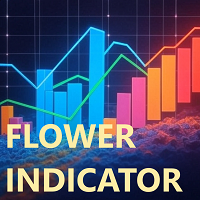
L'indicateur Flower est un outil d'analyse technique principalement utilisé pour identifier les tendances et faciliter les stratégies de scalping ou de trading intraday.
L'indicateur Flower est un indicateur de tendance basé sur l'analyse technique et la dynamique des prix. Il signale visuellement les tendances grâce à des fleurs colorées : les bleues indiquent une tendance haussière, les rouges une tendance baissière.
Chaque niveau peut agir comme support et résistance (attention aux niveaux
FREE

L'indicateur affiche le volume horizontal maximal sur la période sélectionnée. Basé sur l'indicateur UPD1 volume Box . Les lignes peuvent être connectées ou séparées. Dans les paramètres, vous pouvez activer l'alerte tactile intelligente. Un tel indicateur sera utile à ceux qui négocient en utilisant le profil du marché et le concept de Smart Money.
Conditions d'entrée.
Paramètres de base. Bars Count - spécifie le nombre de barres sur lesquelles TF POC sera dessiné. Data Source - délai à part
FREE

Les motifs harmoniques sont les mieux adaptés pour prédire les points de retournement du marché. Ils offrent un taux de réussite élevé et de nombreuses opportunités de trading en une seule journée de trading. Notre indicateur identifie les motifs harmoniques les plus populaires en se basant sur les principes énoncés dans la littérature sur le trading harmonique. REMARQUES IMPORTANTES : L'indicateur ne repeint pas, ne prend pas de retard (il détecte un motif au point D) et ne redessine pas (le mo
FREE
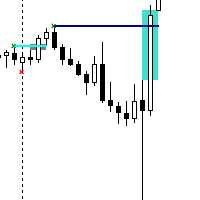
The Contraction/Expansion Breakout Indicator for MetaTrader 4 (MT4) is a powerful tool crafted to identify and signal the breakout of bullish and bearish contraction or expansion formations within financial markets. Utilizing advanced algorithmic calculations, this indicator assists traders in recognizing significant price movements that frequently accompany these formations, providing valuable insights for strategic trading decisions. Key Features: Contraction and Expansion Identification: The
FREE

We provide indicators tailored to better meet your trading requirements. >> MT Magical <<
MT Supply Demand :
It is an indicator created to find supply and demand, which will be important support and resistance levels for the price. Supply Zone is a zone where the price has reached, it is often resisted. In other words, when the price reaches this zone, there will be more selling power to push the price back down.
Demand Zone is a zone where the price has reached, it is ofte
FREE
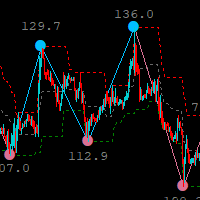
basé sur l'indicateur zigzag, l'indicateur de canal haut bas zigzag est un outil pour alerter le trader d'un changement de tendance, il est d'une grande utilité
comme il donnera une alerte précoce d'un changement dans la tendance actuelle, l'indicateur dispose d'une option multi-périodes pour échanger des délais plus élevés ou plus bas.
canal sur la période actuelle, cet indicateur est un ajout à votre système/stratégie et peut être utilisé de manière autonome pour trader, mais nous vous recomma
FREE

Market Profile 3 MetaTrader 4 indicator — is a classic Market Profile implementation that can show the price density over time, outlining the most important price levels, value area, and control value of a given trading session. This indicator can be attached to timeframes between M1 and D1 and will show the Market Profile for daily, weekly, monthly, or even intraday sessions. Lower timeframes offer higher precision. Higher timeframes are recommended for better visibility. It is also possible t
FREE

Introducing the Delta Volume Profile Indicator - Unleash the Power of Institutional Precision! Technical Indicator: Are you ready to trade like the pros? The Delta Volume Profile Indicator is no ordinary tool. It’s a high-precision, cutting-edge indicator that puts the power of institutional-grade trading in your hands. This unique indicator analyses delta volume distribution in real-time, revealing the market's hidden buy/sell imbalances that the biggest financial institutions rely on to antic

Polynomial Trend - A tool that allows you to determine the direction and strength of a trend. Unlike most indicators, Polynomial Trend finds longer-term trends and gives fewer false signals. This indicator allows you to find the most likely trend reversal points b allows you to identify the current market phase (uptrend, downtrend).
This indicator displays arrows of different colors depending on the current state of the market and thus signals the user about a change in trend. It is easy to us

The Penta-O is a 6-point retracement harmonacci pattern which usually precedes big market movements. Penta-O patterns can expand and repaint quite a bit. To make things easier this indicator implements a twist: it waits for a donchian breakout in the right direction before signaling the trade. The end result is an otherwise repainting indicator with a very reliable trading signal. The donchian breakout period is entered as an input. [ Installation Guide | Update Guide | Troubleshooting | FAQ | A
FREE

Reversal Pattern AI is a groundbreaking advancement in indicator development, combining artificial intelligence algorithms, multi-level market analysis, and classical technical analysis methods. It not only detects reversal patterns but also evaluates market inefficiencies, generating highly accurate trading signals.Thanks to its hybrid model, which utilizes price action analysis, volume, volatility, VWAP, and Volume AVG %, the indicator easily adapts to any market conditions. Reversal Pattern A

L’indicateur SuperTrend est un outil technique de suivi de tendance qui met en évidence visuellement les changements de tendance sur le marché. La couleur et la position de ses lignes changent automatiquement en fonction des mouvements de prix, ce qui aide à prendre des décisions d'entrée et de sortie. Grâce à sa conception simple, il peut être utilisé dans divers styles de trading, manuels ou automatisés. Caractéristiques principales Affichage clair des retournements de tendance
En tendance ha
FREE
Overview
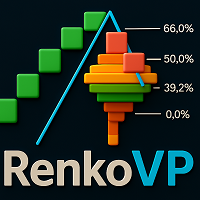
RenkoVP is a professional tool for price structure analysis that runs fully online on the main chart. Unlike many other Renko indicators, it requires no offline charts. The indicator combines Renko bricks, volume profile, dynamic Fibonacci levels, and automatic pattern recognition to help traders identify trends, key zones, and precise entry/exit points. Renko Bricks Configuration
The indicator offers both manual and automatic brick configuration: No offline chart required - runs direc
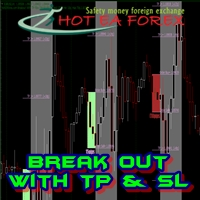
How To Trade
Execute your trades in 3 Easy Steps!
Step 1: Trade Setup Entry Buy in Signal price and TP1 in price indicator, You can use trailing stop in TP1. Entry Sell in Signal price and TP1 in price indicator, You can use trailing stop in TP1. Success Rate ≥ 75% 100:25 Step 2: Set Stop Loss Stop loss BUY ----> You can set stop loss on Line Order SELL. Stop loss SELL ----> You can set stop loss on Line Order BUY. Step 3: Set Take Profit Option 1: Take profit on TP1. Option 2: Partial take pr
FREE

Stochastic RSI Indicator - Master the Art of Timing Elevate your trading game with the "Stochastic RSI Indicator." This powerful tool marries the Stochastic oscillator with the Relative Strength Index (RSI), offering precise insights into market dynamics. It's your key to mastering the art of timing in trading. About the Indicator : The Stochastic RSI Indicator combines two robust indicators - Stochastic and RSI - to provide traders with an exceptional tool for identifying entry and exit points
FREE

Titre du produit Smart Heiken Ashi (MT4) – partie de la série SmartView Indicators Description courte Indicateur Heiken Ashi avec une expérience utilisateur unique sur la plateforme MetaTrader. Offre des capacités avancées non disponibles auparavant, telles que l'ouverture des paramètres par double-clic, le masquage et l'affichage des indicateurs sans les supprimer, et l'affichage de la fenêtre de l'indicateur en taille pleine du graphique. Conçu pour fonctionner parfaitement avec le reste de la
FREE

Titre du produit Smart RSI (MT4) – partie de la série SmartView Indicators Description courte Indicateur RSI avec une expérience utilisateur unique sur la plateforme MetaTrader. Offre des capacités avancées non disponibles auparavant, telles que l'ouverture des paramètres par double-clic, le masquage et l'affichage des indicateurs sans les supprimer, et l'affichage de la fenêtre de l'indicateur en taille pleine du graphique. Conçu pour fonctionner parfaitement avec le reste de la série SmartView
FREE
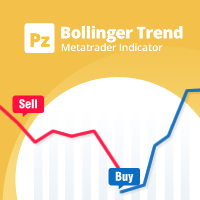
A personal implementation of the famous Bollinger bands indicator as a trend following mechanism, which uses a moving average and the standard deviation to define what a trend is and when it changes. Bollinger bands are usually used as an oversold/overbought indicator only, but in my opinion, the trading approach is more complete using the trend variant as an exit strategy. [ Installation Guide | Update Guide | Troubleshooting | FAQ | All Products ] Easy to trade Customizable colors and sizes It
FREE
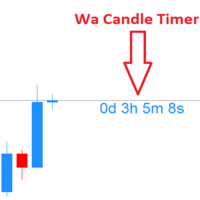
Wa Candle Timer MT4 est un indicateur puissant et facile à utiliser qui affiche le temps restant avant la formation de la prochaine bougie sur votre graphique MT4. Il aide les traders à mieux suivre les temps de clôture pour améliorer l’exécution et la prise de décision. Fonctionnalités clés :
Affiche le compte à rebours de la bougie en cours
Change de couleur lorsque le temps restant passe sous un pourcentage défini
Nouveau dans la version 3.00 : alerte personnalisable à un seuil défi
FREE

Pips Hunter PRO a été développé sur plusieurs années et est une version améliorée de son prédécesseur. Ce puissant indicateur analyse le marché et l'historique des prix pour générer des entrées d'achat et de vente. Pour le calcul de ces entrées, il utilise différents indicateurs qui travaillent ensemble ainsi qu'un logarithme statistique complexe qui filtre les entrées les moins favorables et les élimine / version MT5 .
Fonctionnalités Pas de repeinture
Cet indicateur ne change pas ses valeur
FREE
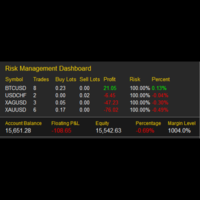
My Risk Management The Risk Management Dashboard is a visual tool designed to help traders monitor risk exposure in real time. With a clear and compact layout, it provides an instant overview of trading activity, enabling more disciplined and informed decision-making. Key Features Active Symbol Summary
Displays all traded symbols with the number of trades, total buy/sell lots, and current profit/loss. Per-Symbol Risk Analysis
Calculates and shows the risk percentage of each symbol relative to
FREE

Hauts et bas de l'UR
UR Highs&Lows effectue une analyse approfondie du mouvement des prix et de sa volatilité, et crée un canal dans lequel le prix évolue. Ce canal se déplace maintenant comme un oscillateur et est superposé à la déviation du prix pour signaler les épuisements potentiels et les inversions possibles.
Avantages d'utiliser UR Highs&Lows :
Aucun paramètre Vous avez 3 lignes qui décrivent le mouvement des prix - White Line qui est une moyenne du prix et Blue Lines qui sont ses

Наш индикатор RSI оснащен мощной мультитаймфреймовой (MTF) функцией , которая позволяет вам отображать значения RSI с других таймфреймов (например, H1, H4, D1) прямо на вашем текущем рабочем графике (например, M15). Преимущества MTF RSI: Контекст Старшего Таймфрейма: Понимайте глобальный тренд и уровни перекупленности/перепроданности со старших таймфреймов, не переключая графики. Это помогает фильтровать сигналы на младших ТФ и входить в сделки по направлению основного движения. Раннее Обнаружен
FREE
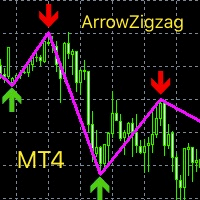
This index is based on the secondary development of zigzag, adding high and low point arrow indication, thickening the line and changing the color. Can be a good display of the current admission trading signals, current long or short. It can be combined with other indicators to determine the trading point, which has great reference value. Compared with the general trend index or oscillation batch standard, the accurate determination is higher from the perspective of historical data research and
FREE

Dies ist ein durchschnittlicher Index basierend auf einem benutzerdefinierten Algorithmus. Je nach Band können Uplink und Downlink farblich identifiziert werden. Das Pop-up-Feld kann ein- oder ausgeschaltet werden, um anzuzeigen, dass der aktuelle Kauf- oder Verkaufsauftrag platziert werden soll.
Beschreibung der Parameterliste:
Extern int price = 0; / /anfänglicher Durchschnittspreis des Indikators
Externe int length = 20; / / der Indikator berechnet den Durchschnittszeitraum, der dem Du
FREE

An imbalance bar or candle, also called a fair value gap (FVG) or inefficiency, shows strong buying or selling in the market or weak buying or selling that causes prices to move quickly with high momentum. This is why it's an important part of price action analysis. Our indicator offers three main benefits: Clear Design: The imbalance bar is built into the candle with a simple, clean look that makes it easy for traders to spot while keeping the chart tidy. Easy to Use: A hotkey lets traders quic
FREE

Zig Zag 123 tells us when a reversal or continuation is more likely by looking at the shift in supply and demand. When this happens a signature pattern appears known as 123 (also known ABC) will often break out in direction of higher low or lower high.
Stop loss and take profit levels have been added. There is a panel that shows the overall performance of your trades for if you was to use these stop loss and take profit levels.
We get alerted if a pattern 123 appears and also if the price re
FREE
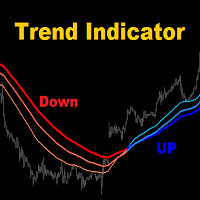
MA3 Trend - is the good trend indicator on three MAs. Benefits of the indicator: The indicator produces signals with high accuracy.
The confirmed signal of the indicator does not disappear and is not redrawn.
You can trade on the MetaTrader 4 trading platform of any broker.
You can trade any assets (currencies, metals, cryptocurrencies, stocks, indices etc.).
You can trade on any timeframes (M5-M15 scalping and day trading / M30-H1 medium-term trading / H4-D1 long-term trading). Individua
FREE
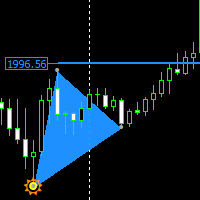
Non-repaint price action pattern based indicator works on all timeframe the indicator is based on a 123 Triangle pattern that happens everyday on the market the indicator will point out the pattern for you and you can turn on Fib level to see your take profit. Blue triangle is a buy signal Red triangle is a sell signal horizonal blue and red lines is an indication to place your trail stop loss one price has reached that area only entry when the triangle has fully formed

Necessary for traders: tools and indicators Waves automatically calculate indicators, channel trend trading Perfect trend-wave automatic calculation channel calculation , MT4 Perfect trend-wave automatic calculation channel calculation , MT5 Local Trading copying Easy And Fast Copy , MT4 Easy And Fast Copy , MT5 Local Trading copying For DEMO Easy And Fast Copy , MT4 DEMO Easy And Fast Copy , MT5 DEMO 砖图Renko PRO->>>
The display of the brick map on the main map.
The Renko chart ideally remove
FREE
The TPX Supply Demand indicator will alert you to detect supply and demand areas. With the risk/reward filter, you'll only receive alerts if they match your chosen configuration. With the first-touch filter, alerts will only be issued in colored areas that haven't been touched yet, meaning they haven't yet been settled and have the greatest potential for reaction. Once the area is touched, only the border remains. Entry and stop-loss values are available both in the alerts and on the screen.
FREE
GT Trend est un indicateur de tendance spécialement conçu pour le trading sur les graphiques M1 et M5 . L'indicateur est idéal pour les traders qui préfèrent le trading intraday. Vous pouvez utiliser cet indicateur comme base pour votre système de trading ou comme solution de trading autonome. L'indicateur est facile à utiliser. Il vous suffit de suivre les signaux. Je fournirai également des indicateurs supplémentaires à tous les utilisateurs de cet indicateur gratuitement, ce qui aidera à util

Are you ready to get Alert,aim,shot and take profit? well nice to meet you im Martin del NEGRO from Argentina, let me introduce you about your new indicator, this one have the knowledge to find pivot points in the chart ,more specifically when the price its starting a new strong trend (buy)bullish or bearish(sell) ,and when "Victory Ravage Days.ex4" indicator find this one pivot point, he will immediately get in touch with you send you a notification to take advantage of this fresh and new oport
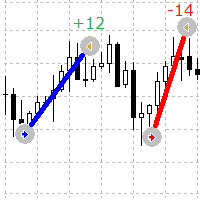
Un indicateur simple mais utile pour voir visuellement les points d'entrée et de sortie des ordres sur le graphique
Cet indicateur affiche les commandes ouvertes en cours et les commandes terminées sur le symbole
Paramètres de l'indicateur
Lines Buy color - spécifie la couleur des lignes pour les ordres d'achat Lines Sell color - spécifie la couleur des lignes pour les ordres de vente Lines Width - définit la largeur de la ligne, fonctionne pour les types de style solides Lines style - défin
FREE

Présentation de ProEngulfing - Votre Indicateur de Modèle Engulf Professionnel pour MT4 Libérez la puissance de la précision avec ProEngulfing, un indicateur de pointe conçu pour identifier et mettre en avant des modèles engulf qualifiés sur le marché du forex. Développé pour MetaTrader 4, ProEngulfing offre une approche méticuleuse de la reconnaissance des modèles engulf, garantissant que vous ne recevez que les signaux les plus fiables pour vos décisions de trading. Comment fonctionne ProEngu
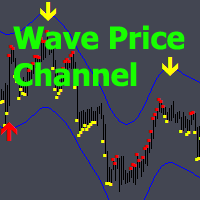
Wave Price Channel - Système analytique de trading conçu pour rechercher des impulsions et des corrections.
L'indicateur vous permet de travailler dans le sens du canal des prix, construit sur la base de la volatilité.
Lorsqu'une flèche vers le haut ou vers le bas est dessinée sur le canal, il devient possible d'aller dans cette direction ; le signal dans cette direction est confirmé par un indicateur point sensible aux changements de prix.
Tant que les points de la même couleur persistent, le

Surfez sur la tendance – Un signal clair pour suivre la vague Sur les marchés financiers, les opportunités les plus stables de gains se trouvent généralement lors de phases de tendance bien établies. Pourtant, même pour les traders expérimentés, il n’est pas toujours facile de capter ces mouvements. Ride the Trend Signal est un indicateur de signal conçu pour repérer les « pullbacks » dans les tendances haussières ou baissières. Plutôt que d’entrer dès le début de la tendance, il attend une conf
FREE

Candle Binary Scalper est un produit d'analyse technique pour le forex et les options binaires.
Comprend plusieurs indicateurs techniques combinés dans un système commercial.
Convient pour le trading manuel dans une tendance, pour le scalping et les options binaires. Fonctionne sur tous les délais et instruments de trading.
Les délais recommandés pour le trading M15, M30, H1 et H4, M5 et M1 doivent être utilisés en cas de forte volatilité. Il existe plusieurs types d'alertes.
Comment utiliser l
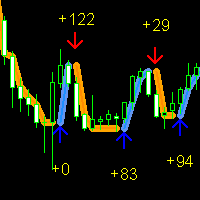
Forex Gump Signal est un nouvel indicateur de la série ForexGump. Cet indicateur, contrairement à d'autres, détermine les points d'inversion des prix à l'aide d'un calcul mathématique de la vitesse d'une moyenne mobile standard. Lorsque la vitesse de déplacement ralentit, l'indicateur interprète cela comme un signal d'inversion de tendance. Cela permet à l'indicateur de capturer même les plus petits points d'inversion de prix. Pour que l'indicateur commence à analyser des points d'inversion plu

MarketSessions Indicator The Essential Tool for Global Market Session Visualization The MarketSessions indicator is a powerful MT4 tool designed to help traders visualize major forex market sessions directly on their charts. By clearly displaying the active trading hours of Sydney, Tokyo, London, and New York markets, this indicator helps you identify optimal trading periods and understand market volatility patterns. Key Features: Clear visualization of all four major trading sessions (Sydney, T
FREE
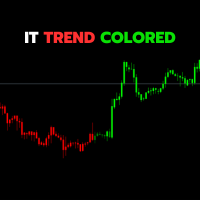
L'indicateur IT Trend Colored est un outil puissant conçu par IT Trading ( InfiniteTrades Software Corp), pour aider les traders à identifier les tendances du marché de manière visuelle et efficace. Cette version, est un indicateur personnalisé pour la plateforme de trading MetaTrader 4.
Fonctionnalités clés :
• Identification des Tendances : L'indicateur utilise une combinaison de moyennes mobiles simples (SMA) pour déterminer la direction de la tendance du marché.
• Coloration Intuitive
FREE

DONCHIAN CHANNEL DC Il s'agit d'un indicateur de tendance développé par “Richard Donchian”, composé de 3 couches, le canal supérieur, le canal inférieur et le canal intermédiaire. Il est créé sur le canal Donchian en traçant les prix les plus élevés et les plus bas atteints au cours de la période précédente sur le graphique des prix. Il est également utilisé pour mesurer la volatilité du marché, car il s'agit d'un canal d'expansion/contraction en fonction de l'augmentation/diminution de la volat
FREE
** All Symbols x All Time frames scan just by pressing scanner button ** Discount: The price is $50$, But now it is just $35, Limited time offer is active.
*** Contact me to send you instruction and add you in "Swing scanner group" for sharing or seeing experiences with other users. Swing EA: https://www.mql5.com/en/market/product/124747 Introduction: Swing Scanner is the indicator designed to detect swings in the direction of the trend and possible reversal swings. The indicator studies sev

Multicurrency and multitimeframe modification of the ZigZag indicator. Displays the current direction of the market, the height of the last movement, the number of bars in this movement and the breaking of the previous point of the ZigZag (horizontal line). This is MTF Scanner, you can actually see the supply and demand levels.
You can specify any desired currencies and timeframes in the parameters. Also, the panel can send notifications when the ZigZag changes direction or when there was a br

Auto Fibonacci Retracement Indicator — Flexible and Reliable This is not just another Auto Fibonacci Retracement indicator — it’s one of the most flexible and dependable tools available . If you find it useful, please leave a review or comment to support the project. Check out my other helpful tools below: Timeframes Trend Scanner - Scan the trend of assets in difference timeframes with multiple indicators
Market Trend Scanner - Scan the trend of multiple-assets in with multiple indicators
FREE

Si vous utilisez Inside Bar sur TradingView, où repérer les inside bars est facile et réconfortant, mais que vous ne le trouvez pas sur le marché MQL, votre recherche s'arrête ici. Pourquoi InsideBar Highlight ? Aussi simple que ABC : Inside bars simplifié. Notre outil se concentre sur le corps de la bougie, pour que vous puissiez voir ce qui compte sans aucun mal de tête. Votre style, votre choix : Coloré ou tout uniforme ? C'est vous qui décidez. Repérez les mouvements vers le haut ou vers le
FREE

Sentinel Arrow Fonctionnalités clés :
⊗ Un algorithme exclusif pour identifier rapidement et précisément les tendances, les retournements et les changements de momentum.
⊗ Conçu pour un usage professionnel, il intègre une logique de signaux robuste qui élimine les délais et les fausses alertes.
⊗ Adapté à différentes unités de temps.
⊗ Ne redessine, ne supprime ni ne modifie les signaux passés.
⊗ Tous les signaux d'achat et de vente sont générés directement sur le chandelier et restent fix
FREE
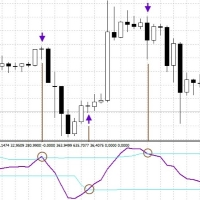
Cyclic Smoothed Relative Strength Indicator
The cyclic smoothed RSI indicator is an enhancement of the classic RSI, adding
additional smoothing according to the market vibration,
adaptive upper and lower bands according to the cyclic memory and
using the current dominant cycle length as input for the indicator. The cRSI is used like a standard indicator. The chart highlights trading signals where the signal line crosses above or below the adaptive lower/upper bands. It is much more responsive
FREE

Info Plus is a simple tool that displays the current status on an asset class. The information displayed by Info Plus includes: Bid Price The high and low of the day. Candle time left. Current spread. Selected timeframe. Asset class selected (Symbol). Pip value. Open Positions. Total pips booked. Pips per trade. Session times (they may not be accurate and are subject to changes). Date and time.
How it Works When loaded onto any chart, Info Plus automatically gets the following parameters: Bid P
FREE

Bienvenue dans l'indicateur de reconnaissance avancée du motif Gartley Cet indicateur détecte le modèle de Gartley basé sur HH et LL de la structure des prix et des niveaux de Fibonacci, et lorsque certains niveaux de fib sont atteints, l'indicateur affichera le modèle sur le graphique. Version MT5 : WH Advanced Gartley Pattern MT5
**Cet indicateur fait partie du combo WH Ultimate Harmonic Patterns MT4 , qui inclut toute la reconnaissance de formes.** Caractéristiques : Algorithme ava
FREE

MQLTA Support Resistance Lines is an indicator that calculates the historical levels of Support and Resistance and display them as Lines on chart. It will also Alert you if the price is in a Safe or Dangerous zone to trade and show you the distance to the next level. The indicator is ideal to be used in other Expert Advisor through the iCustom function. This indicator can be tested LIVE on AUDNZD with the following DEMO https://www.mql5.com/en/market/product/26572
How does it work? The indicato
FREE

"Experience the full power on EURUSD!" Title: ChanLun Structure and SMC System Description: This indicator combines ChanLun Theory (Bi, Duan, Zhongshu) with Smart Money Concepts (SMC) to analyze market structure. It visualizes the market in three distinct layers—Pen, Segment, and Wave—and automatically identifies Premium, Discount, and Optimal Trade Entry (OTE) zones. The tool features an Interactive Hybrid Control System , allowing traders to manage the chart using keyboard hotkeys or mouse int
FREE
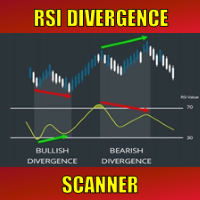
Special offer : ALL TOOLS , just $35 each! New tools will be $30 for the first week or the first 3 purchases ! Trading Tools Channel on MQL5 : Join my MQL5 channel to update the latest news from me Sur les marchés financiers dynamiques, identifier les signaux de renversement de tendance est essentiel pour un trading efficace. Le RSI Divergence Scanner est conçu pour vous aider à détecter avec précision et efficacité les signaux de divergence RSI sur diverses paires de devises et di
FREE

Pullback Power: Catch the Trend, Maximize Your Profit! Tired of chasing trades and getting caught in market noise? The Pullback Power indicator is your essential tool for finding high-probability entries in a trending market. It's not about guessing; it's about trading with confidence, knowing you have a system designed to confirm genuine trend continuation after a brief pullback . This smart indicator combines the reliability of EMA Crosses for established trend direction with the dynamic conf
FREE

Dashboard for Ma Speedometer: https://www.mql5.com/en/market/product/116784
Non standard attitude to the standard moving average indicator. The essence of the indicator is to determine the strength and speed of the price direction by determining the tilt angle of the moving average. A point is taken on the fifteenth MA candle and a point on the last closed MA candle, a straight line is drawn between them, it is movable and on a hemisphere shows an angle of inclination from 90 degrees to -90. a
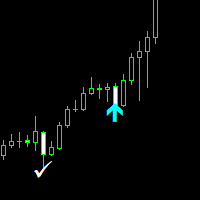
Nasdaq Savages Non-repaint indicator works on all timeframes 1 minute to 15 minutes timeframe for scalpers. 30 Minutes to Monthly timeframe for swing traders The Nasdaq Savages indicator comes with a top right info tab which tells you about the current buy or sell signal, Profit in pips, Stop loss and Target Red arrow is your sell entry signal the white right tick is your exit signal and take profit hit signal Light blue arrow is your buy entry signal the white right tick is your exit signal an
Le MetaTrader Market est la seule boutique où vous pouvez télécharger un robot de trading de démonstration gratuit pour le tester et l'optimiser à l'aide de données historiques.
Lisez l’aperçu de l'application et les avis d'autres clients, téléchargez-la directement sur votre terminal et testez un robot de trading avant de l'acheter. Seul MetaTrader Market vous permet de tester gratuitement une application.
Vous manquez des opportunités de trading :
- Applications de trading gratuites
- Plus de 8 000 signaux à copier
- Actualités économiques pour explorer les marchés financiers
Inscription
Se connecter
Si vous n'avez pas de compte, veuillez vous inscrire
Autorisez l'utilisation de cookies pour vous connecter au site Web MQL5.com.
Veuillez activer les paramètres nécessaires dans votre navigateur, sinon vous ne pourrez pas vous connecter.