Dashboard RSI Multicurrency
- Indicateurs
- Version: 5.70
- Mise à jour: 19 juillet 2026
- Activations: 10

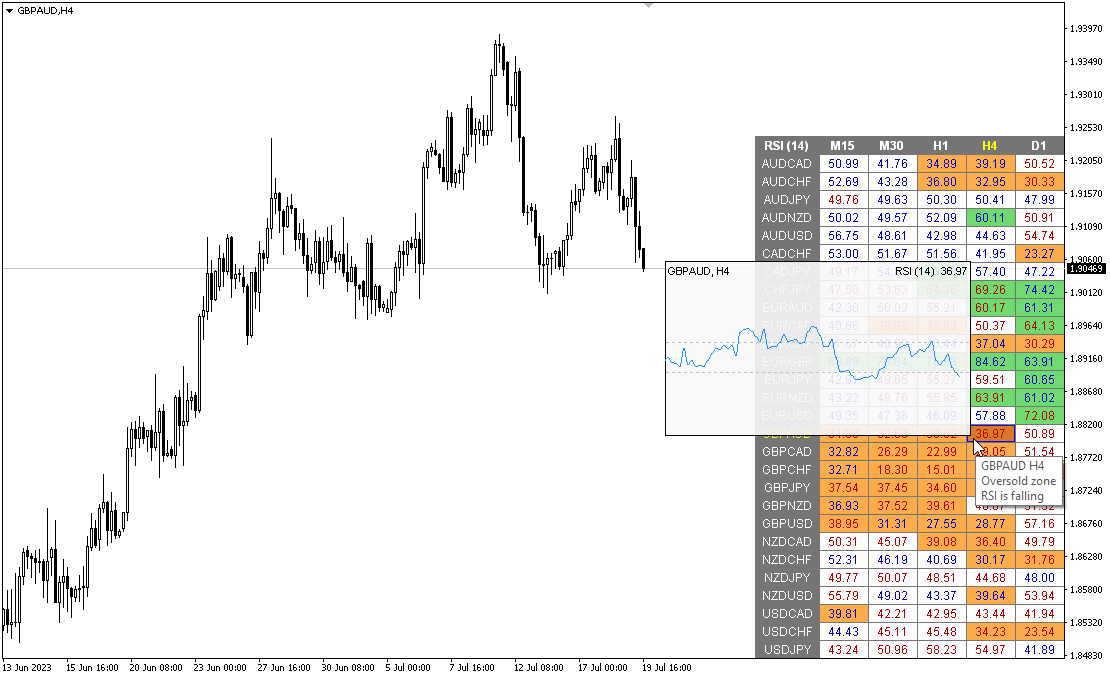
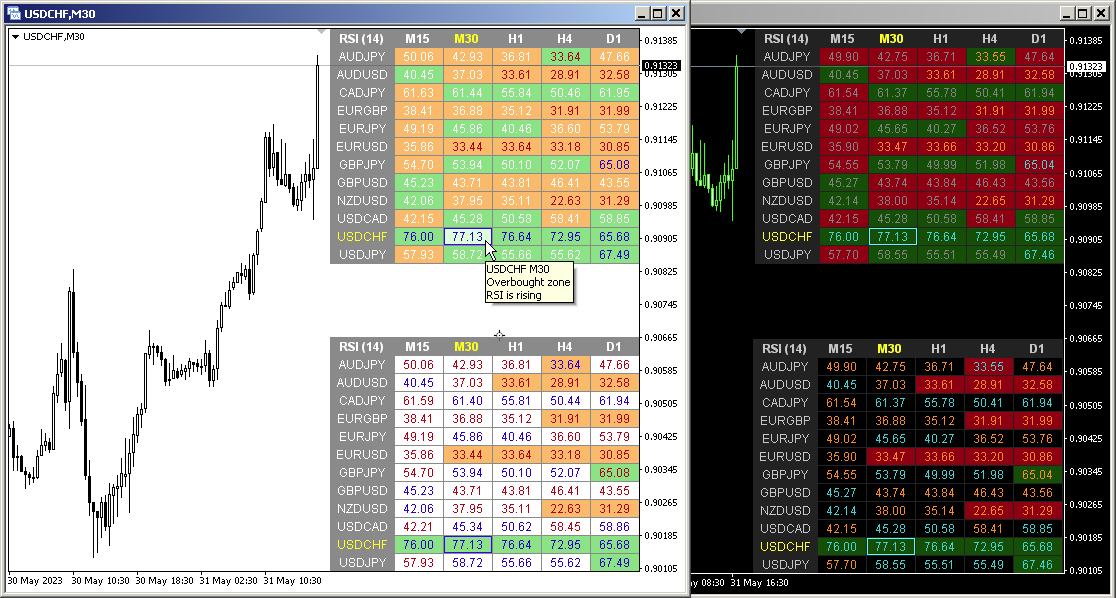
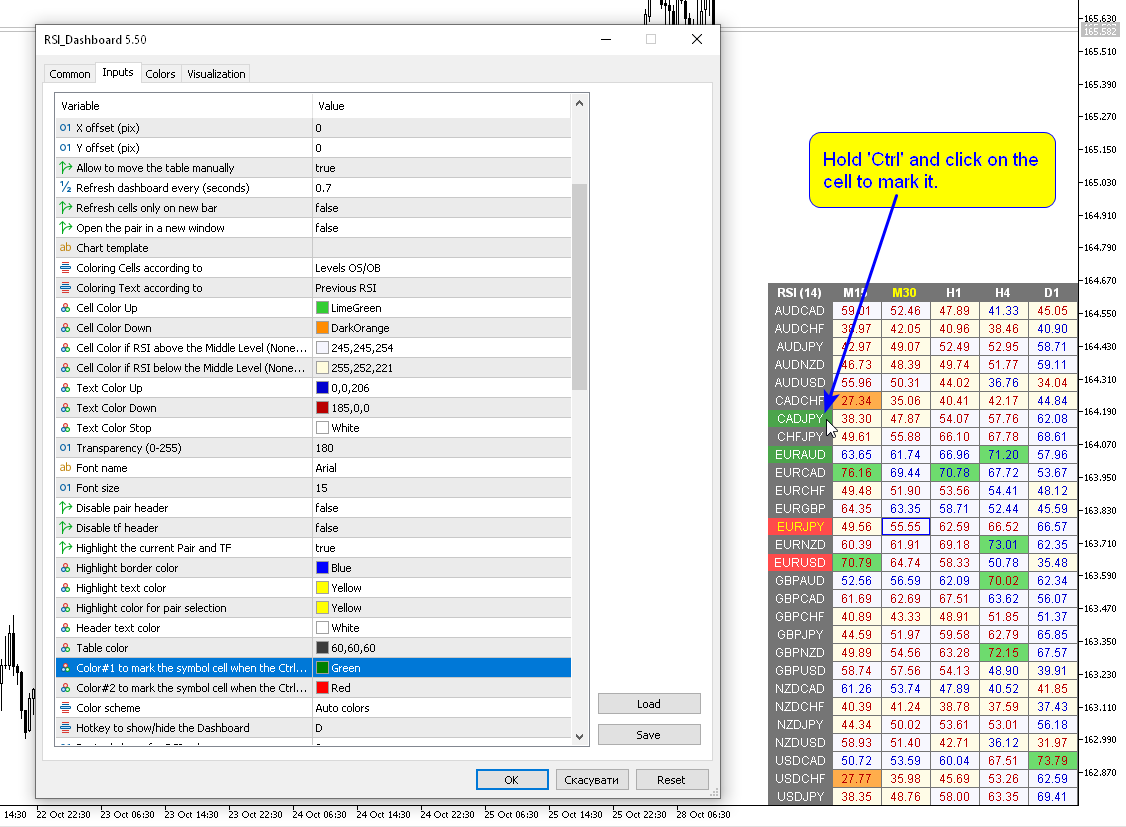
Modification multidevises et multitemporelles de l’indicateur Relative Strength Index (RSI). Vous pouvez spécifier les devises et les délais souhaités dans les paramètres. En outre, le panneau peut envoyer des notifications lors du franchissement des niveaux de surachat et de survente. En cliquant sur une cellule avec un point, ce symbole et ce point seront ouverts. Il s'agit du scanner MTF.
La clé pour masquer le tableau de bord du graphique est "D" par défaut
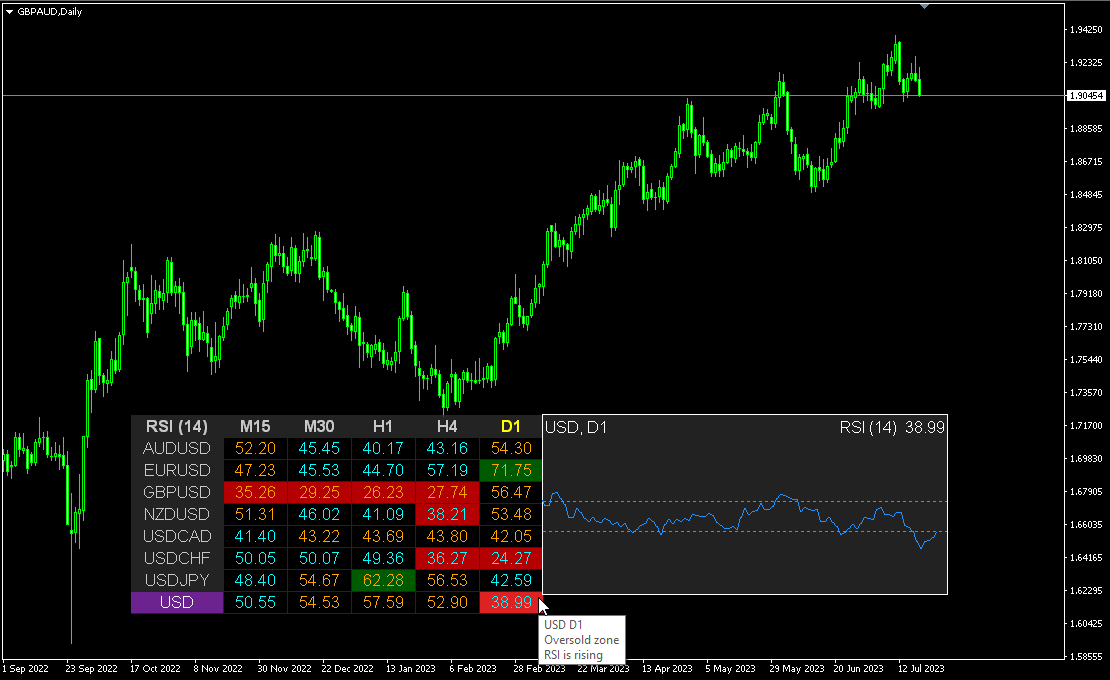
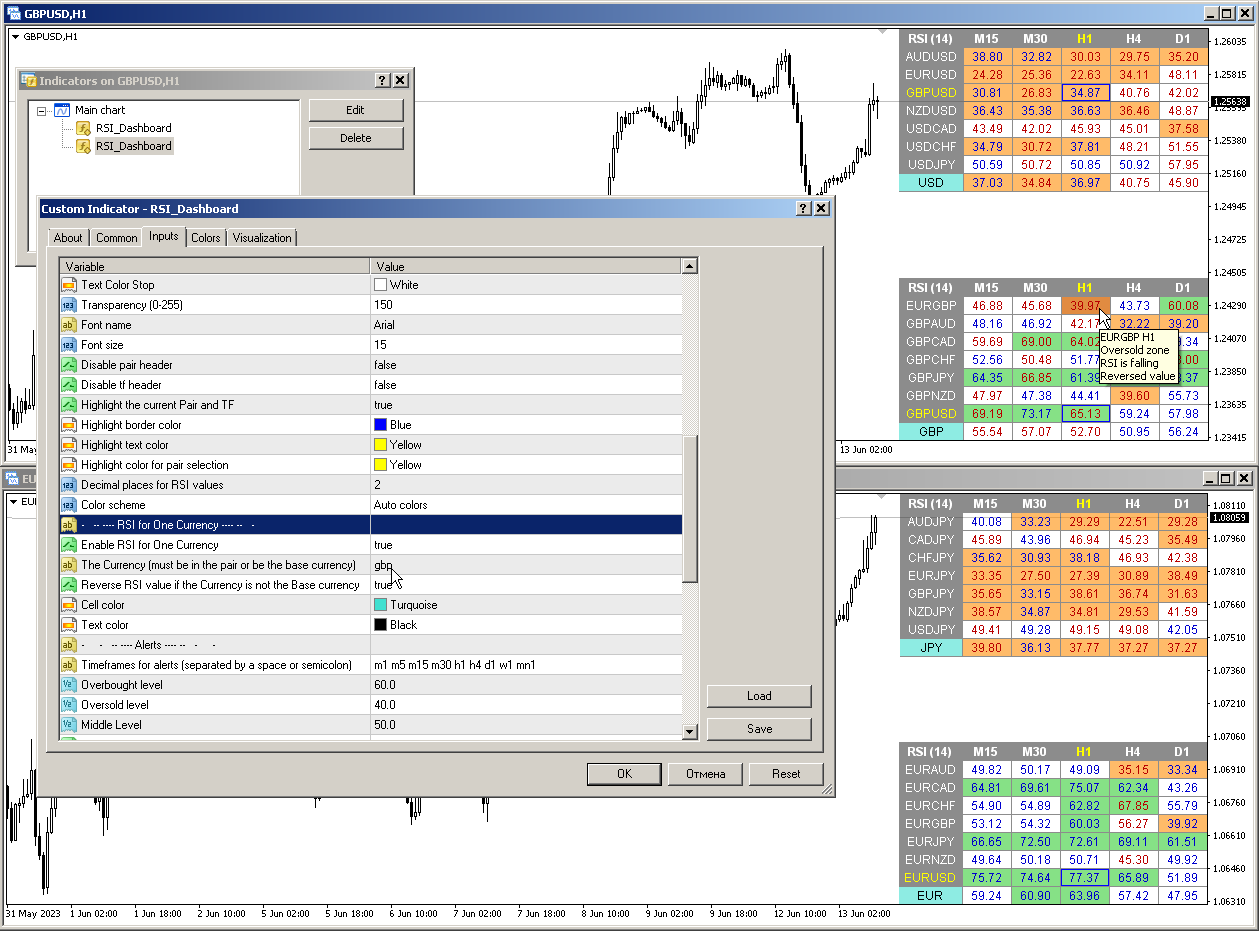
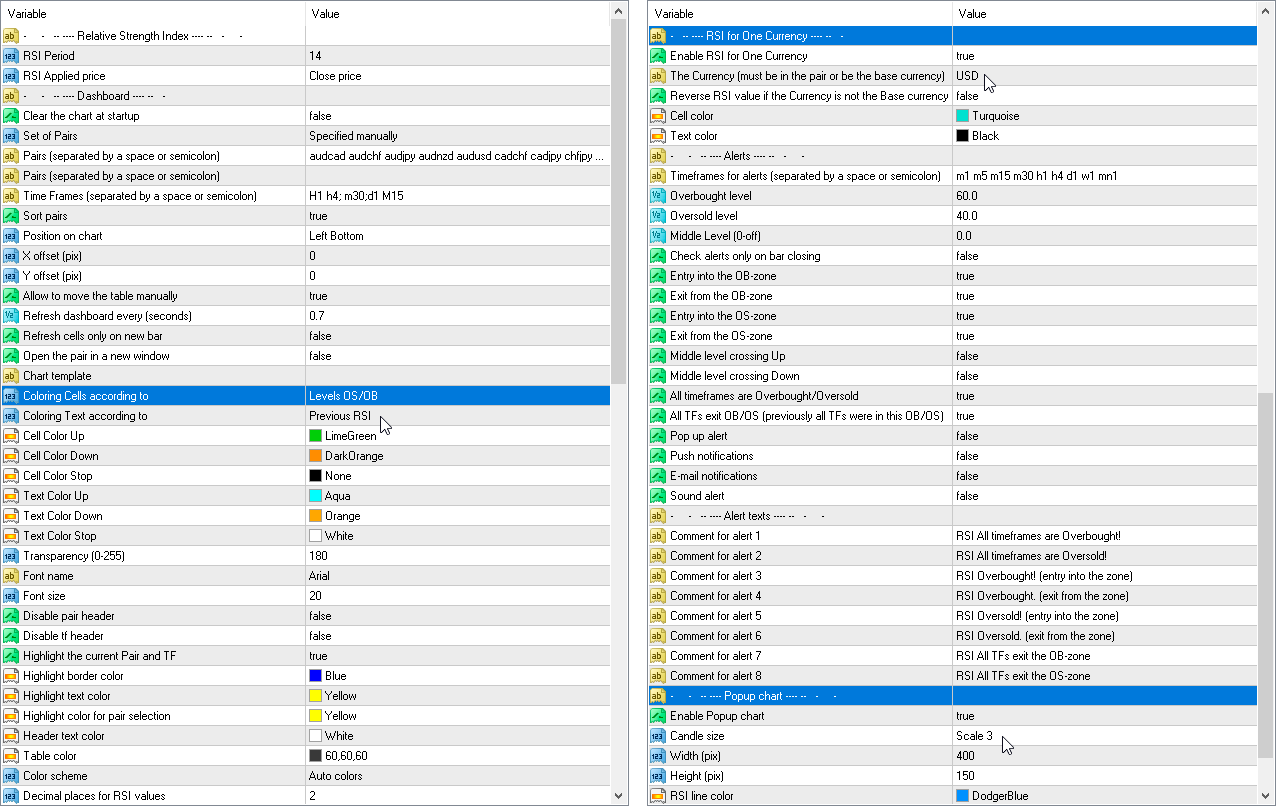
Semblable au Currency Strength Meter (CSM), le tableau de bord peut sélectionner automatiquement les paires qui contiennent une devise spécifiée, ou les paires qui ont cette devise comme devise de base. L'indicateur recherche la devise dans toutes les paires spécifiées dans « Ensemble de paires » ; les autres paires sont ignorées. Et sur la base de ces paires, le RSI total pour cette devise est calculé. Et vous pouvez voir à quel point cette monnaie est forte ou faible.
Paramètres
RSI Period — période de moyenne.
RSI Applied price — type de prix.
Clear the chart at startup — effacez le graphique au démarrage
Set of Pairs — ensemble de symboles
— Market Watch — Paires de "Market Watch" du MT.— Specified manually — paires spécifiées manuellement, dans les paramètres "Paires".— Current pair — affiche uniquement la paire actuelle.
Pairs (separated by a space or semicolon) — liste de symboles séparés par des espaces ou des points-virgules. Les noms des devises doivent être écrits exactement comme ceux du courtier, en conservant la casse et le préfixe/suffixe.
Time Frames (separated by a space or semicolon) — liste de délais séparés par des espaces ou des points-virgules (multi-périodes).
Sort pairs — trier la liste des paires.
Position on chart — coin pour afficher le panneau sur la carte.
X offset (pix) — décale le panneau le long de l'axe X ;
Y offset (pix) — décale le panneau le long de l'axe Y ;
Refresh dashboard every (seconds) — période de mise à jour pour toutes les paires et toutes les périodes.
Refresh cells only on new bar — les mises à jour des cellules (et les alertes) ne se produiront que lorsqu'une nouvelle barre apparaîtra.
Open the pair in a new window — ouvrez un symbole dans une nouvelle fenêtre graphique en cliquant.
Chart template — nom du modèle du graphique, si le graphique s'ouvre dans une nouvelle fenêtre.
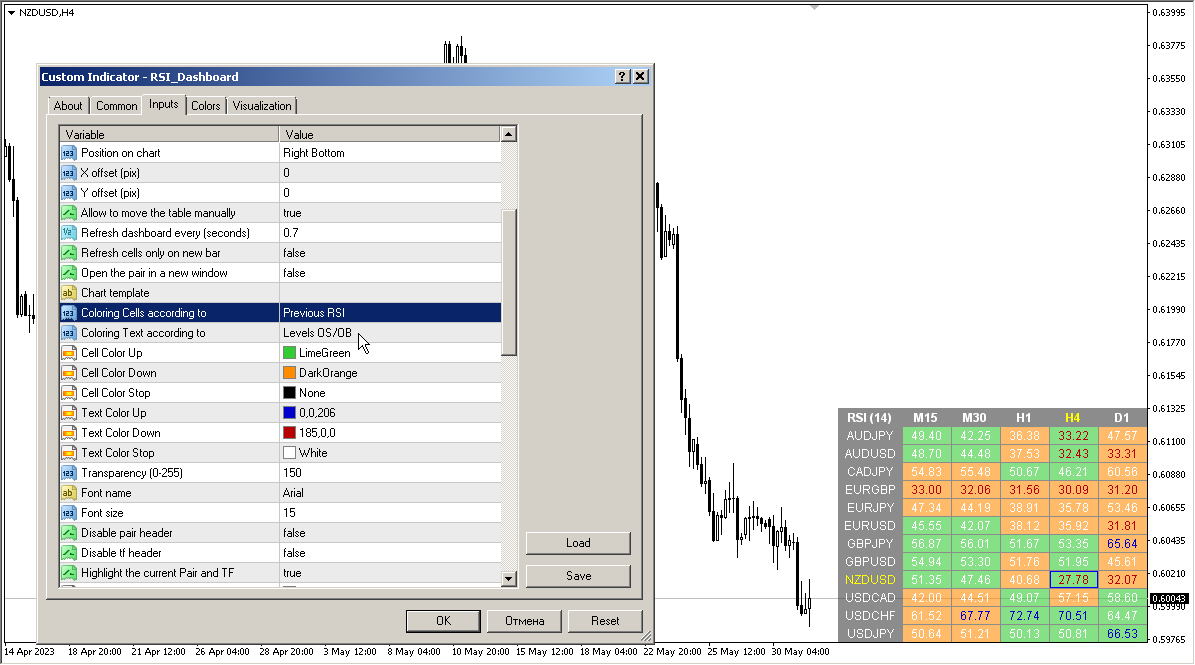
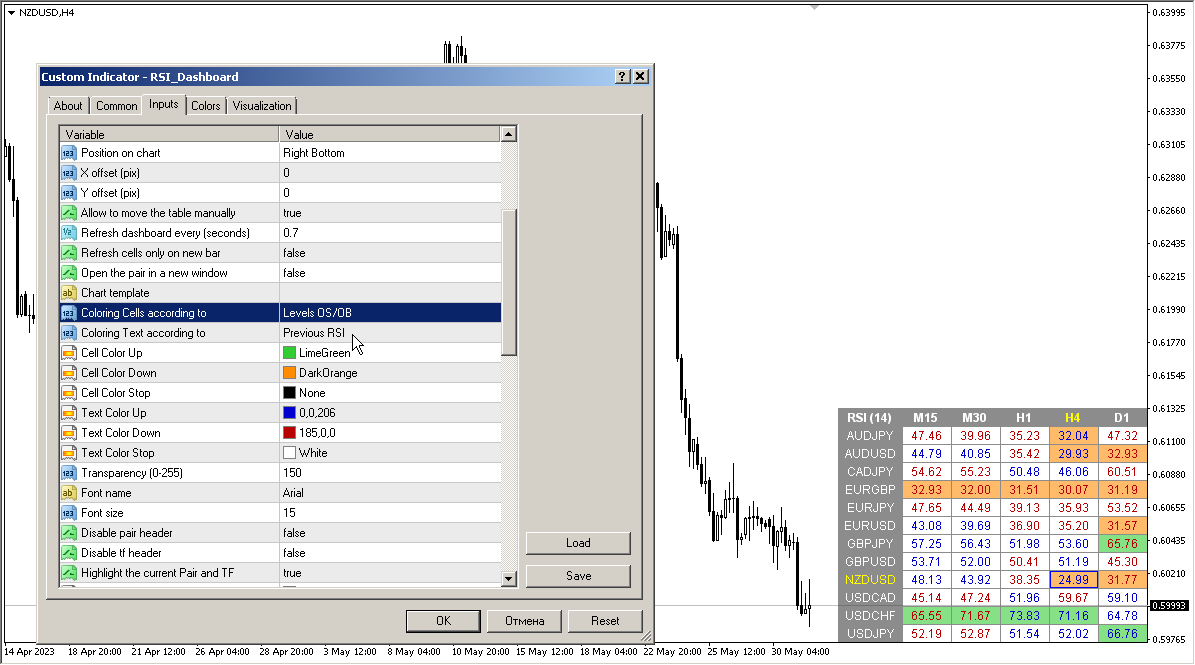
Coloring the cells according to the — peindre les cellules du tableau selon les niveaux de surachat/survente ou selon le sens de la bougie précédente.
Color Up — couleur des cellules si l'indicateur augmente.
Color Down — couleur des cellules si l'indicateur diminue.
Color Stop — couleur des cellules si l’indicateur ne change pas.
Transparency (0-255) — transparence du panneau.
Font name — nom de la police.
Font size — taille de la police.
Alertes
Timeframes for alerts (separated by a space or semicolon) — liste des périodes pour lesquelles l'alerte sera envoyée (séparées par un espace ou un point-virgule).
Overbought level — niveau de surachat pour les alertes.
Oversold level — niveau de survente pour les alertes.
Middle Level — Niveau moyen
Check alerts only on bar closing — Vérifiez les alertes uniquement à la fermeture du bar – vérifiez le passage à niveau uniquement après la fermeture du bar.
Entry into the OB-zone — Entrée dans la zone OB
Exit from the OB-zone — Sortie de la zone OB
Entry into the OS-zone — Entrée dans la zone OS
Exit from the OS-zone — Quitter la zone OS
Middle level crossing Up — Passage à niveau intermédiaire
Middle level crossing Down — Passage à niveau intermédiaire Down
Alert when RSI direction changes — Alerte lorsque la direction RSI change
All timeframes are Overbought/Oversold — Tous les délais sont surachetés/survendus
All TFs exit OB/OS (previously all TFs were in this OB/OS) — Tous les TF quittent OB/OS (auparavant, tous les TF étaient dans cet OB/OS)
Pop up alert — alerte pop-up.
Push notifications — notification push.
E-mail notifications — notification par e-mail.
Sound alert — alerte sonore.


hello I have RSI dashboard and Stochastic dashbord. I need something for alert system. I really like your dashboards. But I need something more useful. If you can add it I will be very happy.. Example: When the RSI is over 70 on the H1 and at the same time The RSI is under the 30 on the M1 , Can be an alert for it ? When the RSI is under 30 on the H1 and at the same time The RSI is over the 70 on the M1 , Can be an alert for it ? I mean that when a timeframe is over 70 and the other timeframe is under 30 , there will be an alert for it