Regardez les tutoriels vidéo de Market sur YouTube
Comment acheter un robot de trading ou un indicateur
Exécutez votre EA sur
hébergement virtuel
hébergement virtuel
Test un indicateur/robot de trading avant d'acheter
Vous voulez gagner de l'argent sur Market ?
Comment présenter un produit pour qu'il se vende bien
Indicateurs techniques pour MetaTrader 4 - 124

The system automatically draws resistance and support lines, The system automatically draws resistance and support lines, so you can see at a glance the price range where you are most likely to encounter resistance. Therefore, you can trade in price zones where you are less likely to encounter resistance.
We are live-streaming the actual operation of the system. Please check for yourself if it is usable. Please check it out for yourself. https://www.youtube.com/@ganesha_forex
We do not guaran

Based on the Dow Theory, the system automatically draws a turning point, which is the starting point for buying or selling. It also automatically tells you whether the market is in a buying or selling condition and recognizes the environment. It is also a good tool to prevent false trades and to make profitable trades.
We are live-streaming the actual operation of the system. Please check for yourself if it is usable. Please check it out for yourself. https://www.youtube.com/@ganesha_forex
We

Check My Product Contact me to discover all my services
Supply and demand zones are one of the most basic things a beginner forex trader learns. These zones are so important, price reacts off of them even after years since they first developed. And with the supply and demand zones indicator, a forex trader might not need to worry about drawing all these historical zones one after the other.
The supply and demand zone indicator accurately draws the supply and demand zones of a currency pair o

Fractal Advanced - displays Fractal and Alligator indicators on the price chart. Has wide options for settings and customization. It is also equipped with alerts and a hotkey system. Manual (Be sure to read before purchasing) | Version for MT 5 Advantages
1. The indicator does not fill the entire chart with fractals, but allows you to display only relevant signals. 2. The number of fractals is adjusted by scrolling the mouse while holding down the Shift key. 3. Instantly show/hide the Alligator

Fibonacci Currency Strength Meter (FCSM) Early Access Sale!!
This new product is still in the process of adding new features and settings. For early bird buyers. The Price will be 50% Sale. In a few weeks, the product will be done. Go Grab your copy while it's still cheap. More details will be added soon. Things to be added. Alert Levels Mobile and Email Alert
From it's name, Fibonacci Currency Strength Meter is a combination of Fibonacci levels and Currency Strength Meter. The plot of Fibona

Introducing the "Extreme Exhaustion Levels": A powerful tool for traders looking to identify market exhaustion and potential trend reversals. The Exhaustion Indicator is an advanced technical analysis tool that helps traders identify when markets are overbought or oversold, potentially indicating an imminent reversal in the trend. With a unique combination of price action, moving averages, and Bollinger Bands, the Exhaustion Indicator provides traders with a comprehensive view of market condit
Check My Product
Contact me to discover all my services
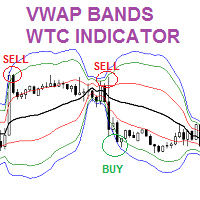
The VWAP Volume weighted Average Price Bands indicator is similar to the Moving Averages and Bollinger bands. In this indicator, more weight is given to the volume. The indicator provides great insight on support and resistance levels in the chart. Moreover, the indicator shows the fair value of a trading instrument. Thus, enabling forex traders to identify great trading opportunities to BUY LOW and SELL HIGH. Forex traders can combine t

If you are using naked eyes to find candlestick patterns on your chart it's a good thing but it requires your time and attention and still you miss some patterns here and there. Don't worry! This indicator will help you to find "Harami Candlestick Pattern" on your chart very easily. *Note: Default inputs are set for EURUSD H1 (1 hour) timeframe. This is an alert system which gives you alerts whenever harami candlestick pattern happens. Types of alerts it can give you are: 1. Audible Alerts -
What you get upon purchase:
-Lifetime support for the use of the system - Easy to use, clean user friendly interface with no single settings required - Arrow Signals showing where to buy and sell -Visual Arrows, Sound Alert, Email and sms alert functionalities - Customizable colors and sizes -Lifetime Updates - Both Trend and breakout signals -Appropriate signals for both Entry levels, Take profit levels and stop loss Preferred timeframe is 15 MINUTES ACCURATE SIGNALS WITH SIMPLE AND USER FR

GPT Candlestick T he Indicator show algorithm of Candlestick Automatically. GPT Candlestick is a MetaTrader 4 Indicator that uses a proprietary algorithm based on Price of Moving Average and Average True Range to show the Color of Candlestick on your trading. Means candlestick is going Up or Down (View Simply). I nstead, it analyzes data of market and identify entry points and opportunities. I t's also a trading tool that be used to practice and enhance your manual trading skills. GPT Candlestic

Introducing our A.I Currency Strength Meter Forex Indicator, a state-of-the-art tool designed to provide forex traders with real-time insights into the strength of various currencies. Leveraging the latest advancements in artificial intelligence and machine learning, this innovative indicator analyzes market data in real-time, providing users with accurate and up-to-date information to inform their trading decisions. In addition to its cutting-edge algorithms, the Currency Strength Meter Forex I
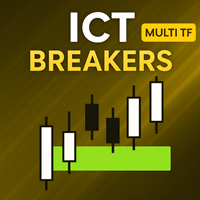
[ MT5 Version ] [ Order Blocks ] [ Kill Zones ] [ SMT Divergences ] How to trade using Order Blocks : Click here User Interface Performance: During testing in the strategy tester, the UI may experience lag. Rest assured, this issue is specific to the testing environment and does not affect the indicator's performance in live trading. Elevate your trading strategy with the Order Blocks ICT Multi TF indicator, a cutting-edge tool designed to enhance your trading decisions through advanced orde

With PA analyzer you will see a different perspective of price action , once you have unlocked the full potential of it, this tool will be essential part of your trading system. PA Analyzer enables market price analysis and automatically marks support and resistance in all time frames. This indicator makes it easy to see whether the price is in range or trend, and generates dynamic profit take targets for the current time frame and the next higher time frame. This allows you to find target con

Forex 3D est un système de trading prêt à scalper sur n'importe quelle paire de devises. Délai recommandé M5. Le nombre moyen de transactions que nous pouvons ouvrir chaque jour est de 5 à 15. Ce système de trading convient au trading sur toutes les paires de devises, y compris l'or et l'argent. Forex 3D est un système de trading très simple adapté aux débutants en forex. Il ne nécessite pas d'analyse de marché supplémentaire à l'aide d'autres instruments de négociation. Nous pouvons nous conce
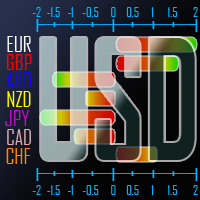
Versus USD calcule la variation de prix de chaque devise majeure contre le USD et affiche une vue claire et comparative de leur performance pour chaque période ou bar indexée par le curseur dans le Timeframe actuel du graphique avec des barres de progression. De plus, il marque une flèche sur la bar/période où la devise en question a connu le taux de changement le plus élevé ou le plus faible face au USD par rapport aux autres devises, offrant ainsi une mesure plus précise de la performance de l
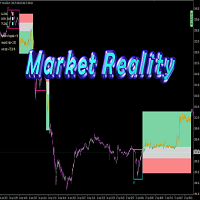
Hello, As you know more than 90% of people in the financial markets are losers, the most important reason is the lack of a proper fixed system and risk management. I want to introduce you to an indicator that is the result of my 8 years of experience, which shows you the reality of the market. My human dignity does not allow me to guarantee the future, but the table below shows the past statistics of this indicator and its performance which really the market past is the only way to find out the
L'indicateur de scalping Forex, basé sur les points d'inversion des prix des flèches, est l'un des outils avancés pour le trading sur les marchés financiers. Il offre aux traders la possibilité de réagir rapidement aux changements du marché et de prédire avec précision la direction future du mouvement des prix. L'indicateur est basé sur l'utilisation d'algorithmes et de technologies modernes qui vous permettent de calculer rapidement les points d'inversion des prix sur le graphique. Chaque poin
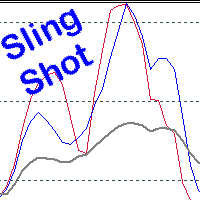
Scalping, Mean reversion or Position trading strategy
Get into an established trend on a pullback in the market. Use the Pinch in the indicator for profit taking. Use the Pinch as a mean reversion strategy, scalping back to a moving average line.
Input Parameters Fast Sling Shot configuration. Slow Sling Shot configuration. Dual Sling Shot configuration. Price line configuration. Trigger zones or levels. Example of Sling Shot trade idea: Price line sets the mood, below the baseline leve
Découvrez BreakOut Consult, l’outil révolutionnaire qui fera passer votre trading au niveau supérieur !
Notre algorithme de pointe combine plusieurs indicateurs de tendance et oscillateurs pour générer des signaux d’achat et de vente précis, en faisant un outil puissant pour tous les types de traders. Avec BreakOut Consult, vous pouvez facilement identifier les cassures du marché grâce à notre canal dynamique, basé sur les niveaux de support et de résistance. Notre algorithme détecte deux ty
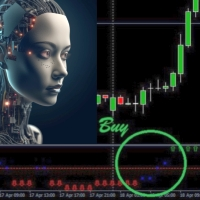
Introducing Trend Fusion 444F, a powerful MQL4 indicator designed to determine market direction using multiple trading indicators. This comprehensive tool offers a unique fusion of technical analysis techniques that help traders make informed decisions in various market conditions. Key Features: Comprehensive Analysis: Trend Fusion 444F combines several widely-used trading indicators to provide a multi-dimensional view of the market. The indicators include Moving Averages, MACD, RSI, DeMarker,

The Go Master trend indicator finds the current trend based on many factors. A simple and convenient indicator. The user can easily see the trends. It uses the basic trading approach widely described in the trading literature.
This is the first indicator designed to detect fluctuations in the direction of the trend and possible reversals. It works using a special algorithm and a set of internal indicators. You can use this indicator alone or in combination with other indicators according to yo
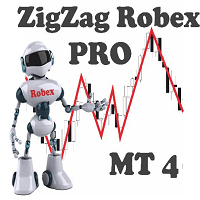
Intelligent ZigZag indicator.
It has only two settings. The higher the values, the more significant extreme values it shows.
Application area.
To determine the trend. Line drawing direction.
To recognize multiple patterns.
If you put two indicators on one chart with fast and slow values. By changing the color of one of them, you can very well decompose the price movement into waves.
The indicator can be a great helper for marking the chart and identifying the key levels from which the pri

The "AI Forecast" indicator is the result of a unique experiment in which I asked an AI how to create the best indicator to anticipate the market. The AI suggested measuring the past history of the price and its reactions to different levels, and then calculating the probabilities of the price reaction in the future.
With this idea, I designed with the help of another AI the "AI Forecast" indicator, which adapts to any MetaTrader chart and shows you three lines: one for entry and two for possi

All traders wait until the market calms down and only after that will they enter the market. They look at the monitor all the time. Now you no longer need to follow this, your best assistant will do it for you. You go about your usual business and calmly wait for the signal. And as soon as the spread reaches the value you set, you will receive an instant notification on your phone.
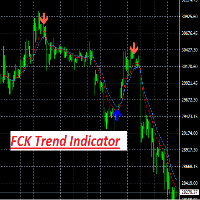
FCK Trend Indicator is an indicator for determining the current direction of price movement and reversal points. The indicator will be useful for those who want to see the current market situation better. The indicator can be used as an add-on for ready-made trading systems, or as an independent tool, or to develop your own trading systems. FCK Trend Indicator indicator, to determine the reversal points, analyzes a lot of conditions since the combined analysis gives a more accurate picture of t

Supply and Demand Indicator + FREE Currency Strength Meter ADD-ON Looking for a powerful tool that can help you identify the most reactive zones in the forex market? Our supply and demand indicator for MetaTrader 4 and 5 is exactly what you need. With its advanced algorithms and real-time analysis, this indicator helps traders of all experience levels make informed trading decisions. The supply and demand indicator is a cutting-edge tool that helps traders identify areas where buyers and seller
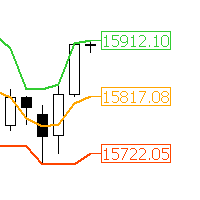
"AV Donchian Channel" is an indicator for MetaTrader 4, which shows the current prices of the donchian channels and the middle line.
Multiple AV Donchian Channel indicators can be placed on one chart. The center line can be used for trailing.
See also Richard Dennis Turtle Trader strategy.
Settings:
- Donchian Channel Period
- Colors and widths of the lines
- Colors and widths of price labels
Please report bugs to me.

Considering the main theories of Forex (Dow Theory, support lines, chart patterns, and Fibonacci retracements), It tells you the price range where whales (large investors) are likely to appear. You can trade at the price points that professionals also aim for. You no longer have to warry about where to aim next.
We are live-streaming the actual operation of the system. Please check for yourself if it is usable. Please check it out for yourself. https://www.youtube.com/@ganesha_forex
We do not
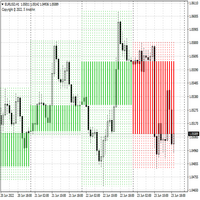
Aligning higher time frames for trading One of the main concepts behind the beginner strategy is multiple time frame analysis – using a higher time frame to determine the overall market direction and executing trades on a lower time frame. By determining the overall direction on a higher time frame and trading in that direction, you make sure that you trade in the direction of the overall trend – this increases your chances of profitable trades. In the beginner strategy, you use the 30 minute ch
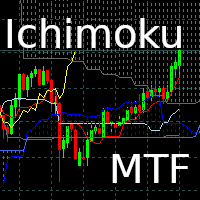
Ichimoku Hinko Hyo MTF
L'indicateur Ichimoku Hinko Hyo MTF permet de superposer plusieurs indicateurs Ichimoku (provenant de base de temps différentes) sur un même graphique.
Cette représentation permet une meilleure lecture du marché, l'utilisateur ayant à sa disposition les informations en provenance de plusieurs bases de temps.
L'utilisateur peut sélectionner les courbes qu'il souhaite voir s'afficher (Tenkan, Kijoun, Chikou, Kumo)
Dans cette version 1.0, il est possible : Pour un graphe en

We teach trading with this indicator for free in our channel: https://www.mql5.com/en/channels/scalpm1period
Scalping arrow indicator M1 is an arrow signal indicator for scalping on the M1 timeframe. It draws the price reversal points on the chart for the trader and does not redraw them. The indicator shows the trader when is the best time to open a trade and in what direction. After the indicator has determined the price reversal point, it draws a red or blue arrow on the chart. These arrows
As traders, we know that identifying price contractions and consolidations is crucial for profitable trading. Fortunately, we have a powerful tool at our disposal. The indicator to trade price consolidation is designed to identify price contraction and alerts us on formation. It does this by analyzing historical price data and identifying price action patterns. The algorithm then uses this information to mark the zone , potential targets and liquidity lines, giving us valuable insights into mark
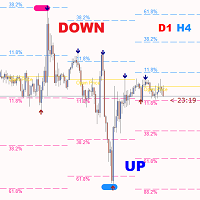
Gold ATR MTF - il s'agit d'un bon indicateur technique boursier. L'algorithme de l'indicateur ATR (Average True Range) analyse l'évolution du prix de l'actif et reflète la volatilité en dessinant les niveaux correspondants dans des pourcentages spécifiés (%) du prix d'ouverture de la période spécifiée (D1). Les indicateurs (rouge et/ou bleu D1 H4) de la direction du mouvement des prix du symbole et les signaux fléchés sont des aides supplémentaires et essentielles pour un trading intrajournal

OFFER! OFFER ! After 3 weeks the unlimited price will be 500$ and in the future you will regret why you didn't make a purchase at this lowest price. Dear Traders, the atomic power Entries Indicator is one of the indicators that if used wisely and correctly can help you to find an edge over the market. The indicator will work for all forex pairs, all markets and all timeframes. Still it is your duty to find the most effective timeframe for you. When the sell or buy arrow appears you will get a

Présentation d'Auto Trendline, l'indicateur MT4 innovant qui automatise le processus de
dessin des lignes de tendance sur vos graphiques. Dites adieu à la tâche fastidieuse et fastidieuse de dessiner manuellement les lignes de tendance,
et laissez Auto Trendline faire le travail pour vous !
* Contactez-moi après l'achat pour vous envoyer des instructions et un guide étape par étape.
Grâce à son algorithme avancé, Auto Trendline détecte et dessine automatiquement des lignes de tendance po
Presenting the SMT Divergence indicator, a versatile tool designed to aid in analyzing market dynamics.
The indicator helps identify divergences between the highs and lows of two correlated major currency pairs during specific market periods ("killzones" abbrev. KZ). These periods are characterized by increased market activity, allowing traders to observe market behavior more closely.
The indicator provides customizable options to adjust time settings and visually display the divergences and

Instantly spot simple candlestick patterns with MSHT Price Pattern
MSHT PRICE PATTERN can automatically detect more than 200 different candlestick patterns, including multi-candle patterns. This makes it easy for you to see if what you care about is present on a chart or not at a glance, and reduces the amount of time you have to stare at charts to check off items on your investment checklist. Candlestick Pattern Recognition is supported on charts, alerts, in scanners and smart checklists.
All
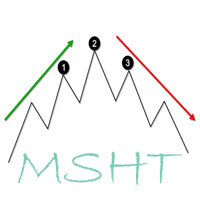
MSHT Head&Shoulders indicator for MT4 automatically scans the chart for head and shoulders candlestick patterns. Obviously, the scanner shows the Symbol, Timeframe, Direction, Pattern Name, Age, and Chart time frame in which the head and shoulders pattern is identified. Furthermore, the scanner displays the inverted head and shoulders pattern also. So, forex traders can BUY or SELL based on the head and shoulders candlestick pattern. Additionally, the indicator also scans and plots emerging head

Special Entry Arrow indicator is designed for signal trading. This indicator generates trend signals.
It uses many algorithms and indicators to generate this signal. It tries to generate a signal from the points with the highest trend potential.
This indicator is a complete trading product. This indicator does not need any additional indicators.
The indicator certainly does not repaint. The point at which the signal is given does not change.
Features and Suggestions Time Frame: H1 Wo

The best instrument for scalping. It allows you to always be correctly positioned in the price. It's a simple and extraordinarily powerful visual reference. Very suitable for price action. It consists of four components. 1. Fork. There are two levels that surround the price and mark the rebound points. They can be varied independently with 4 associated controls, two for each level. Its amplitude is indicated in pips in the indicator data. The minimum fork is updated with each tick. It has
Économisez du temps et prenez des décisions plus précises avec Sweet VWAP Aux Si vous n'avez pas encore téléchargé notre indicateur VWAP gratuit pour Metatrader 4 , faites-le maintenant et découvrez ses incroyables capacités de visualisation de VWAP ancrées. Ensuite, revenez ici et découvrez Sweet VWAP Aux - l'extension parfaite pour votre indicateur Sweet VWAP. Avec un simple clic, Sweet VWAP vous permet de fixer cet indicateur VWAP au point de votre choix, en économisant du temps et en élimina

Credible Cross System indicator is designed for signal trading. This indicator generates trend signals.
It uses many algorithms and indicators to generate this signal. It tries to generate a signal from the points with the highest trend potential. The indicator works based on instant price movements. This indicator is a complete trading product. This indicator does not need any additional indicators.
The indicator certainly does not repaint. The point at which the signal is given does not c
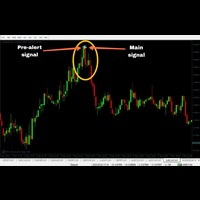
This Indicator has a accuracy in between 80-90% but it will work one time in a day. The timing is (MT4 time 18:00 to 18:05) Tickmill, Alpari, Amarket MT4 recommended. Although it will work on most of the MT4.
MT2 Auto trading supported: Buy buffer = 2 // Sell buffer = 3
Intrabar
Candle TF = M1
Trade Expiry = 1 minute or 5 minutes
No martingale required, but if you wish then you can take 1 step martingale.
Features: Neural Network based Advance price action algorithms Advance consolidation fi
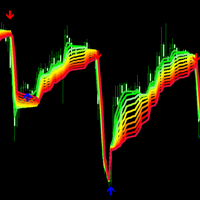
"Gradient adaptive rsi mt4" - indicateur de forex adaptatif RSI, qui s'affiche sur le graphique des prix sous forme de gradient. Cet indicateur aide le trader à déterminer la direction de la tendance actuelle, la force de la tendance, les points d'inversion de tendance. "Gradient adaptive rsi mt4" - créé pour la plate-forme Metatrader4 et peut fonctionner sur toutes les paires de devises et tous les délais. À l'aide de paramètres, cet indicateur "Gradient adaptive rsi mt4" peut être adapté pour

Nice Stable Arrow indicator is designed for signal trading. This indicator generates trend signals.
It uses many algorithms and indicators to generate this signal. It tries to generate a signal from the points with the highest trend potential.
This indicator is a complete trading product. This indicator does not need any additional indicators.
The indicator certainly does not repaint. The point at which the signal is given does not change. Signals are sent at the beginning of new candles.
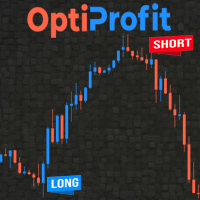
This indicator is a unique, high quality and affordable trading tool. The calculation is made according to the author's formula for the beginning of a possible trend.
An accurate MT4 indicator that gives signals to enter trades without redrawing! Download EA for this indicator https://www.mql5.com/ru/market/product/98089 Ideal trade entry points for currencies, cryptocurrencies, metals, stocks, indices! The indicator builds buy/sell arrows and generates an alert. Graphically displays the entr
Introducing our groundbreaking Forex indicator, specifically designed to help traders master the art of identifying critical support and resistance zones, as well as double top and double bottom patterns with unprecedented accuracy. Say goodbye to guesswork and hello to a powerful tool that will revolutionize your trading experience. Our proprietary indicator leverages cutting-edge technology to recognize key price levels where buying and selling pressures are poised to shift the market dynamic
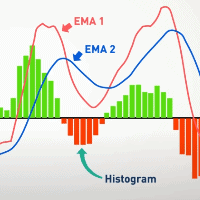
"Macdio trigger forex indicator for mt4" is a technical indicator that is used in trading on the foreign exchange market to determine when to enter and exit a position. This indicator is based on the signals received from the MACD indicator, which is one of the most popular indicators in technical analysis. The "Macdio trigger forex indicator for mt4" indicator can also be used to identify support and resistance levels, as well as identify overbought and oversold markets. If the indicator is in
L'indicateur "indicateur de marché neutre Mt4" avec des flèches indique les points d'inversion des prix. Les lignes indiquent la direction de la tendance ou de la correction. Si vous regardez attentivement le graphique, vous pouvez facilement remarquer que la précision des flèches est assez élevée. L'indicateur montre bien les signaux sur toutes les périodes et paires de devises. Lorsque cet indicateur a été créé en conjonction avec ChatGPT. Tout au long du travail d'écriture de cet indicateur,

Based on data from the Bank for International Settlements, 78.8% of the world's major 8 currency pairs can be checked instantly. It tells you whether the U.S. dollar is being bought or sold in a matter of seconds. So, even in the fast-moving phase after the release of economic indicators, you can see the flow and pushes of the U.S. dollar,
We are live-streaming the actual operation of the system. Please check for yourself if it is usable. Please check it out for yourself. https://www.youtube.c
DAO CODE CACHÉ FX Cette offre est unique. Nous n'avons pas cherché le Saint Graal dans le delta de l'Amazone ni déterré un tombeau égyptien. Nous avons monté un entrepôt et commandé des indicateurs à des programmeurs. Sous un concept qui a été peu remarqué, tout le monde sauf Tesla. Et les anciens taoïstes. 1) Le concept logique est le suivant : · Le graphique boursier n'a que deux dimensions : la hausse ou la baisse, l'achat ou la vente. Deux vecteurs de mouvement. · Le gr
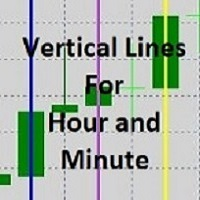
MT4 Indicator that puts up to 4 vertical lines for each selected hour and minute. Vertical line color and thickness are adjustable Input parameters: lineEnabled1 = true lineEnabled2 = true lineEnabled3 = true lineEnabled4 = true lineColor1 = Red lineColor2 = Blue lineColor3 = Green lineColor4 = Yellow lineTime1 = "12:00" lineTime2 = "14:00" lineTime3 = "16:00" lineTime4 = "18:00" lineWidth1 = 1 lineWidth2 = 1 lineWidth3 = 1 lineWidth4 = 1
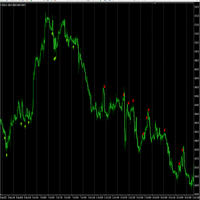
The MT4 trend arrow indicator is a powerful tool for technical analysis that will help traders determine the direction of the trend in financial markets. This indicator is based on the use of several mathematical algorithms and methods of price analysis, which allows you to give accurate and transparent signals to enter the market.
The working timeframe is H1.
The description of the indicator includes up and down arrows that indicate the future direction of price movement. In addition, the i

Using the Trend alternate indicator algorithm, you can quickly understand what kind of trend is currently developing on the market. The Trend Alternate Indicator accompanies lengths, can be used without instruments or timframes. With this indicator, you can try to predict future values. But the main application of the indicator is to generate signals for the purchase and sale. The indicator monitors the market trend with ignoring the sharp fluctuations in the market and the noise around the aver

Max Min Reversal Arrows - an arrow reversal indicator for predicting price movement. The indicator is built on the support and resistance levels at the local lows and highs of the price. Product features
Arrows appear on the current candle. The indicator does not redraw.
Can be used on all time frames and trading instruments. Recommended timeframes to use M30, H1, H4.
The dotted lines are the support and resistance levels within the signal. Price movement from these levels means a reversal.
Pr

hello friend, there is an active adx based indicator for binary options, it only operates on 1 currency (eurusd) on TF M1, it operates the signal on the next candle. indicator test results within 2 months are very satisfactory, accuracy exceeds 85%. very optimal run in markets that issue news (medium impact and high impact). so of course it is very optimal, only a 1 month and lifetime trial is available.For orders, please go to the telegram developer: https://t.me/AgresivetradingSupport (@agresi

Market Viewer gives a quick glance on correlation and direction. This indicator takes a list of symbols (max 8) Leave a symbol setting empty if you wish not to use that many - like in the defaults… It will check for each timeframe (Monthly, Weekly, Daily, H4, H1, 30min, 15min, 5min and 1min) if the current candle on that timeframe is bullish or bearish. This will give a good indication of the direction for us to trade in. We need to be in sync with the bigger timeframes.
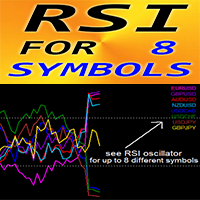
Indicateur Forex "RSI pour 8 symboles" pour MT4. Pas de repeinture.
- Le RSI est l'un des oscillateurs les plus populaires pour le trading. - Il est idéal pour prendre des entrées de vente à partir d'une zone de surachat forte (au-dessus de 70) et des entrées d'achat à partir d'une zone de survente forte (en dessous de 30). - Le RSI est très utile pour la détection des divergences. - "RSI pour 8 symboles" donne la possibilité de contrôler les valeurs RSI jusqu'à 8 symboles différents sur un se
A signal indicator marking buy/sell points. In this version, it is supplemented with optimal SL points. Recommended for use in conjunction with a trend indicator to filter signals. The indicator has only one adjustable parameter that determines its sensitivity, which greatly simplifies setting the indicator to the current market and the user's trading style. Indicator signals are given only after the full formation of the bar. The indicator can be used to trade any market. Its basic parameters p
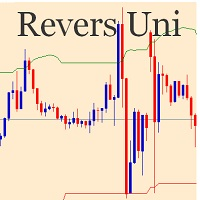
Индикатор разворота цены основанный на анализе трех таймфреймов. Когда вы выбираете параметр PERIOD, индикатор проводит рассчет по выбранному периоду и на два периода выше. Период М30 в рассчетах никак не участвует и его выбирать не рекомендуется. Максимальный верхний период для правильного рассчета применяйте не выше D1, т.к. в него уже войдут периоды W1 и MN. Период для установки индикатора выбирайте произвольно, а для более точного входа, я рекомендую М1,М5 и М15.

Real Trade Entry indicator is designed for signal trading. This indicator generates trend signals.
It uses many algorithms and indicators to generate this signal. It tries to generate a signal from the points with the highest trend potential.
This indicator is a complete trading product. This indicator does not need any additional indicators.
The indicator certainly does not repaint. The point at which the signal is given does not change. Signals are sent at the beginning of new candles.

PSI - индикатор скорости цены. Он основан на измерении длинны каждого поступающего тика в терминал. Таким образом мы можем понять насколько сильно (с какой скоростью) цена движется вверх или вниз, и видеть остановку движения цены.
При увеличенной тиковой скорости цены вверх (тики вверх имеют большую длину чем тики вниз) - индикатор показывает зеленую гистограмму, при увеличенной скорости цены вниз (тики вниз имеют большую длину чем тики вверх) - индикатор показывает красную гистограмму. Индикат

The Trend Engine indicator is good for any trader, suitable for any trader for both forex and binary options. Trend indicator, a revolutionary trend trading and filtering solution with all the important features of a trend tool built into one tool! You don’t need to configure anything, everything is perfected by time and experience, it works great during a flat and in a trend.
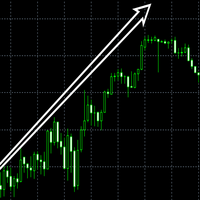
Absolute High Low indicator is a discretionary tool for assessing extremes in the price. It is very self-explanatory, and you can test against other default oscillators to see the difference. Combine with your trend following systems to master entry and exit at extremes. Back test and study the indicator to see the results up against a system or indicator. The indicator calculates a number of max bars so a gap will appear at the end, and it will restart. MT5 Version: https://www.mql5.com/en

Manuscript is a time-tested indicator, many tests have been conducted in its use, I will tell all buyers my recommendations on using forex, cryptocurrency or binary options
This indicator gives a signal exactly at the close of the candle of the selected period
The arrow does not disappear after the signal, you can set up email notifications
I recommend using it on the period H1,H4,daily If you are aware of its work, you will be able to trade in a plus
In the future I will give you my recomm

This all-in-one indicator displays real-time market structure (internal & swing BOS / CHoCH), order blocks, premium & discount zones, equal highs & lows, and much more...allowing traders to automatically mark up their charts with widely used price action methodologies. Following the release of our Fair Value Gap script, we received numerous requests from our community to release more features in the same category. //------------------------------------// Version 1.x has missing functions + PDAr
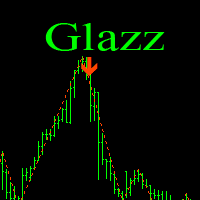
Glazz is a great mix of standard Bollinger Bands and ZigZag . The essence of the strategy - is the search for extreme points - possible reversals. When building a signal, we use Bands of a large period and a small ZigZag period. When the indicator has calculated the entire value for signal search, it shows an arrow to buy/sell and gives a sound signal. Simply put, ZigZag is looking for a possible reversal, and Bollinger Bands confirms this reversal.
The indicator settings are simple. By defaul

This indicator colors the price chart candles according to the data of the DSS Oscillator AM indicator. DSS Oscillator AM is the author's implementation of the Double Smoothed Stochastic oscillator developed by William Blau and Walter Bressert. The calculation of values is largely similar to the calculation of the classic stochastic oscillator. The indicator takes into account the location of the current price relative to local highs/lows. The signal about the change in the direction of price

The indicator offers a comprehensive suite of features for identifying key market areas, including: Supply Zones Demand Zones Fair Value Gaps (FVG) and provides alerts whenever price reaches a supply or demand zone. Key Features: Historical Zones: In addition to active zones, the indicator now includes historical supply, demand, and FVG zones, allowing for a deeper analysis of past price behavior. Flexible Zone Timeframes: Zones can be plotted independently of the chart's timeframe, enabling sce

A Clean and Easy to Use indicator, this indicator will Turn Lightblue when Price is Trending Up and LightRed when Price is Trending down. this indicator is one part of a set of three and when combined creates a full Trading Strategy. When used with Mint Channels and Mint RSi-CD you will take buy signals when price hits LightBlue upper channel and RSi-CD shows a LightBlue Bar Above Signal Line But only if Trend Indicator is Blue / if Price touches Bottom Red Channel and RSi-CD shows a red bar be
Le MetaTrader Market est un site simple et pratique où les développeurs peuvent vendre leurs applications de trading.
Nous vous aiderons à publier votre produit et vous expliquerons comment préparer la description de votre produit pour le marché. Toutes les applications de Market sont protégées par un cryptage et ne peuvent être exécutées que sur l'ordinateur de l'acheteur. La copie illégale est impossible.
Vous manquez des opportunités de trading :
- Applications de trading gratuites
- Plus de 8 000 signaux à copier
- Actualités économiques pour explorer les marchés financiers
Inscription
Se connecter
Si vous n'avez pas de compte, veuillez vous inscrire
Autorisez l'utilisation de cookies pour vous connecter au site Web MQL5.com.
Veuillez activer les paramètres nécessaires dans votre navigateur, sinon vous ne pourrez pas vous connecter.