Regardez les tutoriels vidéo de Market sur YouTube
Comment acheter un robot de trading ou un indicateur
Exécutez votre EA sur
hébergement virtuel
hébergement virtuel
Test un indicateur/robot de trading avant d'acheter
Vous voulez gagner de l'argent sur Market ?
Comment présenter un produit pour qu'il se vende bien
Indicateurs techniques pour MetaTrader 4 - 16

This indicator is the basis for an Expert Advisor that can be categorized as "almost Grail". See details below. This indicator displays the projection of the Renko chart on the price chart. This projection is displayed as a stepped line, not as "bricks" (rectangles). See slides 1 and 2. Abbreviated name of the indicator: LRC – L ine of R enko on the price C hart. The principle of its construction is very simple. First, a grid of horizontal lines (levels) is bu
FREE

WaPreviousCandleLevelsMT4 affiche les niveaux de bougies précédents, il affiche les niveaux d'ouverture (Open), du prix le plus haut (High), du prix le plus bas (Low) et du prix de clôture (Close) de la bougie précédente sur différentes périodes. Ces niveaux sont souvent appelés OHLC. Il est conçu pour aider le trader à analyser le marché et à faire attention aux niveaux OHLC de la bougie précédente sur différentes unités de temps. Nous savons tous que les niveaux OHLC mensuels (MN), hebdomad
FREE
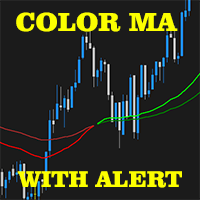
2 EMA Color Alerts Indicator is a powerful tool for any trader looking to stay on top of market movements. By using exponential moving averages (EMAs), this indicator can provide early warning signals for potential market reversals and trend changes. One of the key features of the 2 EMA Color Alerts Indicator is its customizable alerts. With this feature, traders can set their own parameters for receiving alerts, such as the EMA periods and the type of alert (e.g. sound, pop-up, email). This al
FREE
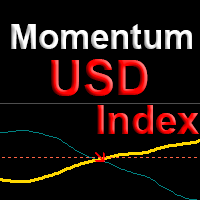
The indicator shows points for the continuation of the trend for currency pairs with the participation of the USD dollar with a probability of more than 80%. The algorithm is based on comparing the momentum of the current currency pair with the momentum of the DX dollar index at the current time. Using the dollar index allows us to evaluate not only the current pair, but the entire picture for all major currencies at once. This approach increases the reliability and reduces the number of false p

Flat Reminder Overview Flat Reminder is a powerful technical analysis tool that identifies and highlights price consolidation zones on your chart. It detects when price action slows down and moves sideways, indicating potential reversal points, continuation setups, or key decision zones in the market. Key Features Consolidation Detection : Automatically identifies flat price zones where market momentum decreases Range Measurement : Calculates and displays the exact range of each consolidation in
FREE

Fibonacci Retracement object is an object that has been provided by metatrader 4 platform. But Fibonacci Retracement object doesn't automated adjust the chart. You have to put and manage it manually to the chart. Because of that, this indicator was created. If you like using filbonacci retracement indicator, highly recommended to use Automated Fibonacci Retracement Indicator if you want to get better result in here:
https://www.mql5.com/en/market/product/95515
LT Automated Fibonacci Retraceme
FREE

First RSI level indicator analyzes and displays the level, at which the first crossing of the standard RSI maximum or minimum value took place for the subsequent definition of strong trends. The indicator allows you to track the beginning of a trend that does not follow the signals of the standard RSI trading strategy, for example, when the price rushes downwards after reaching an oversold level instead of reversing. In this case, we have to conclude that a strong trend is underway and the next
FREE
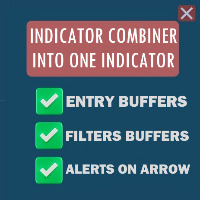
Optimize your trading strategy of your custom indicators with the "Indicator Combiner Into One Indicator". This advanced tool combines multiple indicators, including your custom indicators, into a single, user-friendly interface. It generates an arrow signal based on your custom indicators, simplifying your decision-making process. Ideal for traders of all levels, this indicator offers:
Arrow Signals : Get a clear, single arrow signal that combines insights from your custom indicators, mak
FREE

Was: $99 Now: $49
Blahtech Daily Range indicator displays the average daily range alongside the individual session ranges. Using the daily open price as a reference the indicator shows fixed range and dynamic range targets as lines on the charts. These lines clearly show when the average range has been exhausted. Daily and session ranges can be useful for confirming entries or setting targets and is an excellent odds enhancer for many trading systems. Links [ Documentation | Install
Market Time Watch Un outil de suivi du temps léger, propre et essentiel pour chaque trader Market Time Watch est un affichage professionnel du temps sur graphique, conçu pour les traders qui ont besoin de voir l’heure locale, l’heure du serveur et le compte à rebours de la bougie en cours. Tout cela directement sur le graphique, sans interface lourde ou encombrée. Que vous fassiez du scalping, du day trading, du trading sur les news, ou que vous ayez simplement besoin d’une référence temporelle
FREE
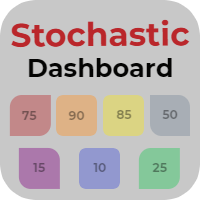
Stochastic Dashboard is an information panel which allows you to have a global market vision through a stochastic indicator. Stochastic Dashboard analyzes and tracks all the assets you want to invest in. Take advantage of this useful dashboard where you can open in a few seconds the chart and quickly invest in it.
Main features of Stochastic Dashboard Graphical panel that allows you to know the situation of many assets. 7 different stochastic situations to discover when an asset is overbought o
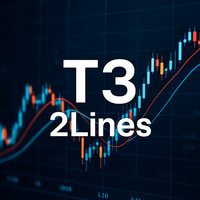
T3 2Lines – Analyse de tendance précise avec deux lignes T3 “T3 2Lines” est un indicateur pour MT4 qui affiche simultanément deux moyennes mobiles T3 (Triple Exponential Moving Average) sur le graphique : une ligne à court terme et une à long terme. Grâce à ces deux courbes lissées, les traders peuvent mieux détecter le début, la continuation et les éventuels retournements de tendance. Fonctionnalités principales Affichage simultané de deux lignes T3 (courte et longue) Période et facteur de liss
FREE

TG MTF MA MT5 is designed to display a multi-timeframe moving average (MA) on any chart timeframe while allowing users to specify and view the MA values from a particular timeframe across all timeframes. This functionality enables users to focus on the moving average of a specific timeframe without switching charts. By isolating the moving average values of a specific timeframe across all timeframes, users can gain insights into the trend dynamics and potential trading opp
FREE

FOTSI is an indicator that analyzes the relative strength of currencies in major Forex pairs. It aims to anticipate corrections in currency pairs following strong trends by identifying potential entry signals through overbought and oversold target areas. Theoretical Logic of Construction: Calculation of Individual Currency Momentum: FOTSI starts by calculating the momentum for each currency pair that includes a specific currency, then aggregates by the currency of interest (EUR, USD, GBP, CHF,

The Colored MACD indicator is a versatile and powerful tool designed to enhance your technical analysis by providing an intuitive visualization of market momentum and trend changes. Built on the foundation of the popular Moving Average Convergence Divergence (MACD) indicator, this version introduces color-coded histograms to easily distinguish between bullish and bearish momentum. Key Features: Color-Coded Visualization : The indicator features a lime-colored histogram when the MACD is above the
FREE

MACD Crossover Arrows & Alert is a MT4 (MetaTrader 4) indicator and it can be used with any forex trading systems / strategies for additional confirmation of trading entries or exits on the stocks and currencies market. This mt4 indicator provides a BUY signal if the MACD main line crosses above the MACD signal line . It also displays a Sell signal if the MACD main line crosses below the MACD signal line .
STRATEGY Traders can use the MACD signal alerts from a higher time frame
FREE
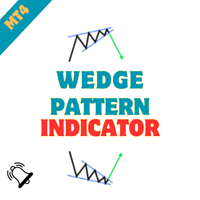
Wedge Chart Pattern Indicator - Unleash the Power of Wedge Patterns in Your Trading Embark on a journey of precision trading with the "Wedge Chart Pattern Indicator." Crafted for MetaTrader, this advanced tool is your ultimate companion for identifying wedge chart patterns, empowering you to make informed and strategic trading decisions. Whether you're a seasoned trader or just starting, this indicator simplifies the process of spotting wedge patterns, providing you with a valuable edge in the m
FREE

This indicator mostly inspired from BW-ZoneTrade custom indicator from MT5. How To Use:
BUY when both dots colored Green. SELL when both dots colored Red. In addition to original one, MACD-OsMA-generated signal also can be drawn. Input Description:
MA_period_short: Faster EMA period for MACD. Applied when drawMACD is true. MA_period_long: Slower EMA period for MACD. Applied when drawMACD is true. MACDperiod: MA period for MACD. Applied when drawMACD is true. drawMACD: When true, draw an additi
FREE

L'indicateur montre les niveaux pivot classiques sur le graphique, calculés sur la base du jour précédent. Vous pouvez choisir l'heure à partir de laquelle la formule sera calculée. Négociez dans un marché plat en vue d'un renversement. Dans un marché en tendance, utilisez-les comme cible. Combinez-les avec vos stratégies pour un trading réussi. Les niveaux sont construits à l'aide de tampons et affichés sur l'ensemble de l'historique des cotations disponibles.
Paramètres d'entrée.
Start Hour
FREE

The Keltner Channel is a volatility-based technical indicator composed of three separate lines. The middle line is an exponential moving average (EMA) of the price. Additional lines are placed above and below the EMA. The upper band is typically set two times the Average True Range (ATR) above the EMA, and the lower band is typically set two times the ATR below the EMA. The bands expand and contract as volatility (measured by ATR) expands and contracts. Since most price action will be encompasse
FREE
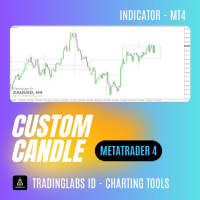
Custom Candle – Multi-Timeframe Visualization Analyzing multiple timeframes is essential for accurate trading decisions, but switching between charts can be inconvenient and inefficient. The Custom Candle indicator solves this problem by overlaying higher-timeframe (HTF) candles directly onto your lower-timeframe (LTF) chart. This allows you to see the bigger picture at a glance, align with the higher trend, and improve trade accuracy—without leaving your current chart. Key Features Multi-Timefr
FREE

Below is the translation of your original English text into French:
AVIS IMPORTANT – LICENCE ET ACTIVATION REQUISES
Instructions d’activation :
Dès que vous avez terminé votre achat, veuillez nous contacter immédiatement pour recevoir votre clé de licence, votre mot de passe ou les détails d’activation. Sans ces éléments, le logiciel ne fonctionnera pas. Nous sommes là pour garantir un processus d’activation fluide et vous assister en cas de questions.
Personnalisation multilingue
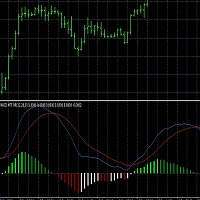
This script generates a MACD with 6 color-coded histogram bars based on the position (above or below zero) and direction (rising or falling) of the histogram. It provides multi-time frame support , allowing users to view the MACD from different time frames on a single chart. The indicator uses customizable settings for MACD periods, histogram width, and vertical scaling. This script could be useful for traders who want a visually enhanced MACD with clearer trend and momentum representation acro
FREE

This indicator is an original view on volumes. It is known that volumes show the amount of buyers and sellers for a certain period of time. A candle is used a period of time. Volumes at a candle High show the buyers. Volumes at a candle Low show the sellers. A candle Open shows the Delta. Delta indicates who was dominant on a given candle, buyers or sellers.
Input parameters Distance - distance of the volumes text from High and Low. Font size - text font size. The indicator provides levels that
FREE

L'indicateur R 2EMA Color pour MT4 fournit des signaux de trading solides basés sur le croisement de 2 EMA.
Points clés Lorsque le prix croise et clôture au-dessus des deux EMA vertes, cela crée un signal d'achat. Lorsque le prix croise et clôture au-dessus des deux EMA rouges, cela crée un signal commercial de vente. L'indicateur R 2EMA Color Forex permet de déterminer encore plus facilement quand il est temps d'acheter et de vendre
Un signal d'achat se produit lorsque les 2 lignes EMA devie
FREE
Special offer : ALL TOOLS , just $35 each! New tools will be $30 for the first week or the first 3 purchases ! Trading Tools Channel on MQL5 : Join my MQL5 channel to update the latest news from me Libérez la puissance de l'apprentissage automatique avancé avec le Machine Learning Adaptive SuperTrend , un indicateur de pointe conçu pour s'adapter en douceur aux conditions de marché changeantes. En intégrant le clustering par k-means à la méthodologie SuperTrend, cet indicateur perm

Multi Time Frame Indicator acts as a Scanner based on the Ichimoku Trading System. The outcome is displayed on a board. This helps you to make "at a glance" a mental picture of the System without having to open the chart. Up to 10 Currencies can be watched. Scanned elements And Legend "KUMO Futur" - Green : The Kumo Futur is Bullish. "KUMO Futur" - Red : The Kumo Futur is Bearish. "PRICE Cross KJ" - Green : The Price is Above the Kijun Sen. "PRICE Cross KJ" - Red : The Price is Below the Kijun
FREE

The BinaryFortune indicator has been developed and adapted specifically for trading short-term binary options. The algorithm of the indicator analyzes numerous factors before generating a signal. The indicator is installed in the conventional way. The indicator consists of an information window, which displays the name of the trading instrument, support and resistance levels, and the signal itself ( BUY , SELL or WAIT ). A signal is accompanied by a sound and a pop-up Alert. Advantages of the in
FREE

Introduction This indicator detects volume spread patterns for buy and sell opportunity. The patterns include demand and supply patterns. You might use each pattern for trading. However, these patterns are best used to detect the demand zone (=accumulation area) and supply zone (=distribution area). Demand pattern indicates generally potential buying opportunity. Supply pattern indicates generally potential selling opportunity. These are the underlying patterns rather than direct price action. T
FREE

En tant que trader forex, vous comprenez la valeur de la stratégie de trading Fibonacci dans l'analyse technique. Cependant, dessiner et ajuster manuellement les niveaux de Fibonacci peut prendre du temps. C'est là qu'intervient l'indicateur Fibonacci Of Yesterday Ultimate . Il est conçu spécifiquement pour les traders utilisant la stratégie Fibonacci basée sur l'évolution des prix de la veille, ce qui vous permet d'économiser du temps et des efforts. Cet indicateur innovant identifie au
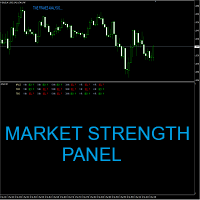
Apollo Market Strength Panel est un indicateur multi-période qui peut être utile aux traders de forex et d'options binaires. Le panel représente les conditions du marché sur plusieurs périodes allant de M1 à H4. L'indicateur fournit des informations sur trois aspects importants du marché. Ce sont la tendance, la force et l'impulsion. Si tous ces 3 composants s'alignent, l'indicateur vous fournira un signal d'ACHAT ou de VENTE en fonction de la direction du marché. L'indicateur trace les signaux

Multicurrency and multitimeframe modification of the indicator Bollinger Bands. On the dashboard you can see breakouts and touches of the Bollinger Bands. In the parameters you can specify any desired currencies and timeframes. The indicator can also send notifications when the price touches the Bollinger Bands, when the current volatility changes (expands or falls), and when the price touches all the bands. By clicking on a cell with a period, this symbol and period will be opened. This is MTF

Bitcoin Predictor est un indicateur basé sur des flèches conçu pour prédire les inversions de prix. Cet outil peut être utilisé avec BTC et d'autres cryptos. Il peut également être utilisé avec des devises. Mais vous devez d'abord vérifier quelles paires fonctionnent le mieux. Certaines paires et certains délais peuvent très bien fonctionner. Vous êtes libre de tester et de voir par vous-même. L'indicateur est très facile à utiliser. Tout ce dont vous avez besoin est de suivre les flèches. L'ind

Necessary for traders: tools and indicators Waves automatically calculate indicators, channel trend trading Perfect trend-wave automatic calculation channel calculation , MT4 Perfect trend-wave automatic calculation channel calculation , MT5 Local Trading copying Easy And Fast Copy , MT4 Easy And Fast Copy , MT5 Local Trading copying For DEMO Easy And Fast Copy , MT4 DEMO Easy And Fast Copy , MT5 DEMO Advanced Bollinger Bands:
1. The Bollinger rail will change color with the direction"
2. The
FREE
Like most things that work in trading, it's really simple. However, it's one of the most powerful tools I have that makes entries of many systems much more precise.
In its essence, it measures the recent volatility against the medium-term average. How does it work? Markets tend to be prone to strong trending movements when relative volatility is low and tend to be mean-reverting when relative volatility is high.
It can be used with both mean-reversion systems (like the Golden Pickaxe) and mo
FREE

This indicator is based on Guppy's GMMA Strategy. And shows arrows when GMMA lines cross up or down. To have this indicator and get alerts for Multiple Timeframes and multiple Pairs you can check out the demo of this GMMA Trend Scanner indicator: https://www.mql5.com/en/market/product/38747
About GMMA In Brief:
GMMA attempts to identify trends by combining two groups of moving averages with differing time periods: The long-term EMAs (30, 35, 40, 45, 50, and 60) the behaviors of investors that h
FREE
* All Symbols x All Timeframes scan just by pressing scanner button ** *** Contact me to send you instructions and add you in "Candle Scanner group" for sharing or seeing experiences with other users. Introduction: Candles tell their story. When looking at a candle, it’s best viewed as a contest between buyers and sellers. Candlestick patterns are used to predict the future direction of price movement. Candlesticks are an easy way to understand the price action. You can use candlesticks to decid
FREE
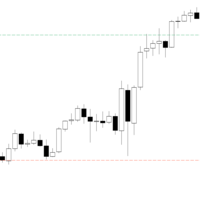
PDHL – affiche simplement les highs et lows des jours précédents directement sur votre graphique, offrant une référence rapide et visuelle des niveaux clés passés. L’indicateur est léger et facilement paramétrable , vous permettant d’ajuster le nombre de jours affichés, les couleurs, le style et l’épaisseur des lignes selon vos préférences. Il est conçu pour être simple et pratique, mais peut ne pas fonctionner sur tous les instruments ou toutes les plateformes . Seulement testé avec CFDs
FREE

L'indicateur recherche les bougies d'impulsion et les affiche sur le graphique. Il comprend un filtre d'ombre. Il trouve également les niveaux de rupture des bandes de Bollinger. Vous pouvez activer le tableau de bord multidevise dans les paramètres. Pour les alertes, vous pouvez choisir entre le graphique actuel ou la liste complète. Blog-Link - Retest and Fake Breakout with UPD1
Modèles de trading : Re-test de tendance. Faux breakout. Autres.
EURUSD, GBPUSD, XAUUSD, ... M15, M30, H1.
Para

L' indicateur SMC Sessions est un outil de précision conçu pour les traders avertis qui s'appuient sur les concepts ICT, la recherche de liquidité et les stratégies par session . Il cartographie précisément les zones de trading critiques par session en utilisant les concepts les plus éprouvés et les plus populaires utilisés par les traders institutionnels. Cet indicateur de session tout-en-un superpose à votre graphique les stratégies de range les plus efficaces et à forte probab

IceFX SpreadMonitor is a special spread logging indicator which displays the current, minimum/maximum and average spread values. These values are set to be visible even after a reboot. Also, SpreadMonitor could save all the desired spread values to .csv files for later analysis of the results.
Indicator parameters: SpreadLowLevel - low level of spread (show value in green color) SpreadHighLevel - high level of spread (show value in red color) BGColor - background of panel SpreadNormalColor - co
FREE

RoundNumbers indicator is a simple and powerful psychological price levels. Trader usually use these levels as a Support and Resistance (SnR). Indicator Input: Levels - Numbers of levels drawn on chart. Default 30 levels. BoxSize - Box size drawn on each levels, indicate buffers around levels. Default value 1pips (10point) above and below each levels. ZoneSize - Distance between each levels, default value 10pips (100point). Style & Colours - User inputs customization.
For MT5 version, please re
FREE

Ce produit est conçu pour afficher les sessions de trading de 15 pays en fonction du fuseau horaire de votre serveur de courtier et de divers modes d'affichage en fonction des paramètres souhaités pour éviter la congestion des graphiques et la possibilité de définir une session avec l'heure souhaitée par l'utilisateur.
Le soleil ne se couche jamais sur le marché des changes, mais son rythme danse au rythme de séances de trading distinctes. Comprendre ces sessions, leurs chevauchements et leurs
FREE

L'indicateur montre des niveaux ronds sur le graphique. Ils sont également appelés niveaux psychologiques, niveaux de banque ou niveaux des principaux acteurs. À ces niveaux, il y a une véritable lutte entre les haussiers et les baissiers, une accumulation de nombreux ordres, ce qui entraîne une volatilité accrue. L'indicateur s'adapte automatiquement à tout instrument et à toute période. Si le niveau 80 est cassé puis testé, il faut acheter. Si le niveau 20 est cassé puis testé, vendre. L'obje
FREE

Multicurrency and multi-timeframe indicator Inside Bar (IB). In the parameters, you can specify any desired currencies and timeframes. The panel displays the last found Inside Bar (and Mother Bar) pattern, the current price position and the breakout of the levels of the Mother and Inside Bars. You can set the size and color for bars and text in the cells. The indicator can also send notifications when levels are broken. The dashboard highlights Double Inside Bar in a special color. By clicking
Этот индикатор является уникальным в своём роде, больше всего подходит для скальпинга на XAUUSD а также для торговли на более старших таймфреймах!
Уведомление сообщит самые важные точки входа, поэтому следует торговать по тренду. Идеален для скальпинга! The Best Trend Signals - трендовый мультивалютный индикатор, может использоваться на любых финансовых инструментах валюта, криптовалюта, металлы, акции, индексы. Рекомендуемый тайм-фрейм M15, M30, H1, H4, D1.
Как торговать с помощью индикатора
FREE

Bitcoin 999 - is a trend indicator that automatically analyzes the market and provides information about the trend and each of its changes, as well as giving signals for entering trades without redrawing! The indicator uses each candle, analyzing them separately. referring to different impulses - up or down impulse. Exact entry points into transactions for currencies, crypto, metals, stocks, indices!
Main functions: Accurate entry signals WITHOUT REPAINTING! Once a signal appears, it remains
FREE

Cyber Engulf Indicator - Professional Trading System for MetaTrader 4 What is the Indicator?
Cyber Engulf is an advanced technical analysis indicator that detects engulfing patterns filtered by moving average. It identifies trend reversal points, helping you spot changes in market structure early. What Does It Do? Automatically identifies engulfing candlestick patterns Filters out false signals using moving average Displays buy and sell signals with blue/up and red/down arrows Works across mult
FREE

Check my p a id tools they work perfect please r ate Here is an Upgraded version with Bonus Ea in case of purchase it costs 30$ only and you get Ea as Bonus: https://www.mql5.com/en/market/product/96835 This indicator is experimetal, it shows TMA channel arrows with Volatility filter built in to avoid lagging. Try to experiment with it, search for better conditions of use. It is possible to adjust different timeframes for TMA and for Volatility filter Same time on the current chart, so it ma
FREE

Relative Volume or RVOL is an indicator that averages the volume of X amount of days, making it easy to compare sessions volumes.
The histogram only has 3 colors:
Green - Above average volume
Yellow - Average volume
Red - Below average volume
The default setting is 20 days, which corresponds more or less to a month of trading.
With the data obtained from this indicator you can better gauge the commitment behind a move. For example, you will be better equipped to judge if a breakout of a r
FREE

This Weis Wave Volume indicator is a tool to help traders identify the current price trend. Understanding volume can provide insight into a market's behavior to help you determine its overall health. The most important rule is this: volume precedes price. Typically, before a market price moves, volume comes into play. It has 2 main colors histogram which are green and red. – Green indicates an upward wave. The more the price increases, the bigger the green volume gets. – The red color shows a d
FREE

Detailed blogpost: https://www.mql5.com/en/blogs/post/766378
Key Features
Adaptive Upper/Lower bands Smooth Center Line Customizable Length (sensitivity) Non-Repainting (only current ongoing bar is updated every "Refresh After Ticks" number of ticks) Multiple Price Sources - Choose from close, open, high, low, median, typical, or weighted close Components:
The Basis Line The smooth center line represents the weighted average of price. Think of this as the "true" price level when all the noise
FREE

The "Trend Edges" indicator determines whether the trend is rising or falling. It is suitable for any time frame (tested on DAX).
The indicator should be treated like Bollinger Bands, meaning that if it breaks out upwards, you can buy with a stop loss below the lower edge.
Find a trending pair, index or CFD. Additionally :
-Sound alert on trend change.
-Alert Notification
-Alert Notification on your mobile phone Check my other indicator "Trend Edges histogram"
FREE

This indicator uses Bollinger Bands lines to detect markets trend. It's a very useful tool for manual trading. Furthermore it is possible to use the indicator with ATR as a filter , as well as the option to pop up an alert when a reverse trend occurs. The readings are very simple to use and understand. Indicator works best on H1 timeframe.
You can to get source code from here .
Parameters BarsCount - How many bars used to show the line. BBperiod - Period of Bollinger Bands. BBdeviations - Devi
FREE

The Grand Signal indicator is a unique tool that not only provides an understanding of market behavior but also precisely identifies trend entry points after intraday correction limits, with accuracy down to a five-minute candlestick! It includes individual settings for each currency pair. After purchasing, be sure to message me directly for instructions! Telegram: @Lapinsania or here in the Market! I
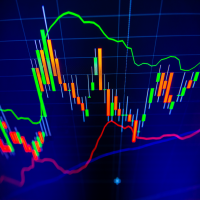
The indicator calculates reversal points based on the past trend and forms a channel (outer) on this basis. This elapsed time span from which the reversal points are determined can be specified in the settings.
An inner channel is also drawn in white. The trend continues in this channel, if there is a sideways trend. Here the upper / lower line form the possible turning point.
The indicator is suitable for all trading areas, whether forex, crypto, metals, indices or futures. All areas traded
DBD AND RBR CANDLESTICK PATTERN: This indicator based on the concept of two candlestick patterns. DROP BASE DROP (DBD) is a buy candlestick pattern and RALLY BASE RALLY (RBR) is a sell candlestick signal pattern. The arrows indicate potential signal setup for long trade and short trade. This indicator includes pop-up alert, push to phone and send to email alert which can be enabled and disabled. The color and size for DBD and RBR can be changed.

This indicator analyzes the ranges in the selected LookBack Bars and shows the relative strength of the price movement with the Level percentage you set. The blue line indicates that the current price movement is strong, and the yellow line indicates that we are in a flat price movement. The blue line does not determine whether the price action is up or down, it just shows relative strength. Therefore, as seen in the picture, direction can be determined with a simple zigzag indicator on the main
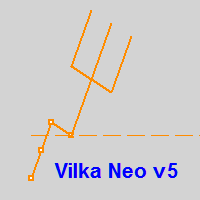
Вилка Нео v5, разрабатывалась для торговой системы "Оракул", но постепенно дополнялась, например - углами Ганна и другими опциями...
Можно создавать графические объекты с заданным цветом, стилем и толщиной, такие как: прямоугольники с заливкой и без, отрезки трендлиний и нестандартный инструмент - "вилка Нео" в виде трезубца, так же есть возможность интерактивно настраивать цветовую палитру прямо с графика, настраивать видимость объектов для разных ТФ, толщину и стили... Панель переключается кла
FREE

Use with disciplined risk management. Fibonacci entry system based on the golden zone 38.2 - 61.8 where the entry is confirmed at 23.6 with indications of Take Profit 3:1. Automatically plotted Fibonacci contains retracement and expansion Fibonacci in a single indicator. Up to 77% win rate with this system. FTMO challenge pass with 0.50% risk and 1.50% R:R.
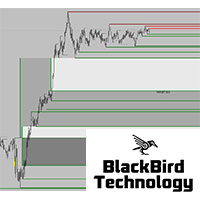
Dear Traders, check out my new multi level market liquidity indicator : https://www.mql5.com/en/market/product/73098
Many of you have been trading very good with this indicator, thanks for the support and positive feedbacks ! For more information about market liquidity, a manual on how to use this indicator please send me a message. A lot of information can be found on the net. (search liquidity trading/ inner circle trader)
https://www.youtube.com/watch?v=yUpDZCbNBRI
https://www.youtube.com/

Introducing a powerful, precision-engineered indicator that seamlessly combines Pivot Points, Moving Averages, and Multi-Timeframe Analysis to deliver high-probability Buy and Sell signals in real-time. This tool is your strategic edge, designed to identify trend reversals, market momentum, and optimal trade entries, no matter your preferred trading style.
Our algorithm goes beyond standard indicators—by analyzing multiple timeframes simultaneously, it spots true market turning points while fi
This Indicator only places quality trades when the market is really in your favor with a clear break and retest. Patience is key with this price action strategy!
If you want more alert signals per day, you increase the number next to the parameter called: Support & Resistance Sensitivity. After many months of hard work and dedication, we are extremely proud to present you our Break and Retest price action indicator created from scratch. One of the most complex indicators that we made with over
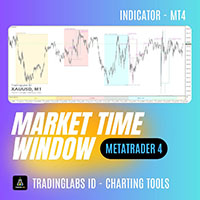
ICT Market Time Cycle – Complete Session & Time Window ICT Market Time Cycle is a professional trading indicator designed to help traders follow the ICT (Inner Circle Trader) methodology with ease.
It automatically displays the main market sessions (Asia, London, and New York), along with Killzones, Silver Bullet windows, and Macro times directly on your chart. With this tool, you no longer need to calculate session times manually – everything is plotted automatically in a clean and professional

Ready to elevate your trading with clear, high-confidence signals? Unlock the Power of Triple-Confirmation Trading! Stop chasing weak signals and start trading with conviction. The Triple Power Indicator is your ultimate tool for identifying high-probability trend moves. We've combined three of the most powerful and reliable technical indicators—Parabolic SAR, MACD, and Exponential Moving Average—into one dynamic system, giving you an unmatched edge in the market. Why You Need This Indicator: U
FREE

The indicator displays the probable ( Support and resistance ) levels. The indicator draws horizontal and trend levels of support and resistance. The indicator settings: Trends - the mode for displaying trend lines or horizontal lines of support and resistance Yes - display trend lines only No - display horizontal lines only UseResource - use the resources built into the indicator. Yes - use the ZigZag indicator from the resources of the product. No - use a custom ZigZag indicator. HistoryBar -
FREE
Indicateur de recherche de prix magnétique, le prix moyen vers lequel le prix tend à revenir. Optimisé pour XAUUSD H1. Il possède 3 lignes, la ligne centrale étant le prix sur lequel il faut se concentrer. Sur la base des données historiques, le taux de succès du retour au prix moyen a dépassé 92% avec les paramètres par défaut ; dans les autres cas, le stop loss, qui est défini par défaut, a été déclenché. Le point d'entrée et l'heure d'entrée sont approximativement au début de la journée et, p
FREE

Titre du produit Smart Bulls (MT4) – partie de la série SmartView Indicators Description courte Indicateur Bulls avec une expérience utilisateur unique sur la plateforme MetaTrader. Offre des capacités avancées non disponibles auparavant, telles que l'ouverture des paramètres par double-clic, le masquage et l'affichage des indicateurs sans les supprimer, et l'affichage de la fenêtre de l'indicateur en taille pleine du graphique. Conçu pour fonctionner parfaitement avec le reste de la série Smart
FREE

Chart Patterns Detect 15 patterns (Ascending Triangle, Descending Triangle, Rising Wedge, Falling Wedge, Bullish Flag, Bearish Flag, Bullish Rectangle, Bearish Rectangle Symmetrical triangle, Head and Shoulders, Inverted Head and Shoulders, Triple top, Triple Bottom, Double Top, Double Bottom) Use historical data to calculate the probability of each pattern to succeed (possibility to filter notification according to the chance of success) gives graphic indication about the invalidation level and

The Smart Liquidity Profile is color-coded based on the importance of the traded activity at specific price levels, allowing traders to identify significant price levels such as support and resistance levels, supply and demand zones, liquidity gaps, consolidation zones, Buy-Side/Sell-Side Liquidity and so on. Smart Liquidity Profile allows users to choose from a number of different time periods including 'Auto,' 'Fixed Range,' 'Swing High,' 'Swing Low,' 'Session,' 'Day,' 'Week,' 'Month,' 'Quar
Le MetaTrader Market est le meilleur endroit pour vendre des robots de trading et des indicateurs techniques.
Il vous suffit de développer une application pour la plateforme MetaTrader avec un design attrayant et une bonne description. Nous vous expliquerons comment publier votre produit sur Market pour le proposer à des millions d'utilisateurs de MetaTrader.
Vous manquez des opportunités de trading :
- Applications de trading gratuites
- Plus de 8 000 signaux à copier
- Actualités économiques pour explorer les marchés financiers
Inscription
Se connecter
Si vous n'avez pas de compte, veuillez vous inscrire
Autorisez l'utilisation de cookies pour vous connecter au site Web MQL5.com.
Veuillez activer les paramètres nécessaires dans votre navigateur, sinon vous ne pourrez pas vous connecter.