Regardez les tutoriels vidéo de Market sur YouTube
Comment acheter un robot de trading ou un indicateur
Exécutez votre EA sur
hébergement virtuel
hébergement virtuel
Test un indicateur/robot de trading avant d'acheter
Vous voulez gagner de l'argent sur Market ?
Comment présenter un produit pour qu'il se vende bien
Indicateurs techniques pour MetaTrader 4 - 11

The Pipsometer Pro Indicator is an essential, minimalist tool designed for the disciplined trader who requires immediate, at-a-glance financial feedback. It functions as a dedicated, real-time display that continuously calculates and shows your current floating profit or loss, measured exclusively in **pips**, for every open trade on the active chart. This focus on pips rather than monetary value allows traders to assess market performance and price movement directly, stripping away the emotion
FREE
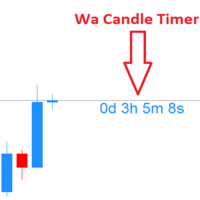
Wa Candle Timer MT4 est un indicateur puissant et facile à utiliser qui affiche le temps restant avant la formation de la prochaine bougie sur votre graphique MT4. Il aide les traders à mieux suivre les temps de clôture pour améliorer l’exécution et la prise de décision. Fonctionnalités clés :
Affiche le compte à rebours de la bougie en cours
Change de couleur lorsque le temps restant passe sous un pourcentage défini
Nouveau dans la version 3.00 : alerte personnalisable à un seuil défi
FREE

The ZUP is based on two ideas. Idea 1 - combine a variety of methods for identifying extremums (minimums and maximums) on the market price charts in a single indicator. Idea 2 - make it possible to easily bind various graphical tools, which allow to analyze the market behavior, to the identified extremums. To implement the first idea , the following has been made in the indicator. Included multiple ZigZag algorithms. Standard ZIGZAG algorithm. The basis of this algorithm is taken from the ZigZag
FREE

KT Quick Risk Calculator is a professional utility tool for MetaTrader 4. It is designed to improve your workflow by providing instant calculations using an interactive measuring tool.
[Main Function] This tool allows you to interactively measure the distance between two points on the chart and immediately see the potential result in your account currency based on a fixed lot size.
[Key Features] 1. Smart Interaction: Hold [Ctrl] + Drag Left Mouse Button to measure. 2. Instant Data: Displays
FREE

MP Squeeze Momentum is a volatility and momentum indicator derivated of "TTM Squeeze" volatility indicator introduced by John Carter. It capitalizes on the tendency for price to break out strongly after consolidating in a tight range. Introduction: The volatility component of MP Squeeze Momentum measures price compression using Bollinger Bands and Keltner Channels. If the Bollinger Bands are completely enclosed within the Keltner Channels, that indicates a period of very low volatility. This st
FREE
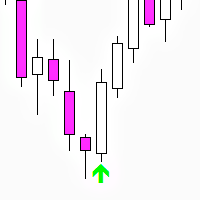
Three Bar Reversal (MT4) — free indicator Three Bar Reversal is a simple and effective MetaTrader 4 indicator that detects the classic three-bar reversal candlestick pattern with additional filtering based on ATR and candle body sizes.
Arrows are displayed on the last closed candle of the pattern, and push notifications are also sent. An automated trading robot Three Bar Reversal EA has been developed based on this indicator. The indicator works on all currency pairs and timeframes but pe
FREE
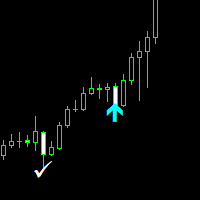
Nasdaq Savages Non-repaint indicator works on all timeframes 1 minute to 15 minutes timeframe for scalpers. 30 Minutes to Monthly timeframe for swing traders The Nasdaq Savages indicator comes with a top right info tab which tells you about the current buy or sell signal, Profit in pips, Stop loss and Target Red arrow is your sell entry signal the white right tick is your exit signal and take profit hit signal Light blue arrow is your buy entry signal the white right tick is your exit signal an
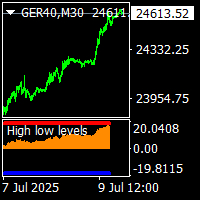
on demo mode, use date for testing. for people purchase thise indicator, there is bonus price chanell indicator . high low levels indicator is non repaint trend reversal indicator.and works all pairs and all timeframes. there is a histogram move up and down. and there is a level red and blue. when histogram reach the up red level that is top.and reversal is possible. when histogram down and reach blue level that is prices oversold and possible reversal up. this indicator suitable for beginners a

Super Entry est un indicateur de type flèche tout-en-un dans lequel il donne des signaux longs et courts seuls, des niveaux tp et sl basés sur la valeur ATR et pouvant être modifiés et modifiés. Cet indicateur fournit un panneau de backtesting qui affiche le taux de victoire et d'autres statistiques. donner une idée claire du niveau de précision attendu.
cet indicateur ne repeint ni ne repeint et le signal arrive à la barre ouverte sans délai.
Paramètres :
réglages : valeurs des indicateurs
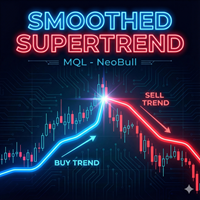
Indicateur Smoothed Supertrend - Indicateur de Tendance Basé sur la Volatilité avec Fonction de Lissage L'Indicateur Smoothed Supertrend est une variante améliorée de l'indicateur Supertrend classique pour MetaTrader 4 . En intégrant une fonction de lissage supplémentaire, le bruit du marché est réduit et la qualité des signaux de tendance est améliorée. Description Technique: L'indicateur est basé sur l'Average True Range (ATR) pour mesurer la volatilité du marché et le combine avec un lissage
FREE

We provide indicators tailored to better meet your trading requirements. >> MT Magical <<
MT Supply Demand :
It is an indicator created to find supply and demand, which will be important support and resistance levels for the price. Supply Zone is a zone where the price has reached, it is often resisted. In other words, when the price reaches this zone, there will be more selling power to push the price back down.
Demand Zone is a zone where the price has reached, it is ofte
FREE

Info Plus is a simple tool that displays the current status on an asset class. The information displayed by Info Plus includes: Bid Price The high and low of the day. Candle time left. Current spread. Selected timeframe. Asset class selected (Symbol). Pip value. Open Positions. Total pips booked. Pips per trade. Session times (they may not be accurate and are subject to changes). Date and time.
How it Works When loaded onto any chart, Info Plus automatically gets the following parameters: Bid P
FREE

Titre du produit Smart RSI (MT4) – partie de la série SmartView Indicators Description courte Indicateur RSI avec une expérience utilisateur unique sur la plateforme MetaTrader. Offre des capacités avancées non disponibles auparavant, telles que l'ouverture des paramètres par double-clic, le masquage et l'affichage des indicateurs sans les supprimer, et l'affichage de la fenêtre de l'indicateur en taille pleine du graphique. Conçu pour fonctionner parfaitement avec le reste de la série SmartView
FREE
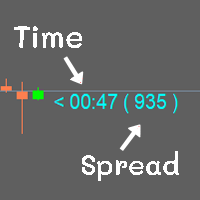
Show the time of candlesticks and spread. All data will be displayed in a rod. Can change color Can fix the size as needed
MT4 : Link https://www.mql5.com/en/market/product/102742 MT5 : Link https://www.mql5.com/en/market/product/102834
Most free code on various websites I didn't write it myself. I only do a little bit.
If you like it, please give 5 stars with it. Thank you.
FREE
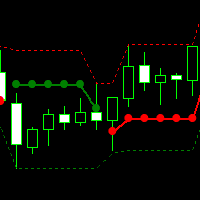
This technical indicator is particularly suitable for short-term traders, as it can quickly reflect the starting point and reversal of the trend. The red beads represent the rise and the green beads represent the fall, which can clearly and timely reflect the current market situation. The source code price can be calculated separately. If you need it, please contact us

CONGESTION BREAKOUT PRO
This indicator scans the breakout of congestion zones . This indicator unlike any other congestion indicator you will find in the market right now, it uses an advanced algorithm not peculiar to most traditional congestion indicators available today . The advanced algorithm used to define the congestions is greatly responsible for the high rate real congestion zones and low rate fake congestion zones spotted by this product.
UNDERSTANDING CONGESTION
Congestion are ar
ALGO BOX – Advanced Day Trading System ALGO BOX is a powerful day trading indicator designed for serious traders who demand precision and reliability in breakout trading. Combining advanced price action analysis with real-time data, it helps you spot high-probability trades while keeping risk under control. Why ALGO BOX Stands Out Identify clear, profitable breakout opportunities Reduce false signals for better trade accuracy Track your trading performance with live stats Make smart, data-driven
FREE

Auto Fibonacci Retracement Indicator — Flexible and Reliable This is not just another Auto Fibonacci Retracement indicator — it’s one of the most flexible and dependable tools available . If you find it useful, please leave a review or comment to support the project. Check out my other helpful tools below: Timeframes Trend Scanner - Scan the trend of assets in difference timeframes with multiple indicators
Market Trend Scanner - Scan the trend of multiple-assets in with multiple indicators
FREE

BeST_Gann Hi-Lo Strategy is an MT4 indicator that is based on the Gann Hi-Lo Activator the famous trend-following indicator that allow us to to enter a trade quite early while also stay in a trade as longer as we can for taking profit.While it is built of a moving average it helps traders determine the direction of the trends and to produce with-trend trading signals.
This indicator is in fact a simple moving average of the highs and lows of the previous period. It follows the trends in the mark
FREE
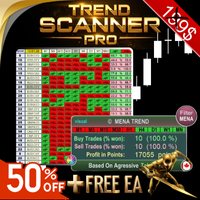
Trend Scanner PRO First of all, it’s worth emphasizing that this trading system is 100% Non-Repainting, Non-Redrawing, and Non-Lagging ,
which makes it ideal for both manual and algorithmic trading setups. Online course, user manual, and downloadable presets included. The Trend Scanner Dashboard is a professional multi pair scanner that analyzes multiple symbols and timeframes at once, giving you an instant market scanner view of the real trend direction. Instead of switching ch

Trading System Double Trend - système de trading indépendant composé de plusieurs indicateurs. Détermine la direction de la tendance générale et donne des signaux dans la direction du mouvement des prix.
Peut être utilisé pour le scalping, le trading intrajournalier ou intrasemaine.
Possibilités
Fonctionne sur toutes les périodes et instruments de trading (Forex, crypto-monnaies, métaux, actions, indices.) Lecture visuelle simple des informations sans charger de graphique L'indicateur ne rede
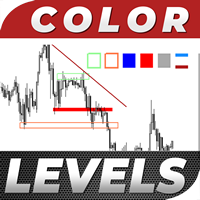
Color Levels is a convenient tool for traders using a Trendline and a Rectangle in their technical analysis. It allows setting two empty rectangles, three filled ones, and two tredlines. The indicator parameters are very simple and divided into numbered blocks: The ones beginning with 1 and 2 - empty rectangle (frame) parameters; 3, 4, and 5 - filled rectangle parameters; 6 and 7 - trendline parameters. Simply click a desired object and it will appear in the upper left corner. Main Adjustable Pa
FREE

This indicator can send alerts when a Heiken Ashi Smoothed color change occurs. Combined with your own rules and techniques, this indicator will allow you to create (or enhance) your own powerful system. Features Can send all types of alerts. Option to delay the alert one bar in order to confirm the color (trend) change. Input parameters Wait for candle close: 'true' or 'false'. Setting it to 'true' will delay the alert to the opening of the bar following the bar where the color change occurred.
FREE

Gorilla Channel VZ est un indicateur de canal développé sur la base de nombreuses années d'observations.
Un indicateur de trading de signaux peut être utilisé à la fois comme indicateur d'affichage d'un canal de tendance et comme l'une des sources de signaux d'entrée, sous réserve d'un filtrage supplémentaire. Avec une approche appropriée, au moins 80% des transactions réussies.
Principales caractéristiques de Gorilla Channel VZ: Fonctions analytiques
Peut être utilisé sur toutes les paires
FREE
MTF Chart PRO : Analyse multi-période avec modèles, S/R et alertes Aperçu MTF Chart PRO est un indicateur MetaTrader 4 avancé qui superpose des bougies personnalisables de plusieurs périodes directement sur votre graphique actuel. Il permet une analyse multi-période (MTF) fluide sans avoir à changer de fenêtre. Idéal pour les traders de forex, d'actions et de cryptomonnaies, il combine l'affichage visuel des bougies avec des lignes de support/résistance (S/R) intégrées, des niveaux automatiques

Your success as a forex trader depends on being able to identify when a currency or currency pair is oversold or overbought. If it is strong or weak. It is this concept which lies at the heart of forex trading. Without the Quantum Currency Strength indicator, it is almost impossible. There are simply too many currencies and too many pairs to do this quickly and easily yourself. You need help! The Quantum Currency Strength indicator has been designed with one simple objective in mind. To give you
L'indicateur Flower est un outil d'analyse technique principalement utilisé pour identifier les tendances et faciliter les stratégies de scalping ou de trading intraday.
L'indicateur Flower est un indicateur de tendance basé sur l'analyse technique et la dynamique des prix. Il signale visuellement les tendances grâce à des fleurs colorées : les bleues indiquent une tendance haussière, les rouges une tendance baissière.
Chaque niveau peut agir comme support et résistance (attention aux niveaux
FREE
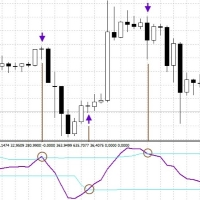
Cyclic Smoothed Relative Strength Indicator
The cyclic smoothed RSI indicator is an enhancement of the classic RSI, adding
additional smoothing according to the market vibration,
adaptive upper and lower bands according to the cyclic memory and
using the current dominant cycle length as input for the indicator. The cRSI is used like a standard indicator. The chart highlights trading signals where the signal line crosses above or below the adaptive lower/upper bands. It is much more responsive
FREE

UR Momentateur
UR Momenter calcule parfaitement la dynamique du prix en corrélation avec l'épuisement du mouvement de prix représenté sous forme d'oscillateur. Par conséquent, cela nous donne des signaux très précoces d'inversions ou de retracements potentiels. Cette formule a été découverte en 2018 après l'éclatement de la bulle du marché.
Avantages d'utiliser UR Momenter :
Aucun paramètre Vous avez 2 lignes qui décrivent le mouvement des prix - White Line qui est l'élan du prix en corrél

RT_TrendlineTool : Semi-AutoTrendline Tool on MT4 2 easy steps, just press the [T] button on your keyboard and click on the Swing High/Low that you're interested.
Then the indicator will try to draw a trendline that runs through only the wick, not cut through candlestick's body
and try to cross the swing point as much as possible with the least slope of the trendline. You can draw up to 10 trendlines.
You are able to get alert when price breakout these trendlines. Additional Hotkey : Press [M]
FREE

Pips Hunter PRO a été développé sur plusieurs années et est une version améliorée de son prédécesseur. Ce puissant indicateur analyse le marché et l'historique des prix pour générer des entrées d'achat et de vente. Pour le calcul de ces entrées, il utilise différents indicateurs qui travaillent ensemble ainsi qu'un logarithme statistique complexe qui filtre les entrées les moins favorables et les élimine / version MT5 .
Fonctionnalités Pas de repeinture
Cet indicateur ne change pas ses valeur
FREE

YOU CAN NOW DOWNLOAD FREE VERSIONS OF OUR PAID INDICATORS . IT'S OUR WAY OF GIVING BACK TO THE COMMUNITY ! >>> GO HERE TO DOWNLOAD
The Volatility Ratio was developed by Jack D. Schwager to identify trading range and signal potential breakouts. The volatility ratio is defined as the current day's true range divided by the true range over a certain number of days N (i.e. N periods). The following formula is used to calculate the volatility ratio: Volatility Ratio (VR) = Today's True Range/Tru
FREE

Affiche les points d'inversion des prix avec des flèches. Fonctionne sur toutes les échéances et toutes les paires de devises. Convient à la fois au scalping et au trading à long terme. Lorsque la flèche bleue apparaît, vous devez ouvrir un ordre d'achat. Lorsque la flèche rouge apparaît, vous devez ouvrir un ordre de vente. Délais recommandés M5, M15, H1, H4. L'indicateur affiche les meilleurs résultats sur GBPUSD, XAUUSD, EURUSD, USDJPY, AUDUSD, USDCHF, EURGBP, EURJPY, EURCHF et d'autres pair

#EasyWayTradePanel indicator for #MetaTrader4 , is trade assistants for manual trading in any #currency in #FOREX , #CRYPTOCURRENCY as #Bitcoin , #Ethereum , #Lightcoin and more. Also is EasyWay to use for #COMMODITY as #Gold , #Silver , #Oil , #Gas ...... and #CFDs . When installed on the chart in your chosen time frame and trading tool, the indicator automatically draws the following custom indicators used in the EasyWayTradePanel trading strategy. 1) Zigzag_Extreme_Indicator, 2) Regression_C

Ranging Market Detector scans the market for momentum and price to check whether the price is range- bound and the direction to which it will breakout. It works with all the all assets and visually shows you the instances when the market is either ranging or trending. Informs when the price has finished a retracement, an opportune time to re-enter the trend early. This will help you in position management. It works very well for Scalping, Day trading, and Swing trading. Helpful in all timefra
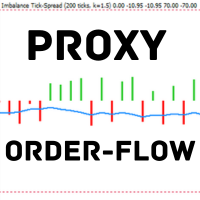
Indicateur basé sur le déséquilibre tick-spread. TF :
Fonctionne sur tous les timeframes (M1 à D1). Paire :
Compatible Forex, indices, or et CFD (auto-ajustement pour JPY, Gold, CFD). Paramètres : TickWindow (200) – fenêtre d’observation des ticks SpreadWeight (1.5) – pondération du spread NormalizationPeriod (20) – période de normalisation (z-score) Overbought / Oversold (±3.0) – seuils d’alerte AlertCooldown (300s) – délai entre alertes Conclusion :
Proxy Order Flow – Imbalance Tick-Spread

L'indicateur analyse le nombre de bougies spécifié et construit des niveaux de Fibonacci basés sur le maximum-minimum. Comme les niveaux sont reconstruits, nous sommes intéressés par la partie droite de la fourchette. Le prix est magnétique par rapport aux niveaux et réagit à un contact. Utilisez cet outil pour trouver un point d'entrée dans la tendance après une correction. Si, à gauche, nous constatons que les niveaux sont parfaitement relevés, nous pouvons supposer que nous avons trouvé la f
FREE
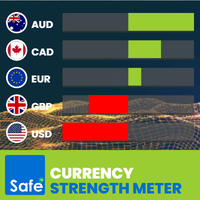
What Is the Currency Strength Meter? The Currency Strength Meter is an advanced yet easy-to-use indicator that measures the relative strength of 8 major currencies by analyzing their real-time performance across 28 currency pairs .
It visually ranks currencies from strongest to weakest, helping you: Spot high-probability trading opportunities
Match strong currencies against weak ones
Trade with confidence and precision
With just a glance at the dashboard, you'll know which currencies to trade –

Surfez sur la tendance – Un signal clair pour suivre la vague Sur les marchés financiers, les opportunités les plus stables de gains se trouvent généralement lors de phases de tendance bien établies. Pourtant, même pour les traders expérimentés, il n’est pas toujours facile de capter ces mouvements. Ride the Trend Signal est un indicateur de signal conçu pour repérer les « pullbacks » dans les tendances haussières ou baissières. Plutôt que d’entrer dès le début de la tendance, il attend une conf
FREE
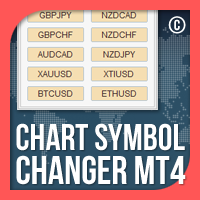
Chart Symbol Changer pour MT4 est un indicateur/utilitaire qui vous offre la possibilité de changer le symbole graphique actuel qui est attaché en cliquant sur un bouton de symbole sur son panneau. Chart Symbol Changer pour MT4 vous donne la possibilité de configurer les 32 boutons de symboles selon vos préférences personnelles, en ajoutant les paires que vous souhaitez surveiller et échanger le plus. De cette façon, vous ne manquerez jamais une opportunité, car vous pouvez avoir une vue plus r
FREE
L'indicateur "Scalper d'histogramme de signal" est un indicateur général sous forme d'histogramme et de signaux sans redessin ni décalage. L'indicateur "Scalper d'histogramme de signal" montre sur le graphique les meilleurs points d'entrée le long de la tendance. Il est préférable de l'utiliser en conjonction avec d'autres indicateurs de tendance comme filtre. L'indicateur montre de bons résultats sur la période M5. Le signal est généré après la fermeture de la bougie et apparaît sous la forme d

Système de trading intelligent. Tous les délais, devises, crypto-monnaies, métaux... Tous les MT4 ainsi que tous les écrans et modèles sont configurés automatiquement. Un débutant négociera simplement sur la base d'un signal. Les paramètres d'un algorithme flexible unique sont ouverts dans les paramètres.
Idée 1 : En plus de « ACHETER/VENDRE », le signal « OBTENIR UN PROFIT » est émis aux points extrêmes. Cette tactique augmente le résultat : vous réalisez des bénéfices au maximum et effectuez
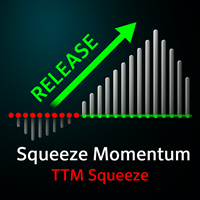
MT5 Version TTM Squeeze Momentum
TTM Squeeze Momentum is an enhanced indicator ideal for recognizing consolidation periods in the market and the start of the next explosive move. This improved version is a volatility indicator based on John Carter's "TTM Squeeze" in which the histogram is based on a linear regression rather than a simple momentum indicator. Red dots on the middle line indicate that the market has entered a "Squeeze" zone or consolidation period, indicated in this enhanced versi

Unlock Precision Trading with Pinpoint Extreme Swing! Are you tired of missing out on crucial market reversals? Do you wish you had a reliable tool to spot high-probability swing trading opportunities? Look no further! The Pinpoint Extreme Swing indicator is your ultimate partner in navigating the dynamic world of trading, designed to give you the edge you need to succeed. This powerful MQL4 indicator is engineered to identify significant market turning points by intelligently combining the Mon
FREE

EZ Risk Reward Ratio is a simple to use MT4 indicator that allows the user to automatically change the Risk Reward Ratio of an open trade simply by dragging the Take Profit or Stop Loss lines to desired positions on any chart. Risk to reward ratio is displayed in whichever corner you choose and can be changed by dragging TP and SL lines.
First, place the EZ Risk Reward Ratio indicator on the MT4 chart. Second, open a trade on the MT4 chart. EZ Risk Reward Ratio works on any currency pair and o
FREE

The Laguerre VIX Trend Extrema (LVTE) indicator detects market tops and bottoms. As its name suggests, LVTE is a percentage price oscillator that identifies extreme ranges in market price. How to use: Buy when the indicator was in the lower "blue" range for more than 2 candles, and then moves up into grey. Sell when the indicator was in the upper "red" range, and then moves down into orange. Please see screenshots for examples! To make it simple, the indicator can show this by paint

The indicator draws the time scale on the chart. You can specify the time offset, adjust the size and font to display on the chart (it is displaying your local time on your chart instead of MT time). You can also select the desired format for displaying the date and time. While holding down the middle mouse button, and moving the cursor, a slider will appear on the scale. You may be interested in my other product , which contains a more advanced version of the Time Scale.
You can also find my o
FREE

Les Gold Targets sont le meilleur indicateur de tendance. L'algorithme unique de l'indicateur analyse l'évolution du prix de l'actif, en tenant compte des facteurs d'analyse technique et mathématique, détermine les points d'entrée les plus rentables, émet un signal sous la forme d'une flèche et le niveau des prix (ACHETER Entrée / VENDRE Entrée) pour ouvrir une commande. L'indicateur affiche également immédiatement le niveau de prix pour le Stop Loss et cinq niveaux de prix pour le Take Profit.

Modified oscillator MACD. A classic indicator that combines a trend indicator with an oscillator to detect entry points. Has a multi-timeframe panel and 3 types of notifications
Benefits:
Works on all instruments and timeseries Trend indicator with oscillator for inputs Multi-period panel on all timeframes Pluggable arrows when signals appear Three types of notifications: push, email, alert
MT5 version -> HERE / Our news -> HERE
How the indicator works:
AW Classic MACD - Indicator of
FREE

Head and Shoulders Pattern Indicator - Your Key to Recognizing Trend Reversals Unlock the power of pattern recognition with the "Head and Shoulders Pattern Indicator." This cutting-edge tool, designed for MetaTrader, is your trusted ally in identifying one of the most powerful chart patterns in technical analysis. Whether you're a novice or an experienced trader, this indicator simplifies the process of spotting the Head and Shoulders pattern, allowing you to make informed trading decisions. Key
FREE

Accurate Signal ARC is a non-repainting trend & reversal signal indicator designed for MT4 .
It uses ATR-weighted volatility logic combined with adaptive price channels to detect high-probability BUY and SELL points directly on the chart. How It Works Calculates a dynamic volatility channel using weighted ATR Detects trend direction (river state) and switches only when price decisively breaks the channel Filters noise using spread-aware true range Draws clear arrows : Lime Arrow → BUY si
FREE

Tipu Heikin-Ashi Panel is the modified version of the original Heiken Ashi indicator published by MetaQuotes here . A professional version of this indicator is available here .
Features An easy to use Panel that shows the Heiken Ashi trend of selected timeframe. Customizable Buy/Sell alerts, push alerts, email alerts, or visual on-screen alerts. Customizable Panel. The panel can be moved to any place on the chart or minimized to allow more space. Heikin means "the average", and Ashi means "foot
FREE
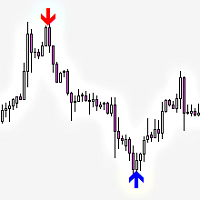
Railway Tracks Pattern — Reversal Pattern Indicator Railway Tracks Pattern is an indicator that automatically detects a powerful two-candle reversal pattern on the chart. It looks for two candles with opposite directions (bullish and bearish), similar in size, and with minimal wicks — a clear sign of momentum shift. How it works: The first candle is strong and directional. The second candle moves in the opposite direction and is of similar size. Both candles have small shadows (wicks). The
FREE

Calculation of Lot Size for many traders is a big challenge.
A case that is very important in money management. What many traders ignore.
Choosing an appropriate Lot Size in trades can improve results and it will ultimately lead to success.
This indicator calculates the authorized Lot Size for your trades.
The indicator uses the following values to get the appropriate Lot Size for positioning:
The distance of Stop Loss.
The Pip Value.
The amount of Risk Allowed For Each Trade.
The amoun
FREE
Minotaur Waves est un indicateur avancé d’analyse de marché conçu pour détecter des points de retournement potentiels et confirmer avec haute précision les changements de direction du prix. Le système combine la puissance de Minotaur Oscillator avec une structure dynamique de bandes adaptatives, offrant des signaux visuels clairs et fiables pour des décisions d’entrée bien fondées. Il est compatible avec toutes les paires de devises, avec une performance optimale sur EURUSD, GBPUSD et USDJPY dan
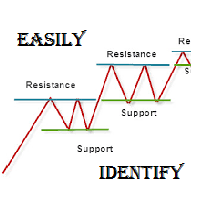
As per name Easily Identify, This Indicator is a affordable trading tool because with the help of Popular Developers & Support of M Q L Platform I have programmed this strategy. I tried to input 4 types and 3 periods of Calculation regarding Support Resistance, Furthermore, I have also care about Trend lines that Trader can easily get in touch with market in another way also. What is in for Trader?
Trading Modes: This selection is for activate whole strategy "Easily Identify" Support_R
FREE
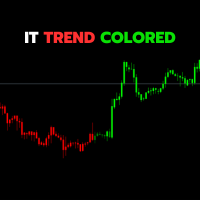
L'indicateur IT Trend Colored est un outil puissant conçu par IT Trading ( InfiniteTrades Software Corp), pour aider les traders à identifier les tendances du marché de manière visuelle et efficace. Cette version, est un indicateur personnalisé pour la plateforme de trading MetaTrader 4.
Fonctionnalités clés :
• Identification des Tendances : L'indicateur utilise une combinaison de moyennes mobiles simples (SMA) pour déterminer la direction de la tendance du marché.
• Coloration Intuitive
FREE
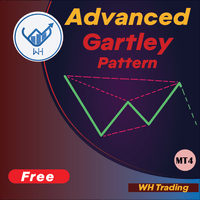
Bienvenue dans l'indicateur de reconnaissance avancée du motif Gartley Cet indicateur détecte le modèle de Gartley basé sur HH et LL de la structure des prix et des niveaux de Fibonacci, et lorsque certains niveaux de fib sont atteints, l'indicateur affichera le modèle sur le graphique. Version MT5 : WH Advanced Gartley Pattern MT5
**Cet indicateur fait partie du combo WH Ultimate Harmonic Patterns MT4 , qui inclut toute la reconnaissance de formes.** Caractéristiques : Algorithme ava
FREE
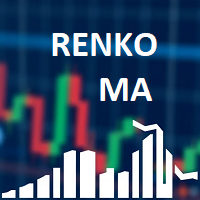
Renko Chart with Moving Average. Classic Renko charts idea. It is protted on main chart and Moving Average can be applied. Prices for bars are used from a lower timeframe. Parameters: BarsBack - how many bars of lower timeframe to use. If value is zero than it will use all available bars. LTF - lower timeframe. BrickSize - Renko bar in points. BullishColor - color for bull candle. BearishColor - color for bear candle. HideLineChart - if this value is true the line chart when be hidden when sele
FREE

on demo mode use date to work. on version 13 wave added.13.1 histogram and trigger line can be changeble. wave can be set 200-500. can have different signal on wave 200 on version 14 ema used.so can see mountly chart signals also. up-down indicator is no repaint and works all pairs and all time frames charts. it is suitable also 1 m charts for all pairs. and hold long way to signal. dont gives too many signals. when red histogram cross trigger line that is up signal.and price probably will down

Price Action Sniper is designed to trade the Price Action on the desired chart time frame. - Trend Reversals. - Trend Continuation. - Brekaouts. - Good tool for Binary Options
Price action forms the basis for all technical analysis of a currency pair, commodity or other asset chart. Many short-term traders rely exclusively on price action and the formations and trends extrapolated from it to make trading decisions. Technical analysis as a practice is a derivative of price action since it uses p

At the very least, this indicator is able to entertain you. It builds a moving line based on interpolation by a polynomial of 1-4 powers and/or a function consisting of a sum of 1-5 sine curves. Various combinations are possible, for example, a sum of three sine curves about a second order parabola. The resulting line can be extrapolated by any of the specified functions and for various distances both as a single point at each indicator step (unchangeable line), and as a specified (re-painted) f

Profitez du prix actuel pendant que vous le pouvez — il peut être ajusté à tout moment. L'objectif de l'indicateur "Black Horse" est d'identifier les divergences entre l'action des prix et l'indicateur VWAP. Il utilise des filtres pour éliminer les divergences potentiellement fausses et générer des alertes de haute qualité et précises.
Les divergences baissières sont indiquées par des points rouges au-dessus de la bougie, tandis que les divergences haussières sont représentées par des points v
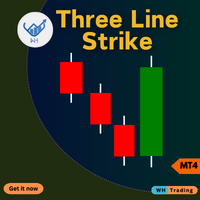
Indicateur de frappe à trois lignes pour MetaTrader 4 (MT4). Cet outil avancé est conçu pour vous aider à identifier les retournements de marché potentiels avec précision et facilité.
Que vous soyez un trader débutant ou expérimenté, cet indicateur peut améliorer vos décisions de trading et maximiser vos profits. Contact me after purchase for guidance Caractéristiques principales : Signaux d'inversion précis : détectez les inversions de tendance potentielles en fonction du modèle de grè

Peak Trough Analysis is the great tool to detect peaks and troughs in your chart. Peak Trough Analysis tool can use three different peaks and troughs detection algorithm. The three algorithm include the orignal Fractals Indicator by Bill Williams, the Modified Fractals indicator and ZigZag indicator. You can use this peak and trough analysis tool to detect the price pattern made up from Equilibrium Fractal-Wave process. For further usage, there are good guide line on how to use this peak trough
FREE

An extremely convenient indicator that truly makes the process of making money on the exchange easy. It is based on the scientifically rigorous theory of the market developed by the author, the beginning of which is presented here . The full algorithm of this indicator operation is presented in the article . The indicator calculates the most probable price movement trajectory and displays it on the chart. Based on the predicted price movement trajectory

This indicator is a conventional analytical tool for tick volumes changes. It calculates tick volumes for buys and sells separately, and their delta on every bar, and displays volumes by price clusters (cells) within a specified bar (usually the latest one). The algorithm used internally is the same as in the indicator VolumeDelta , but results are shown as cumulative volume delta bars (candlesticks). Analogous indicator for MetaTrader 5 exists - VolumeDeltaBars . This is a limited substitution

The MACD Signal Candle indicator changes color according to the MACD trends. Colored Candles, based on MACD.
HOW IT WORKS
For a Buy: -If the indicator is above zero, the market is bullish. -If the market is bullish, you can take a stand with green candle signals. For a Sell: -If the indicator is below zero, the market is bearish. -If the market is bearish, you can take a stand with the red candles.
FREE
Double top and bottom indicator is a pattern scanning indicator which scans the tops and bottoms using zig zag pattern. When it find price bouncing back from the same point twice after a long trend then it generate arrow signals whenever the last resistance points is broken for double bottom and last support price broken for double top. Unlike other top bottom scanner it does not give only 1 signal. it alerts user when ever the last support /resistance is broker from double top/bottom pattern un
FREE
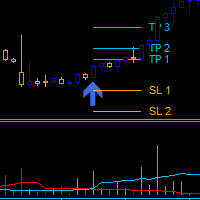
Dark Power is an Indicator for intraday trading. This Indicator is based on Trend Following strategy, also adopting the use of an histogram to determine the right power . We can enter in good price with this Indicator, in order to follow the strong trend on the current instrument. The histogram is calculated based on the size of the bars and two moving averages calculated on the histogram determine the direction of the signal
Key benefits
Easily visible take profit/stop loss lines Intui
Savez-vous pourquoi MetaTrader Market est le meilleur endroit pour vendre des stratégies de trading et des indicateurs techniques ? Pas besoin de publicité ou de protection logicielle, pas de problèmes de paiement. Tout est fourni dans le MetaTrader Market.
Vous manquez des opportunités de trading :
- Applications de trading gratuites
- Plus de 8 000 signaux à copier
- Actualités économiques pour explorer les marchés financiers
Inscription
Se connecter
Si vous n'avez pas de compte, veuillez vous inscrire
Autorisez l'utilisation de cookies pour vous connecter au site Web MQL5.com.
Veuillez activer les paramètres nécessaires dans votre navigateur, sinon vous ne pourrez pas vous connecter.