• Aperçu
  • Avis (21)
  • Commentaires (132)
  • Nouveautés

Blahtech Market Profile

4.53

Was: $249  Now: $149  

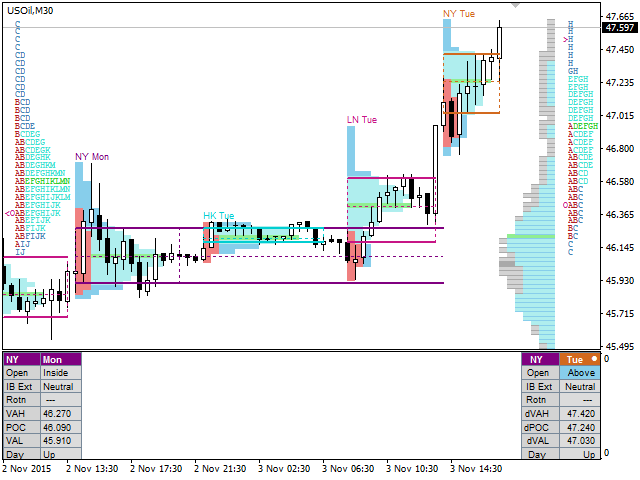
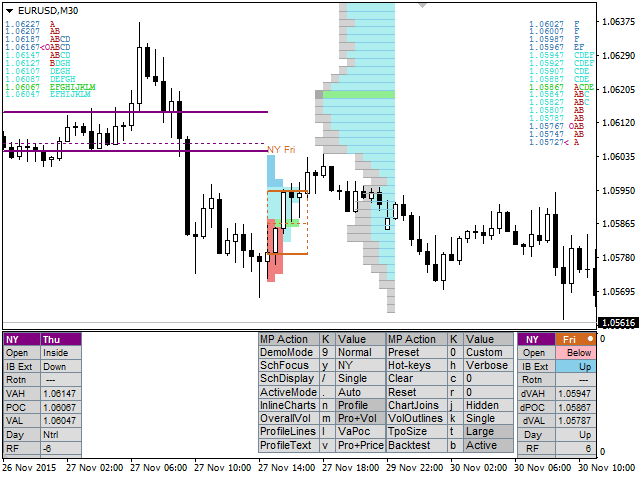
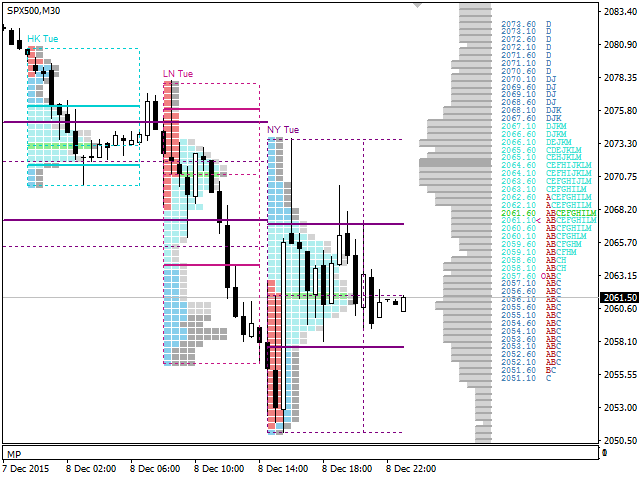
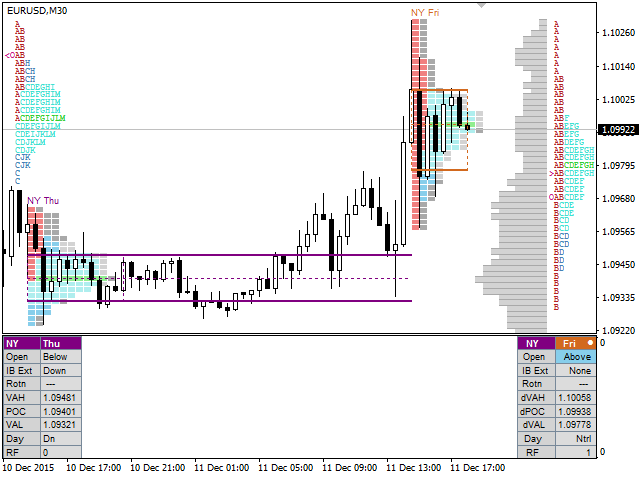
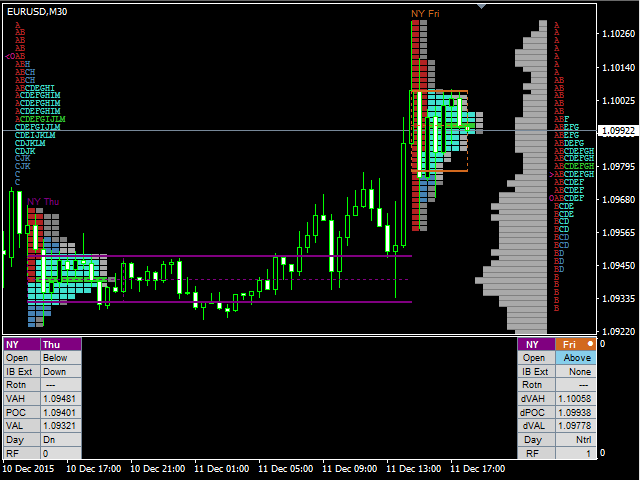
Market Profile defines a number of day types that can help the trader to determine market behaviour. A key feature is the Value Area, representing the range of price action where 70% of trading took place. Understanding the Value Area can give traders valuable insight into market direction and establish the higher odds trade. It is an excellent addition to any system you may be using.

Blahtech Limited presents their Market Profile indicator for the MetaTrader community. Inspired by Jim Dalton’s book “Mind Over Markets”, this indicator is designed to suit the needs of all profile traders. It delivers functionality usually only available on futures platforms and adds innovations like auto switching of focus and the backtest mode.

Links [ Documentation | Install | Update | Training All Products ]


Feature Highlights

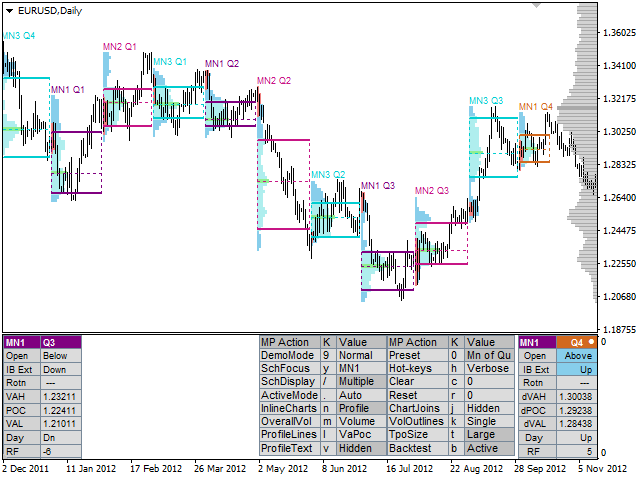
  • Configuration presets for schedules on higher timeframes
  • Auto switching of focus to next active session
  • Highlight of business rules – Open, IB Extension and Rotation Rules
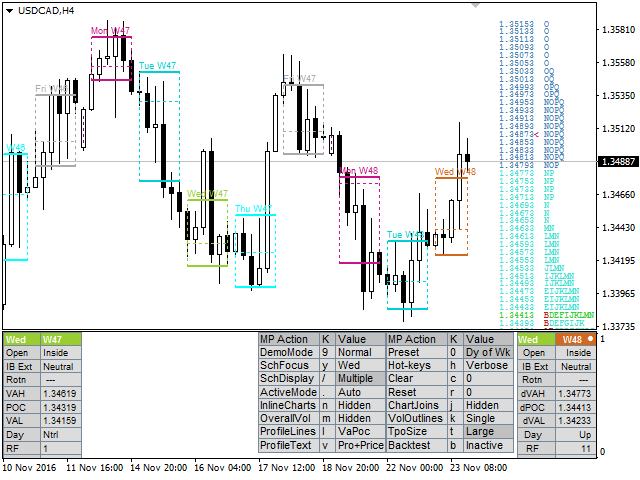
  • Multi-session display
  • Backtest directly on the chart
  • Custom session times
  • Custom intervals and timeframe period
  • Market and volume profiles
  • Overall market and volume profiles
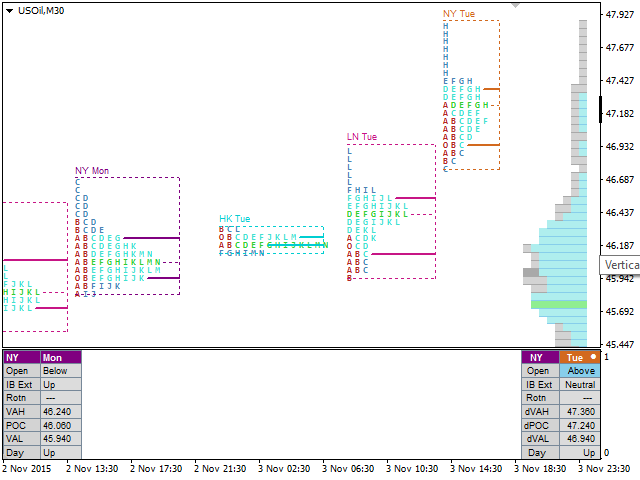
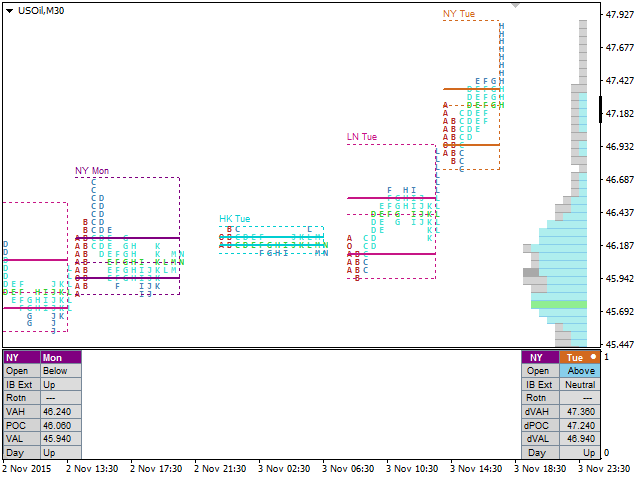
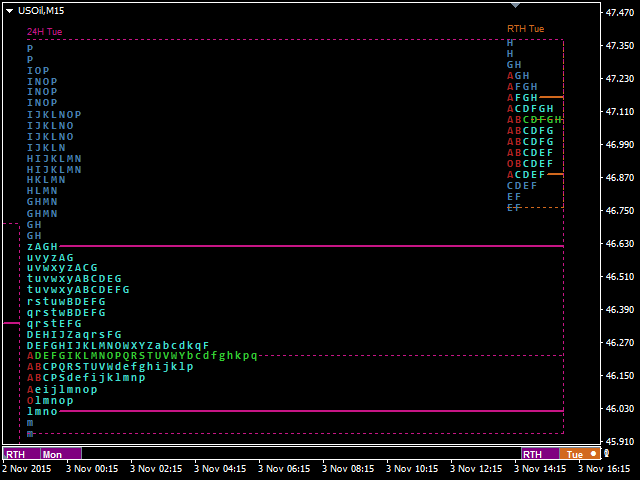
  • Text based TPO profiles
  • Configurable TPO start letter
  • Value area, Volume value area
  • Initial balance, Point of control
  • Fast access hot-keys


Developer buffers

Seven buffers, see full documentation for details


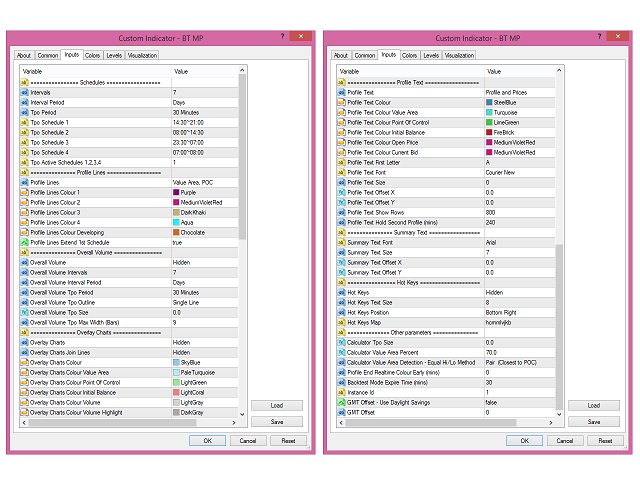
Input Parameters

Presets

  • Configuration Preset – Choose custom or predefined schedules. Hotkey “0”

Schedules

  • Intervals- Number of interval periods to display
  • Interval Period - Timeframe of the intervals (Days)
  • TPO Period - Timeframe for each TPO row (30 mins)
  • TPO size
  • TPO Schedule 1-7
  • TPO Schedule Names
  • TPO Schedule Display - Single / Multi. Hotkey “/”
  • TPO Schedule Active Mode - Auto/Man. Hotkey “.”
  • TPO Active Schedules - e.g. 2,1,3

Profile Lines

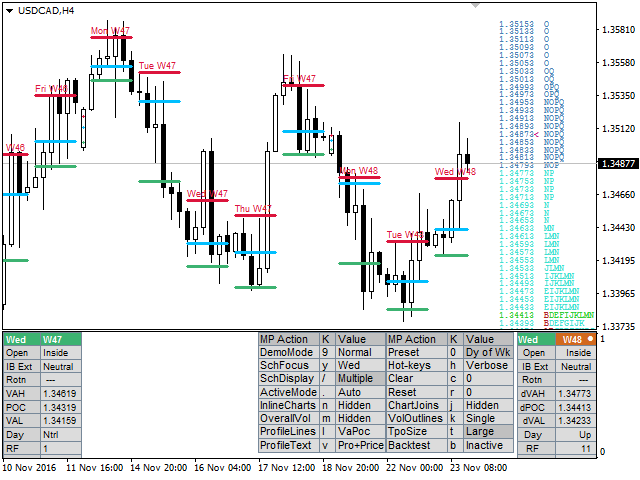
  • Profile Lines - Choose which lines are shown on chart. Hot-Key "L"
  • Profile Lines Colour 1-7, styles, fonts
  • Profile Lines Width Horizontal
  • Profile Lines Width Vertical - (0 to remove)
  • Profile Lines Titles - Choose the titles to be displayed on the chart
  • Profile Lines Extend Active Schedule - Extend previous active schedule lines to the next interval

Overall Volume

  • Overall Volume - Display graphic profile. Hot-Key "M"
  • Overall Volume Interval Period - Timeframe of the intervals (Days)
  • Overall Volume TPO Period - Timeframe for each TPO row (30 mins)
  • Overall Volume TPO size
  • Overall Volume TPO Outline - Outline style (Single line). Hot-Key "K"
  • Overall Volume TPO Size
  • Overall Volume TPO Offset (Bars)
  • Overall Volume Max Width (Bars)
  • Overall Volume Highlight Value Area
  • Overall Volume Custom Schedule

Overlay Charts

  • Overlay Charts - Display graphic profile. Hot-Key "N"
  • Overlay Charts Join Lines - Separators between each TPO. Hot-Key "J"
  • Overlay Charts Colours x7

Profile Text

  • Profile Text – Display text profile at the sides of the chart. Hot-Key "V"
  • Profile Text Colours x6
  • Profile Text Show Rows - Set limit for the maximum number of TPO rows to display
  • Profile Text First Letter - Start char for TPO letters (A)

Summary Text

  • Summary Text Font, Size, positions
  • Summary Text Composite Day Text

Hot Keys

  • Hot Keys - Display Hot Keys dialog. Hot-Key "H"
  • Hot Keys Text Size, Positions
  • Hot Key Map - Keyboard hot-key input map - Allows the user to re-assign the hot-keys

Other Parameters

  • Instance Id - Unique id for multiple instances per chart
  • Calculator Tpo Size Factor - Normal/Large TPO scaling. Hotkey “T”
  • Calculator Value Area Percent - TPO within the Value Area (70%)
  • Calculator Value Area Detection – Equal Hi/Low Method - Methodology when equal TPO above/below POC
  • Calculator Recalculate Tolerance (Percent TPO Size) – Schedules, Overall - Control price recalc triggers
  • Configuration Presets – Overall Volume Intervals – Override for presets
  • Profile End Realtime Colour Early (mins) - Stop the developing profile early
  • Backtest Mode Expire Time (mins) - Auto disable backtest
  • GMT Offset - Use Daylight Savings - Use Daylight savings. Adjust the time by 1 hour in March/September
  • GMT Offset - Manual GMT offset in seconds
Avis 21
OldBoomer
54
OldBoomer 2023.04.17 12:00 
 

Amazing tool! I love the ability to switch between, sessions, daily, weekly and quarterly profiles instantly.

Ninerair929
41
Ninerair929 2021.09.15 16:53 
 

This system is worth every dollar. Back up service also good

efecetinel
111
efecetinel 2021.05.05 20:16 
 

Perfect. Just perfect. Thank you.

Produits recommandés
L'indicateur SMC Venom Model BPR est un outil professionnel pour les traders travaillant dans le concept Smart Money (SMC). Il identifie automatiquement deux modèles clés sur le graphique des prix: FVG   (Fair Value Gap) est une combinaison de trois bougies, dans laquelle il y a un écart entre la première et la troisième bougie. Forme une zone entre les niveaux où il n'y a pas de support de volume, ce qui conduit souvent à une correction des prix. BPR   (Balanced Price Range) est une combinaiso
Daily Candle Predictor est un indicateur qui prédit le cours de clôture d'une bougie. L'indicateur est principalement destiné à être utilisé sur les graphiques D1. Cet indicateur convient à la fois au trading forex traditionnel et au trading d'options binaires. L'indicateur peut être utilisé comme un système de trading autonome, ou il peut servir de complément à votre système de trading existant. Cet indicateur analyse la bougie actuelle, calcule certains facteurs de force à l'intérieur du corps
BoxChart MT4
Evgeny Shevtsov
4.4 (5)
The market is unfair if only because 10% of participants manage 90% of funds. An ordinary trader has slim changes to stand against these "vultures". This problem can be solved. You just need to be among these 10%, learn to predict their intentions and move with them. Volume is the only preemptive factor that faultlessly works on any timeframe and symbol. First, the volume appears and is accumulated, and only then the price moves. The price moves from one volume to another. Areas of volume accumu
Blahtech Supply Demand
Blahtech Limited
4.58 (36)
Was: $299  Now: $149   Supply Demand uses previous price action to identify potential imbalances between buyers and sellers. The key is to identify the better odds zones, not just the untouched ones. Blahtech Supply Demand indicator delivers functionality previously unavailable on any trading platform. This 4-in-1 indicator not only highlights the higher probability zones using a multi-criteria strength engine, but also combines it with multi-timeframe trend analysis, previously confirmed swings
Master Scalping M1 est un indicateur innovant qui utilise un algorithme pour déterminer rapidement et avec précision la tendance. L'indicateur calcule le temps d'ouverture et de fermeture des positions, les algorithmes de l'indicateur vous permettent de trouver les moments idéaux pour entrer dans une transaction (acheter ou vendre un actif), ce qui augmente le succès des transactions pour la plupart des commerçants. Avantages de l'indicateur : Facile à utiliser, ne surcharge pas le graphique ave
The Chaikin Oscillator is a technical indicator developed by Marc Chaikin that combines price and volume data to measure the accumulation and distribution of a financial instrument. It aims to identify potential buying and selling opportunities in the market. The Chaikin Oscillator is calculated by subtracting a 10-day exponential moving average of the Accumulation Distribution Line (ADL) from a 3-day exponential moving average of the ADL. Here's how to use the Chaikin Oscillator indicator in tr
Indicateur Profil de Volume pour MT4 Obtenez un avantage en trading avec l'indicateur "Profil de Volume" pour MetaTrader 4 (MT4). Cet outil avancé d'analyse technique vous permet d'identifier avec précision les niveaux clés de support et de résistance basés sur le volume des transactions. Visualisez facilement les zones d'intérêt du marché, où les volumes d'échange sont les plus élevés, et utilisez ces informations pour prendre des décisions de trading plus éclairées. Caractéristiques principale
Un indicateur technique qui calcule ses lectures sur les volumes de transactions. Sous forme d'histogramme, il montre l'accumulation de la force de mouvement de l'instrument de trading. Il dispose de systèmes de calcul indépendants pour les directions haussières et baissières. Fonctionne sur tous les instruments de trading et délais. Peut compléter n’importe quel système commercial. L'indicateur ne redessine pas ses valeurs, les signaux apparaissent sur la bougie actuelle. Il est facile à utilis
L'indicateur construit les cotations actuelles, qui peuvent être comparées aux cotations historiques et, sur cette base, faire une prévision de l'évolution des prix. L'indicateur dispose d'un champ de texte pour une navigation rapide jusqu'à la date souhaitée. Option : Symbole - sélection du symbole que l'indicateur affichera ; SymbolPeriod - sélection de la période à partir de laquelle l'indicateur prendra des données ; IndicatorColor - couleur de l'indicateur ; HorisontalShift - décalage
Cosmic Diviner X Planet
Olena Kondratenko
4 (2)
This unique multi-currency strategy simultaneously determines the strength of trends and market entry points, visualizing this using histograms on the chart. The indicator is optimally adapted for trading on the timeframes М5, М15, М30, Н1. For the convenience of users, the indicator renders the entry point (in the form of an arrow), recommended take profit levels (TP1, TP2 with text labels) and the recommended Stop Loss level. The take profit levels (TP1, TP2) are automatically calculated for
Noize Absorption Index MT4
Ekaterina Saltykova
5 (1)
Noize Absorption Index - is the manual trading system that measures the difference of pressure between bears forces and bulls forces. Green line - is a noize free index that showing curent situation. Zero value of index shows totally choppy/flat market.Values above zero level shows how powerfull bullish wave is and values below zero measures bearish forces.Up arrow appears on bearish market when it's ready to reverse, dn arrow appears on weak bullish market, as a result of reverse expectation. S
TWO PAIRS SQUARE HEDGE METER INDICATOR Try this brilliant 2 pairs square indicator It draws a square wave of the relation between your two inputs symbols when square wave indicates -1 then it is very great opportunity to SELL pair1 and BUY Pair2 when square wave indicates +1 then it is very great opportunity to BUY pair1 and SELL Pair2 the inputs are : 2 pairs of symbols         then index value : i use 20 for M30 charts ( you can try other values : 40/50 for M15 , : 30 for M30 , : 10 for H1 ,
PZ Harmonacci Patterns
PZ TRADING SLU
3.17 (6)
Trade smarter, not harder: Empower your trading with Harmonacci Patterns This is arguably the most complete harmonic price formation auto-recognition indicator you can find for the MetaTrader Platform. It detects 19 different patterns, takes fibonacci projections as seriously as you do, displays the Potential Reversal Zone (PRZ) and finds suitable stop-loss and take-profit levels. [ Installation Guide | Update Guide | Troubleshooting | FAQ | All Products ] It detects 19 different harmonic pric
The indicator allows you to trade binary options. The recommended time frame is М1 and the expiration time is 1,2,3 minutes. The indicator suitable for auto and manual trading. A possible signal is specified as a arrows above/under a candle. You should wait until the candle closes! Arrows are not re-painted Trade sessions: TOKYO section (Half-end) Currency pairs: USD/JPY Working time frame: M1 Expiration time: 1,2,3 minutes. The indicator also shows good results when using the martingale strateg
FREE
VolumeProfile
Robert Hess
3.8 (5)
Descption: The Volume Profile displays detailed informations of historical trading activities at certain price levels (Market Profile). So you can locate the areas with the best prices in the market and get an advantage about other market participants. Features: Customizable Volume Profile / Market Profile Shows the "fair" Value Area with 70% of all Volume Shows critical low volume zones Shows VPOC, VAL and VAH Points Works on all timeframes Also available for MT5 ( https://www.mql5.com/en/mark
Volume Compair
Thiago Pereira Pinho
Professional Cumulative Delta & Volume Median Indicator Track   real buying/selling pressure   with this powerful volume analysis tool. The   Volume Compare Indicator   combines   Cumulative Delta   and   Volume Medians   to help you identify institutional activity, imbalances, and potential reversals. Key Features:   Cumulative Delta Histogram   – Visualizes net buying vs. selling volume in real-time.   Buy/Sell Volume Medians   – Horizontal lines showing average buy & sell volume lev
EZZ Elite Zig Zag is an indicator for the MetaTrader 4 terminal. This indicator traces the peak of the trend based on the market reversal, thus showing various opportunities in the financial market. EZZ Elite Zig Zag is a visual tool, intuitive, and easy to understand and use.  Test it Yourself by Downloading it for Free. Author Paulo Rocha all rights reserved
Infinity Trend Pro
Yaroslav Varankin
1 (1)
This is a trend indicator without redrawing Developed instead of the binary options strategy (by the color of the Martingale candlestick) Also works well in forex trading When to open trades (binary options) A signal will appear in the place with a candle signaling the current candle It is recommended to open a deal for one candle of the current timeframe M1 and M5 When a blue dot appears, open a deal up When a red dot appears, open a trade down. How to open trades on Forex. When a signal is rec
Auto Optimized MFI – Zones d’entrée adaptatives basées sur une simulation de trading réelle Auto Optimized MFI est un indicateur auto-ajustable qui utilise des simulations de trading réelles sur des données historiques pour déterminer les niveaux d’achat/vente MFI les plus efficaces pour votre marché et votre unité de temps. Il ne se base pas sur des seuils fixes 80/20, mais s’adapte au comportement réel des prix et des volumes. Fonctionnement Analyse les bougies historiques sur une plage person
Super Reversal Pattern
Parfait Mujinga Ndalika
Super Reversal Pattern Indicator Unlock the power of advanced pattern recognition with our Super Reversal Pattern Indicator. Designed for traders seeking precision and reliability, this indicator identifies one of the most effective reversal patterns in technical analysis, offering a significant edge in your trading strategy. Key Features: Non-Repainting Accuracy: Enjoy the confidence of non-repainting technology. Once a Super Reversal Pattern is detected, it remains static, providing consiste
For sure, this indicator has become very popular amongst traders. Through coding this indicator will give you the most accurate levels possible for your trading analysis. We have also added in the ability for you to receive alerts when the price breaks above or below a Support or Resistance lines! HOW TO USE The red rectangles represent your resistance/supply zone. The green rectangles represent your support/demand zone.  BONUS FEATURES We coded this indicator with the ability to switch between
Forex Gump
Andrey Kozak
2.4 (5)
Forex Gump is a fully finished semi-automatic trading system. In the form of arrows, signals are displayed on the screen for opening and closing deals. All you need is to follow the instructions of the indicator. When the indicator shows a blue arrow, you need to open a buy order. When the indicator shows a red arrow, you need to open a sell order. Close orders when the indicator draws a yellow cross. In order to get the most effective result, we recommend using the timeframes H1, H4, D1. There
Market Profile 3
Hussien Abdeltwab Hussien Ryad
3 (2)
Market Profile 3 MetaTrader 4 indicator  — is a classic Market Profile implementation that can show the price density over time, outlining the most important price levels, value area, and control value of a given trading session. This indicator can be attached to timeframes between M1 and D1 and will show the Market Profile for daily, weekly, monthly, or even intraday sessions. Lower timeframes offer higher precision. Higher timeframes are recommended for better visibility. It is also possible t
FREE
Simply The Best Pro
Szymon Palczynski
5 (1)
This indicator displays the histogram and arrows on chart. When Simple The Best Pro are placed on a chart, they identify the trend.  The color of may be blue or red. The blue color stands for upside moves and the red color stands for downside trends. The indicator offers to set Stop Loss (SL) and  Take Profit (TP)  setting. The default value is ATR. Indicator has automatic optimization. The STB is a unique indicator that shows the tendency (button Bars) of a particular signals. The STB tells us
We present you the indicator "Candle closing counter", which will become your indispensable assistant in the world of trading. That’s why knowing when the candle will close can help: If you like to trade using candle patterns, you will know when the candle will be closed. This indicator will allow you to check if a known pattern has formed and if there is a possibility of trading. The indicator will help you to prepare for market opening and market closure. You can set a timer to create a pre
The Th3Eng PipFinite indicator is based on a very excellent analysis of the right trend direction with perfect custom algorithms. It show the true direction and the best point to start trading. With StopLoss point and Three Take Profit points. Also it show the right pivot of the price and small points to order to replace the dynamic support and resistance channel, Which surrounds the price. And Finally it draws a very helpful Box on the left side on the chart includes (take profits and Stop loss
"Auto FIBO Pro" Crypto_Forex indicator - est un excellent outil auxiliaire dans le trading ! - L'indicateur calcule et place automatiquement sur le graphique les niveaux de Fibo et les lignes de tendance locales (couleur rouge). - Les niveaux de Fibonacci indiquent les zones clés où le prix peut s'inverser. - Les niveaux les plus importants sont 23,6 %, 38,2 %, 50 % et 61,8 %. - Vous pouvez l'utiliser pour le scalping inversé ou pour le trading en grille de zones. - Il existe également de nomb
Antabod Gamechanger
Rev Anthony Olusegun Aboderin
*Antabod GameChanger Indicator – Transform Your Trading!*   Are you tired of chasing trends too late or second-guessing your trades? The *Antabod GameChanger Indicator* is here to *revolutionize your trading strategy* and give you the edge you need in the markets!   Why Choose GameChanger? *Accurate Trend Detection* – GameChanger identifies trend reversals with *pinpoint accuracy*, ensuring you enter and exit trades at the optimal time.   *Clear Buy & Sell Signals* – No more guesswork! T
Owl smart levels
Sergey Ermolov
4.24 (37)
Version MT5  |  FAQ L' indicateur Owl Smart Levels   est un système de trading complet au sein d'un seul indicateur qui comprend des outils d'analyse de marché populaires tels que   les fractales avancées de Bill Williams , Valable ZigZag qui construit   la structure d'onde correcte   du marché et   les niveaux de Fibonacci   qui marquent les niveaux exacts d'entrée. sur le marché et les endroits où prendre des bénéfices. Description détaillée de la stratégie Mode d'emploi de l'indicateur Conse
Fibonacci retracement and extension line drawing tool Fibonacci retracement and extended line drawing tool for MT4 platform is suitable for traders who use  golden section trading Advantages: There is no extra line, no too long line, and it is easy to observe and find trading opportunities Trial version: https://www.mql5.com/zh/market/product/35884 Main functions: 1. Multiple groups of Fibonacci turns can be drawn directly, and the relationship between important turning points can be seen
Les acheteurs de ce produit ont également acheté
L'indicateur MT4 "Binary Smart Eye" est conçu pour fournir des signaux de trading pour les options binaires et les marchés forex, fonctionnant sur une large gamme d'unités de temps, de M1 à W1. Il emploie une stratégie propriétaire qui combine des niveaux de tendance, une moyenne mobile intelligente et des périodes de trading optimisées pour identifier les points d'entrée potentiels. Voici une ventilation de ses principales caractéristiques : Analyse multi-timeframes : La polyvalence de l'indica
Cycle Maestro
Stefano Frisetti
1 (1)
TRADING avec CYCLEMAESTRO Le signal est simple et immédiat : dès que le fond d'une zone devient vert ou rouge, cela signifie qu'un signal de TRADING est actif : VERT = ACHAT et ROUGE = VENTE. Le TRADER peut ouvrir le TRADE et suivre les instructions suivantes.  REMARQUE : CYCLEMAESTRO est distribué uniquement sur ce site Web, il n'y a pas d'autres distributeurs. La version DEMO est fournie à titre de référence uniquement et n'est pas prise en charge. La version finale est prise en charge et
Signal GoldRush Trend Arrow L'indicateur GoldRush Trend Arrow Signal fournit une analyse précise et en temps réel des tendances, spécialement conçue pour les scalpers à haute vitesse et à court terme sur la paire XAU/USD. Conçu spécialement pour les intervalles de temps d'une minute, cet outil affiche des flèches directionnelles indiquant clairement les points d'entrée, ce qui permet aux scalpers de naviguer en toute confiance dans des conditions de marché volatiles. L'indicateur se compose
Dynamic Forex28 Navigator
Bernhard Schweigert
5 (5)
Dynamic Forex28 Navigator - L'outil de trading Forex de nouvelle génération. ACTUELLEMENT 49 % DE RÉDUCTION. Dynamic Forex28 Navigator est l'évolution de nos indicateurs populaires de longue date, combinant la puissance de trois en un : Advanced Currency Strength28 Indicator (695 avis) + Advanced Currency IMPULSE avec ALERT (520 avis) + CS28 Combo Signals (Bonus). Détails sur l'indicateur https://www.mql5.com/en/blogs/post/758844 Qu'offre l'indicateur de force de nouvelle génération ? Tout
RelicusRoad Pro
Relicus LLC
4.63 (105)
Combien de fois avez-vous acheté un indicateur de trading avec de **grands backtests,** une **preuve de performance sur compte réel** avec des chiffres fantastiques et des **statistiques partout**, mais après l'avoir utilisé, vous **finissez par vider votre compte ?** Vous ne devriez pas faire confiance à un signal seul, vous devez savoir pourquoi il est apparu en premier lieu, et c'est ce que RelicusRoad Pro fait de mieux ! Manuel de l'utilisateur + Stratégies + Vidéos de formation + Groupe pr
L'indicateur « Dynamic Scalper System » est conçu pour la méthode de scalping, permettant de trader au sein des vagues de tendance. Testé sur les principales paires de devises et l'or, il est compatible avec d'autres instruments de trading. Fournit des signaux pour l'ouverture de positions à court terme le long de la tendance, avec un support supplémentaire pour les fluctuations de prix. Principe de l'indicateur : De grandes flèches déterminent la direction de la tendance. Un algorithme de gén
Unlimited use version is available at $180 sale. Sale will last for first few months. (actual price $210 after that)  Detailed blog post with screenshots here: https://www.mql5.com/en/blogs/post/762513 Features: This scanner will show: NRTR Basket Trading Trend direction Last NRTR Switch (breakout) - number of bars and if it was a high volume bar How many bars has the SR stayed steady for When price last entered an NRTR shadow When price bounced off the NRTR shadow back inside NRTR Explained:
Beast Super Signal
Dustin Vlok
4.73 (89)
Vous recherchez un puissant indicateur de trading forex qui peut vous aider à identifier facilement des opportunités de trading rentables ? Ne cherchez pas plus loin que le Beast Super Signal. Cet indicateur basé sur les tendances facile à utiliser surveille en permanence les conditions du marché, en recherchant de nouvelles tendances en développement ou en sautant sur celles existantes. Le Beast Super Signal donne un signal d'achat ou de vente lorsque toutes les stratégies internes s'alignent e
BinaryIndicator
Andrey Spiridonov
BinaryIndicator is a highly accurate indicator for trading binary options. It shows excellent results in scalping. This indicator is based in multifactor analysis of trend indicators, as well as confirmation oscillators, which in the end gives an increased accuracy of signals. Advantages of the indicator Increased accuracy of signals. Excellent results when trading binary options with a short expiration time from M30 to M1 . It works on any timeframes. Works with any trade symbols. Parameters
Actuellement 20% de réduction ! La meilleure solution pour tout débutant ou trader expert ! Ce logiciel de tableau de bord fonctionne sur 28 paires de devises. Il est basé sur 2 de nos principaux indicateurs (Advanced Currency Strength 28 et Advanced Currency Impulse). Il donne un excellent aperçu de l'ensemble du marché Forex. Il montre les valeurs de l'Advanced Currency Strength, la vitesse de mouvement des devises et les signaux pour 28 paires de devises dans tous les (9) délais. Imaginez
Linear Trend Predictor - Un indicateur de tendance qui combine des points d'entrée et des lignes de support de direction. Fonctionne sur le principe de franchissement du canal des prix haut/bas. L'algorithme de l'indicateur filtre le bruit du marché, prend en compte la volatilité et la dynamique du marché. Capacités de l'indicateur  À l'aide de méthodes de lissage, il montre la tendance du marché et les points d'entrée pour l'ouverture d'ordres d'ACHAT ou de VENTE.  Convient pour déterminer l
Supply and Demand Dashboard PRO
Bernhard Schweigert
4.8 (20)
Actuellement 20% de réduction ! Ce tableau de bord est un logiciel très puissant qui fonctionne sur plusieurs symboles et jusqu'à 9 horizons temporels. Il est basé sur notre indicateur principal (Best reviews : Advanced Supply Demand ).   Le tableau de bord donne une excellente vue d'ensemble. Il montre :  Les valeurs d'offre et de demande filtrées, y compris l'évaluation de la force de la zone, Les distances en pips vers/et dans les zones, Il met en évidence les zones imbriquées, Il donne 4
Enigmera
Ivan Stefanov
5 (8)
ENIGMERA : Le cœur du marché Important : La démo de MQL5.com fonctionne dans le Strategy Tester et peut ne pas refléter pleinement les fonctionnalités d'Enigmera. Consultez la description, les captures d'écran et la vidéo pour plus de détails. N'hésitez pas à m'envoyer un message si vous avez des questions ! Le code de l'indicateur a été entièrement réécrit. La version 3.0 ajoute de nouvelles fonctionnalités et corrige les bugs accumulés depuis le lancement de l'indicateur. Introduction Cet in
NAM Order Blocks
NAM TECH GROUP, CORP.
3.67 (3)
MT4 Multi-timeframe Order Blocks detection indicator. Features - Fully customizable on chart control panel, provides complete interaction. - Hide and show control panel wherever you want. - Detect OBs on multiple timeframes. - Select OBs quantity to display. - Different OBs user interface. - Different filters on OBs. - OB proximity alert. - ADR High and Low lines. - Notification service (Screen alerts | Push notifications). Summary Order block is a market behavior that indicates order collection
Hello, I am Ayman from Egypt, I want to present an interesting indicator to you. It depends on Ichimoku Kinko Hyo, but there is a secret that i use in it. By using my indicator, you will be able to know a lot of important information in the market such as: Live Signal : https://www.mql5.com/en/signals/821024 Features You can avoid entry during market turbulence You can enter orders on the general trend only You will know if the trend is strong or weak If you entered an any orders by the help of
IQ Gold Gann Levels a non-repainting, precision tool designed exclusively for XAUUSD/Gold intraday trading. It uses W.D. Gann’s square root method to plot real-time support and resistance levels, helping traders spot high-probability entries with confidence and clarity. William Delbert Gann (W.D. Gann) was an exceptional market analyst, whose trading technique was based on a complex blend of mathematics, geometry, astrology, and ancient mathematics which proved to be extremely accurate. Download
TPSpro RFI Levels
Roman Podpora
4.85 (27)
Zones de retournement / Volumes de pointe / Zones actives d'un acteur majeur =       SYSTÈME TS TPSPRO INSTRUCTIONS RUS       /       INSTRUCTIONS       FR       /       Version MT5 Chaque acheteur de cet indicateur reçoit en plus GRATUITEMENT : 6 mois d'accès aux signaux de trading du service RFI SIGNALS - points d'entrée prêts à l'emploi selon l'algorithme TPSproSYSTEM. Supports de formation avec mises à jour régulières - plongez-vous dans la stratégie et développez votre niveau professionne
TPA True Price Action indicator reveals the true price action of the market makers through 100% non-repainting signals (except early signals mode) strictly at the close of a candle! TPA shows entries and re-entries, every time the bulls are definitely stronger than the bears and vice versa. Not to confuse with red/green candles. The shift of power gets confirmed at the earliest stage and is ONE exit strategy of several. There are available now two free parts of the TPA User Guide for our custom
Introduction to Fractal Pattern Scanner Fractal Indicator refers to the technical indicator that makes use of the fractal geometry found in the financial market. Fractal Pattern Scanner is the advanced Fractal Indicator that brings the latest trading technology after the extensive research and development work in the fractal geometry in the financial market. The most important feature in Fractal Pattern Scanner is the ability to measure the turning point probability as well as the trend probabi
Pairs Trading Dashboard - Spearman Correlation and Stationary Z-Score  is a custom indicator designed for the MetaTrader 4 (MT4) platform, developed to assist traders in analyzing and monitoring currency pairs for pairs trading strategies. It utilizes Spearman’s rank correlation coefficient and Z-Score calculations to identify trading signals across multiple timeframes and currency pairs. The indicator integrates various technical filters and stationarity tests to refine signal generation and di
Algo Trading Indicaor  With this indicator , you’ll have zones and trends that hight probability the price will reverse from it. so will gives you all the help that you need  Why should you join us !?  1-This indicator is logical since it’s working in previous days movement , to predict the future movements. 2-Algo trading indicator will help you to draw trends which is special and are too strong than the basics trend , trends will change with the frame time that you work on . 3-We can use
L'indicateur de niveaux de trading est un système commercial conçu pour déterminer les points d'entrée, maintenir les positions et la direction des tendances. Comprend plusieurs mécanismes fonctionnant dans un complexe, analyse des vagues de la direction de la tendance, analyse de niveau lors de la construction des signaux, montre les cibles TP et SL possibles. Capacités de l'indicateur Des flèches de signalisation apparaissent sur la bougie actuelle et ne sont pas recolorées. Utilise des algo
"Sentiments of traders" in the financial markets is a topic that has been of interest to us for a long time. In time, we could not find the right formula to define these sentiments. We went through many stages in the search for the right methodology - from taking data from external sources to calculate open positions of buyers and sellers to calculating tick volumes, but still we were not satisfied with the results. The calculation of open positions of buyers and sellers from external sources ha
MR Range Breakouts 4
Sergey Khramchenkov
5 (1)
" A trading range occurs when a financial instrument trades between constant high and low prices over a period of time. The upper part of the trading range of a financial instrument often provides price resistance, while the lower part of the trading range usually offers price support.  Traders can enter in the direction of a breakout or breakdown from a trading range... " This is the "Classical Theory" understanding of ranges. We have a different understanding of the nature of ranges and the
We publish the indicator as a useful tool in trading and call this indicator the "Swiss Army Knife" because it provides many possibilities and combinations to help understand the material on the "Masters of Risk" trading system. The indicator itself is not part of the tools used in the "Masters of Risk" trading system. The indicator consists of 3 separate multi-timeframe indicators, which in combination with each other help to reduce the "noise" of false signals. The first of the indicators are
Supreme Commander
Ramon Sobrevals Arce
4.13 (8)
The indicator of the indicators. The Most Powerful Technique to Determine Forex Trend Strength in 2023. We have perfected Supreme Commander that it calculates an average of the selected indicators (up to 16) and the selected timeframe (all) with the result of a single trend that indicates the potential of buying and selling.  It includes the following indicators: Accelerator/Decelerator oscillator Average Directional Movement Index Awesome oscillator; Bulls and Bears  Commodity Channel Index; De
IQ FX Gann Levels a precision trading indicator based on W.D. Gann’s square root methods. It plots real-time, non-repainting support and resistance levels to help traders confidently spot intraday and scalping opportunities with high accuracy. William Delbert Gann (W.D. Gann) was an exceptional market analyst, whose trading technique was based on a complex blend of mathematics, geometry, astrology, and ancient mathematics which proved to be extremely accurate. Download the Metatrader 5 Version M
Hidden Cycles
Lev Vladimirovic Marushkin
5 (1)
Based on Universal Laws — NOT Some Guy’s Algorithm: Let the market adjust to the Hidden Cycles Geometry — not the other way around. Most indicators are based on a man-made formula. They often lag, fail over time, or need constant re-optimization.  Hidden Cycles is different. It’s the first and only MT4 indicator rooted in universal proportion and perfect relation — the invisible structure that governs all market behavior. Inspired by ideas from Fibonacci, Gann, and Murrey — and built as somethi
Weis Wave with Alert
Trade The Volume Waves Single Member P.C.
4.82 (22)
Rental/Lifetime Package Options and Privileges' Rent Monthly Six Months   Yearly/Lifetime Weis Wave with Speed with Alert+Speed Index x x x Manual  x x x Quick Set up Video x x x Blog x x x Lifetime Updates x x x Setup and Training Material x x Rectangle Break Alert Tool      x Discord Access Channel "The SI traders" x   How to trade info visit:    http://www.tradethevolumewaves.com   ** If you purchase please contact me to setup your  : training Room and  complete manual access.  This is
TrendMaestro
Stefano Frisetti
4 (4)
note: this indicator is for METATRADER4, if you want the version for METATRADER5 this is the link:  https://www.mql5.com/it/market/product/108106 TRENDMAESTRO ver 2.4 TRENDMAESTRO recognizes a new TREND in the bud, he never makes mistakes. The certainty of identifying a new TREND is priceless. DESCRIPTION TRENDMAESTRO identifies a new TREND in the bud, this indicator examines the volatility, volumes and momentum to identify the moment in which there is an explosion of one or more of these data a
Plus de l'auteur
Blahtech Candle Timer MT5
Blahtech Limited
4.85 (126)
Over 100,000 users on MT4 and MT5 Blahtech Candle Timer displays the remaining time before the current bar closes and a new bar forms. It can be used for time management Links [  Install  |  Update  |  Training  ] Feature Highlights The only candle timer on MT5 with no stutter and no lag S electable Location Tracks server time not local time Multiple colour Schemes Configurable Text Customisable alerts and messages Optimised to reduce CPU usage Input Parameters Text Location - Beside / Upper Le
FREE
Blahtech Supply Demand MT5
Blahtech Limited
4.54 (13)
Was: $299  Now: $149  Supply Demand uses previous price action to identify potential imbalances between buyers and sellers. The key is to identify the better odds zones, not just the untouched ones. Blahtech Supply Demand indicator delivers functionality previously unavailable on any trading platform. This 4-in-1 indicator not only highlights the higher probability zones using a multi-criteria strength engine, but also combines it with multi-timeframe trend analysis, previously confirmed swings
Was: $249  Now: $149   Market Profile defines a number of day types that can help the trader to determine market behaviour. A key feature is the Value Area, representing the range of price action where 70% of trading took place. Understanding the Value Area can give traders valuable insight into market direction and establish the higher odds trade. It is an excellent addition to any system you may be using. Inspired by Jim Dalton’s book “Mind Over Markets”, this indicator is designed to suit the
Blahtech Candle Timer
Blahtech Limited
4.83 (92)
Over 100,000 users on MT4 and MT5 Blahtech Candle Timer displays the remaining time before the current bar closes and a new bar forms. It can be used for time management Links [  Install  |  Update  |  Training  ] Feature Highlights The only candle timer on MT4 with no stutter and no lag S electable Location Tracks server time not local time Multiple colour Schemes Configurable Text Customisable alerts and messages Optimised to reduce CPU usage Input Parameters Text Location   - Beside / Upper
FREE
Blahtech Supply Demand
Blahtech Limited
4.58 (36)
Was: $299  Now: $149   Supply Demand uses previous price action to identify potential imbalances between buyers and sellers. The key is to identify the better odds zones, not just the untouched ones. Blahtech Supply Demand indicator delivers functionality previously unavailable on any trading platform. This 4-in-1 indicator not only highlights the higher probability zones using a multi-criteria strength engine, but also combines it with multi-timeframe trend analysis, previously confirmed swings
Blahtech VWAP MT5
Blahtech Limited
5 (1)
Was: $69  Now: $49   Blahtech VWAP - Volume Weighted Average Price (VWAP) is the ratio of price to total volume. It provides an average price over a specified time interval.  Links [  Install  |  Update  |  Documentation   ] Feature Highlights Configurable VWAP Line Sessions, intervals, anchored or continuous Previous day settlement line Standard Deviation bands Alerts at bar close or real time Automatic Broker or Tick volumes Significantly reduced CPU usage Input Parameters Expert Advisor Mo
Blahtech Moving Average indicator is a multitimeframe version of the standard Moving Average indicator. It is also enhanced with customisable alerts, period breaks and other configuration options. The 50 day and 200 day moving averages are widely followed by investors and traders, with breaks above and below the MA lines considered to be signals of interest. Links [  Install  |  Update  |   Training   |   All Products  ] Feature Highlights Up to three timeframes Configurable calculation variabl
FREE
Was: $99  Now: $49  Blahtech Daily Range indicator displays the average daily range alongside the individual session ranges. Using the daily open price as a reference the indicator shows fixed range and dynamic range targets as lines on the charts. These lines clearly show when the average range has been exhausted. Daily and session ranges can be useful for confirming entries or setting targets and is an excellent odds enhancer for many trading systems. Links [  Documentation   |   Install  |  U
Blahtech Moving Average
Blahtech Limited
5 (5)
Blahtech Moving Average indicator is a multitimeframe version of the standard Moving Average indicator. It is also enhanced with customisable alerts, period breaks and other configuration options. The 50 day and 200 day moving averages are widely followed by investors and traders, with breaks above and below the MA lines considered to be signals of interest. Links [  Install  |  Update  |   Training   |   All Products  ] Feature Highlights Up to three timeframes Configurable calculation variabl
FREE
Blahtech VWAP
Blahtech Limited
5 (3)
Was: $69    Now: $49   Blahtech VWAP - Volume Weighted Average Price (VWAP) is the ratio of price to total volume. It provides an average price over a specified time interval.  Links [  Install  |  Update  |  Documentation   ] Feature Highlights Configurable VWAP Line Sessions, intervals, anchored or continuous Previous day settlement line Standard Deviation bands Alerts at bar close or real time Automatic Broker or Tick volumes Significantly reduced CPU usage Input Parameters Expert Advisor
Blahtech Fisher Transform indicator is an oscillator that displays overbought and oversold locations on the chart. The Fisher Transform algorithm transforms prices with any distribution shape into a normal distribution. The end result is a curve with sharp turning points that may help to identify bullish or bearish trends. Fisher Transform values exceeding 1.66 on the daily chart are considered to be good areas for reversal trades. Links [  Install  |  Update  |  Training   |  All Products  ] F
Was: $49    Now: $33   Blahtech Better Volume provides an enhanced version of the vertical volume bars. Each bar is compared to the previous 20 bars. Depending on its volume, range and volume density it will be assigned a state and colour. Low Volume – Minimum volume High Churn   – Significant volume with limited movement Climax Neutral –   High volume with unclear direction Climax Up   – High volume with bullish direction Climax Dn   – High volume with bearish direction Climax Churn – High vol
Blahtech Daily Range
Blahtech Limited
4.8 (5)
Was: $99    Now: $49   Blahtech Daily Range indicator displays the average daily range alongside the individual session ranges. Using the daily open price as a reference the indicator shows fixed range and dynamic range targets as lines on the charts. These lines clearly show when the average range has been exhausted. Daily and session ranges can be useful for confirming entries or setting targets and is an excellent odds enhancer for many trading systems. Links [  Documentation   |   Install  
Blahtech Better Volume
Blahtech Limited
3 (2)
Was: $49    Now: $33   Blahtech Better Volume provides an enhanced version of the vertical volume bars. Each bar is compared to the previous 20 bars. Depending on its volume, range and volume density it will be assigned a state and colour. Low Volume – Minimum volume High Churn   – Significant volume with limited movement Climax Neutral –   High volume with unclear direction Climax Up   – High volume with bullish direction Climax Dn   – High volume with bearish direction Climax Churn – High vol
Blahtech Fisher Transform indicator is an oscillator that displays overbought and oversold locations on the chart. The Fisher Transform algorithm transforms prices with any distribution shape into a normal distribution. The end result is a curve with sharp turning points that may help to identify bullish or bearish trends. Fisher Transform values exceeding 1.66 on the daily chart are considered to be good areas for reversal trades. Links [  Install  |  Update  |  Training   |  All Products  ] F
Filtrer:
OldBoomer
54
OldBoomer 2023.04.17 12:00 
 

Amazing tool! I love the ability to switch between, sessions, daily, weekly and quarterly profiles instantly.

Ninerair929
41
Ninerair929 2021.09.15 16:53 
 

This system is worth every dollar. Back up service also good

DaJenks Jenks
323
DaJenks Jenks 2021.05.19 05:25 
 

It works I just have to figure it out

Shuman Rotula
33
Shuman Rotula 2021.05.10 13:35 
 

L'utilisateur n'a laissé aucun commentaire sur la note

efecetinel
111
efecetinel 2021.05.05 20:16 
 

Perfect. Just perfect. Thank you.

sincitytrader
84
sincitytrader 2021.02.10 20:15 
 

L'utilisateur n'a laissé aucun commentaire sur la note

Gui Jacobucci
73
Gui Jacobucci 2020.12.19 18:49 
 

Absolutely Outstanding indicator! Bought the Indicator, installed and it was straight forward. Once installed I have set it up as per my needs and it is working perfectly.

Nicolas Dobrovsky
824
Nicolas Dobrovsky 2020.09.18 11:44 
 

The best market profile indicator for MT4 on the market. Great alternative if you don't want to use Sierra chart or Ninja trader.

T3chAddict
64
T3chAddict 2020.09.17 15:21 
 

Great tool. I had used other market profile indicators before that were just crashing MT4. Finally an indicator that works well and is very clear to use. Plus, like the other indicators, has a back-testing mode that is very useful.

Kostbar
514
Kostbar 2020.05.13 15:44 
 

Bester Indikator ... vielseitig, präzise, zuverlässig ... absolute Kaufempfehlung!

Lorant Nemeth
393
Lorant Nemeth 2020.01.19 22:21 
 

Extremely detailed and profession tool for Volume Profile trading.

Thank you

cvdestyfx
2742
cvdestyfx 2019.10.14 21:06 
 

Three stars due to lack of sufficient material explaining the purpose of each setting and how to use it. When you are selling a high-end indicator such as this with so many settings, you should at least provide sufficient documentation (with images) explaining how to use each setting and what its purpose is. You have provided some material, but for the most part, you have left it up to the user to figure out how to use the indicator. That's not a professional way to do business.

jaya thilaka
275
jaya thilaka 2019.06.29 08:40 
 

Highly recommended tool

Thomas Fairhurst
1186
Thomas Fairhurst 2019.06.15 10:30 
 

Waste of money! Most of the times doesn't show anything, no profile at all. If it shows any profile it is with barely any detail. Highly overrated! Not recommended for purchase.

Minh Nguyen Nam
1535
Minh Nguyen Nam 2017.09.05 04:24 
 

it is a great tool for traders. Thanks for your development!

Best,

Minh

Ng Choong Huan
229
Ng Choong Huan 2017.06.06 06:29 
 

The best indicator on MT4 market.

Useful and fully functional.

Highly recommended.

Marco Gundel
956
Marco Gundel 2017.04.12 20:40 
 

I bought this indicator together with the Daily Range indicator over a month ago so that I can give an honest review. I have to say....just as the Daily Range Indicator, Market Profile is amazing. I have this indicator currently running on 15 charts at the same time on an older PC and I have not once experienced a slowdown or freezing of MT4. The features in this indicator are truly amazing, which makes my life so much easier. Thank you Blahtech :-)

Julian Lo
715
Julian Lo 2017.01.20 15:39 
 

L'utilisateur n'a laissé aucun commentaire sur la note

cozyman
321
cozyman 2016.04.30 13:10 
 

I can't compliment Blahtech limited and Deeyana enough, they have made excellent work providing these high quality indicators for sale.

simply the best market profile I have seen for Mt4, they are professional indicators for people who want the best tools available,

I bought the market profile and they even customized it for me at no extra cost, that is a great company and great people. the indicators cost a bit more than others out there, but the quality and features they provide makes no comparison on the Mt4 market, and easily makes up for the price, totally worth it if you want the best tools! recommended

Lee Bryant
2676
Lee Bryant 2016.04.04 18:05 
 

L'utilisateur n'a laissé aucun commentaire sur la note

12
Répondre à l'avis
Version 4.1 2024.07.02
- Keyboard - Fix Ctrl Click issue
Version 4.0 2024.04.09
- Keyboard - Fix Ctrl and Shift Click mappings on MT5
Version 3.9 2024.01.11
- Asian Session - Change default TK session to 01:30
- Add Initial Balance Size (IB Size) to Summary Panel
- Keyboard - Fix Ctrl and Shift Click mappings on MT5
Version 3.8 2022.02.07
- Highlight Open Above High and Open Above Low in the Summary panels
- Add option to display close price in the summary panels
- Fix Halfback colour parameter
- Add Preset file with colour scheme for dark backgrounds
Version 3.7 2021.05.18
Enhancements
- Add Overall Volume Show Value Areas parameter

Fixes
- Reduce number of calculations when snap to grid is enabled
- Improve auto TPO size for futures contracts with single digit quotes
Version 3.6 2021.05.10
Fixes:
- Hotkeys - Keep Hotkey panel hidden when switching timeframes
Version 3.5 2021.05.05
Enhancements
- Profiles - Add parameter "Clear Hotkeys On Terminal Close" to improve profile switching on MT5
- Offline Charts - Add support for offline charts and backtest tools with missing market data and unsynced current time

Fixes
- Mouse Events - Keep CHART_EVENT_MOUSE_MOVE enabled if other indicators are waiting on mouse events
Version 3.4 2021.04.20
Enhancements
- MT5 - Add support for extended timeframes

Performance
- Clear Hotkey - Improve performance of clear chart calls
- Recalc Triggers - TpoTolerance - Ensure consistency across snapped to grid and unsnapped profiles
Version 3.3 2021.04.08
Enhancements
- Snap To Grid - Add option to map TPO to a fixed price grid rather than TPO stacked from lowest price (Dalton)
- Snap to Grid - Add parameter to offset all the TPO prices (TPO Size factor)
- Snap to Grid - Add button to Hotkey Panel
- Line Extensions - Add button to Hotkey panel

Fixes
- Max TPO Rows - Change default from 300 => 150
- Demo Modes - Add Snap To Grid and Line Extensions to demo modes
- Demo Modes - Improve handling of user set parameters in the strategy tester

Performance
- Hotkeys - Reduce redraw time when hotkeys pressed (especially with large numbers of profiles)
- Real time - Reduce number of calculations when TPO Tolerance parameter is set
- Real time - Reduce number of calculations when Snap To Grid is enabled
Version 3.2 2021.03.04
Enhancements
- Summary Panel - Highlight increased Tpo Size when Max Tpo Rows limit is breached
- Parameters - Write simple list of changed parameters to experts log when Ctrl+Q keys are pressed
- Parameters - Create detailed report of changed parameters in Files/Blahtech directory to assist users and support

Fixes
- Tpo Size - Improve automatic calculation for assets with one digit prices
- Tpo Size - Improve recalulation of Tpo Size when Max Tpo Rows limit is breached
- Max Tpo Rows - Change default from 500 => 300
- Expert Advisor Mode - Change to a single option named "Reserved For iCustom Calls"
Version 3.1 2021.01.20
Enhancements
- Volume Text - Add parameters to set colour and size of chart volume text
- Inline Charts - Add "Volume Separate" and "Volume Opposing" graphics chart options
- Inline TPO Charts - Decouple "Inline Charts" from "Inline TPO" so both can be on the chart concurrently
- Profile Line Titles - Add parameter to allow user to set custom text for the chart profile titles
- Chart Zones - Add parameter "Ranges - Draw To End Time" to extend drawing of session zone boxes to the next candle (Default false)
- Profile text - Add parameter "Profile Text Show Previous" to control display of previous profile text on left of chart
- Prices - Add parameter "Profile Lines Prices Only Show Final" to clean up display by only showing prices for last profile
- Intervals - Add "Decades" to the intervals to enable creation of longer term profiles (also add five year preset file)

Fixes
- Summary Panel - Improve text scaling and layout of Summary Panels
- Summary Text Size - Change default text size from 7 to 8 for clarity on 27 inch 1440p monitors
- Expanded letter TPO - Draw Sunday letters correctly on Sunday candles (Mn Of Qu preset)
- Profile Text - Fix font scaling on right hand profile text
Version 2.9 2019.08.01
Enhancements
- Add option to display Interval + Session for profile titles
- Add IntervalMultipler to support more advanced schedules

Fixes
- Clear candles from the chart when Style is set to Letters
Version 2.8 2019.06.19
Enhancements
- Add parameter to configure Calculator Max Tpo Rows
- Add option to display Halfback profile lines on the chart
- Left clicking any description in the Hud Panel now resets the value back to its input parameter version

Fixes
- Fix custom schedules for Overall Volume
- Do not override user set TPO sizes when cycing through presets
- Change defaults to display more features on chart at startup
- Remove extended profile lines from Days Of weeks preset
- PocLine PocArea - Reformat and swap display values round so MaxTpoWidth comes before TotalTpo
Version 2.7 2018.05.15
Changes
- Remember Chart Clear setting on terminal restart
- Use TPO Size as the default when Vol TPO Size is 0.0
- Set Chart Joines to Hidden for demo modes
Version 2.5 2017.08.29
Enhancements
- Add option to set number of bars for initial balance and/or rotation rule
- Add option to set hourly intervals for profiles on the lowest timeframes
- Add option to display the prices for the profile lines
- Add option to display Naked POC extension profile lines
- Add option to display volume text alongside the TPO rows
- Add option to configure the Open and Close letters within the profile text
- Remember hotkey states when restarting terminal
- Support iCustom calls with 64+ parameters by using a set file

Fixes/Changes
- Only highlight rotation rule when it closes within the configured bars
- Add tooltips to summary panel rows
- Add reserved keys parameter to prevent clashes with other products
Version 2.3 2017.04.06
Enhancements
- Support individual start letters for each schedule
- Support simple statistics in profile titles

Fixes
- Fixed the order that inline charts are displayed when shift-"n" key is used
- Clear Charts - Forced redraw rather than waiting for next tick
- Rebuilt with latest compiler for MetaTrader platform changes
Version 2.2 2017.03.09
New features
- Added inline charts with TPO letters and expanded TPO letters

Enhancements
- Added the option to clear candles from the chart
- Added the option to exclude weekend schedules
- Allows a user to choose schedules for multi session display
= Inline charts
- Added "Profile and Volume Separate" and "Profile and Volume Opposing"
- Added the option to display charts as bars
- Allows a user to adjust font sizes and spaces of inline letters
= Presets
- Added "TPOs" demo mode
- Added the "Futures Of Days" profile (AMP Futures setup)
= Summary Panel:
- Option to hide the panel
- Allows a user to configure row contents
= Hotkey panel:
- Added the button for auto/fixed price scale
- Added the button for broker/tick volumes
- Added the buttons for adjusting TPO letter font sizes/spaces
- Reverse order of hotkey changes when the Shift key is pressed
- Support multi region keyboard layouts

Fixes
- Improved default TPO tick sizes
- Changed HK session to start at midnight
- Improved scaling of panels when font sizes are changed
- Changed timeframe enums, so MT5 version can share set files with MT4 version
- Support 8-digit instruments in summary panel

Performance
- Backtest - only redraw older schedules when the day changes
- Optimized the code that gets executed each tick

New Hotkeys
- "`" - chart candles - show/clear
- "7" - inline TPOs - graphics/TPOs/expanded TPOs
- "e" - inline TPOs - adjust a font size

Parameters
- See the parameters documentation for details - http://www.blahtech.co.uk/marketprofile
Version 2.0 2016.12.09
New Features
- Support multiple developing schedules HK,LN,NY rather than just the first one in the list
- Automatically switch focus to the next session as it becomes active
- Add configuration presets for some standard schedules on higher timeframes
- Highlight of business rules – Open, IB Extension and Rotation Rules

Enhancements
- Schedules - Increase number of custom schedules from 4 to 7
- Overall Volume - Change default VolumeIntervals from 7 to 1
- Demo Mode - Allow user to switch between default and demo settings
= Profile Lines:
- Display session and interval titles on the chart
- Add option to switch off vertical lines
- Add option to change line styles for Start, End and Extension line
- Add option to set different colours and styles for HIGH, VAH, POC, VAL, LOW
= Summary Display:
- Draw summary display as a panel rather than simple text
- Add TPO Timeframe row
- Change titles to session name and interval name
- Support clicking on title to change schedule focus
- Add dot icon to title to highlight when auto schedule mode is active
= Hotkey display:
- Add verbose display
- Move panel from main window to sub window
- Allow user to change value by clicking on the rows
- Support clicking then dragging panel to new location
- Highlight values that have changed from input parameter settings

Fixes
- Hotkeys - Update position when window height is changed
- Backtest - Use TimeLocal for backtest expire so it works when market is closed
- Reset - Force clear and redraw of all objects on Reset

Performance
- Only refresh each tick if next level has been touched or broken
- Only redraw Hotkey display if chart width has changed

New Hotkeys
- "9" - Demo mode
- "0" - Presets

Parameters
- See parameters documentation for details http://www.blahtech.co.uk/marketprofile
Version 1.1 2016.04.12
- Bug Fix : Schedules - Fix error with schedules that span midnight
- Enhancement : Charts - Improve tooltips
- Enhancement : Charts - Add Hotkey "T" - Temporarily double the Ticksize
- Enhancement : Charts - Add Hotkey "Y" - Switch to the alternate schedule/session
- Enhancement : Summary - Change BUY/SELL/NTRL to UP/DN/NTRL
- Enhancement : Developers - Add support for iCustom buffers 0=Empty 1=VAH 2=POC 3=VAL 4=dVAH 5=dPOC 6=dVAL
- Enhancement : Daylight Savings - UseDaylightSavings parameter - Change default to true
- Enhancement : High Res Displays - WindowsDesktopScaling - Add parameter to support desktop scaling for 4K and other high res screens
- Performance : Backtest Mode - Do not recalculate every tick when in backtest mode