TrueVolumeSurrogate MT5
- Indicadores
-
Stanislav Korotky
 Trading is just my hobby. I'm working in IT industry. So developement of experts, indicators, and script is not a problem at all to me. Wide range of technologies are used: MQL4, MQL5, system and applied programming, web-services, neural networks and more.
New: - Versión: 1.4
- Actualizado: 23 agosto 2020
- Activaciones: 10
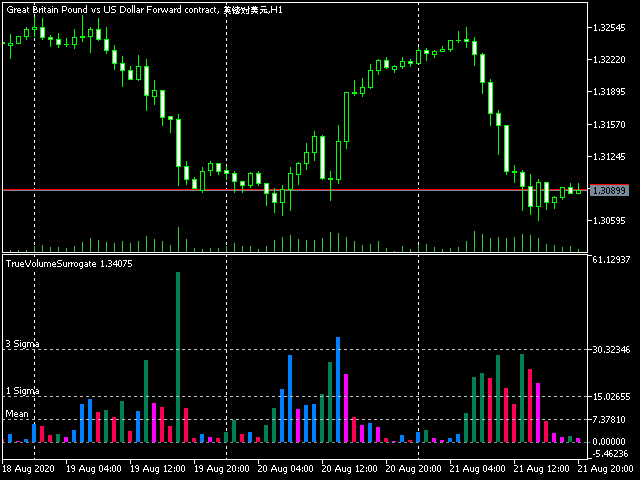
Este indicador proporciona un sustituto del volumen real basado en los volúmenes de ticks. Utiliza una fórmula específica para el cálculo de una estimación cercana a la real de la distribución de los volúmenes de operaciones, que puede ser muy útil para instrumentos en los que sólo se dispone de volúmenes de ticks. Tenga en cuenta que los valores absolutos del indicador no corresponden a ningún dato de volúmenes reales, pero la distribución en sí, incluida la forma y el comportamiento generales, es similar a la forma y el comportamiento de los volúmenes reales de instrumentos relacionados (por ejemplo, futuros sobre divisas).
El indicador muestra los volúmenes como un histograma en varios colores. Por defecto, el color verde significa que el volumen de la barra actual es mayor que el de la anterior, y el color rojo significa que el volumen de la barra actual es menor que el volumen de la barra anterior.
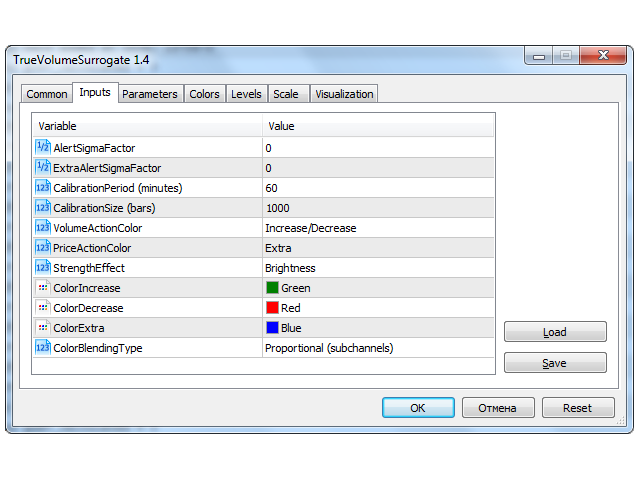
Parámetros
- AlertSigmaFactor, ExtraAlertSigmaFactor - habilitar/deshabilitar alertas para los eventos cuando los volúmenes exceden los niveles especificados;
- CalibrationPeriod - frecuencia con la que se recalcula la media y sigma de las barras de volumen; se especifica en minutos, 60 por defecto;
- CalibrationSize - número de barras para el cálculo de la media y la sigma; 1000 por defecto;
- VolumeActionColor - colores para resaltar los volúmenes aumentados y disminuidos; Aumentar/Disminuir, por defecto;
- PriceActionColor - colores para resaltar barras alcistas y bajistas (basado en el movimiento del precio en el gráfico principal);
- StrengthEffect - selector de uno de los efectos visuales disponibles para alterar el color según la "fuerza" de la barra (posición relativa del precio de cierre en el gráfico principal);
- ColorIncrease, ColorDecrease, ColorExtra - 3 colores principales;
- ColorBlendingType - selector de uno de los algoritmos de mezcla de colores;
Los parámetros AlertSigmaFactor y ExtraAlertSigmaFactor (0 por defecto, lo que significa que las alertas están desactivadas) permiten activar alertas cuando un volumen supera cualquiera de los dos niveles predefinidos (principal y adicional). Los valores deben especificarse como un factor de desviaciones estándar (por ejemplo, 1,0 o 3,0) contadas a partir del valor medio en el historial disponible. Si ambos niveles son distintos de cero, puede haber dos alertas en una barra, es decir, una alerta de cada tipo. Los niveles se muestran en el gráfico como líneas horizontales (rojas y discontinuas).
Existe la versión de TrueVolumeSurrogate para MetaTrader 4.

Stanislav is very co-operative with fast response. Long time I am using this indicator, luckily got it so cheap price. After new update this became more dynamic on volume, price & strength's increase / decrease. So I am giving it 5 Star rating.