EvoLevels
- Indicadores
-
Stanislav Korotky
 Trading is just my hobby. I'm working in IT industry. So developement of experts, indicators, and script is not a problem at all to me. Wide range of technologies are used: MQL4, MQL5, system and applied programming, web-services, neural networks and more.
New: - Versión: 1.4
- Actualizado: 21 noviembre 2021
- Activaciones: 5
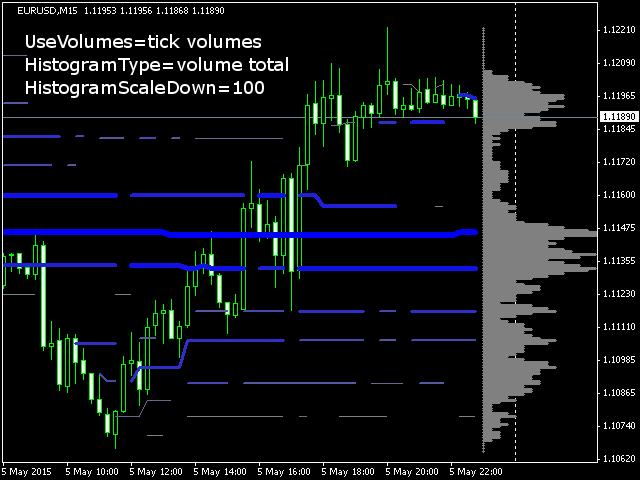
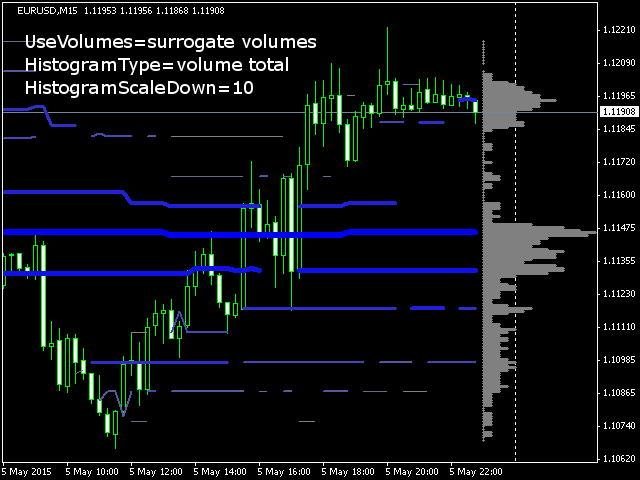
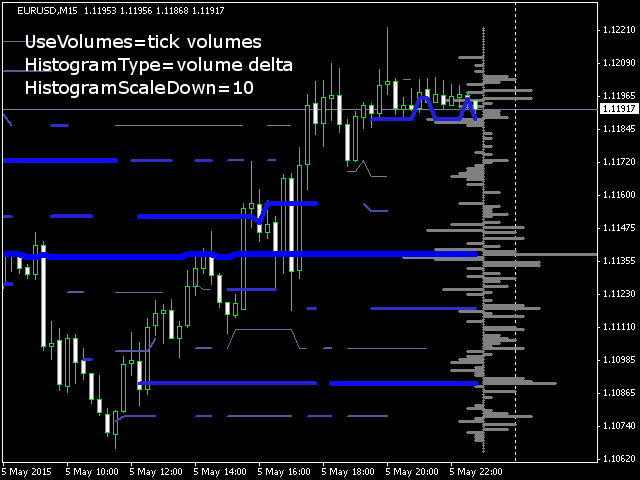
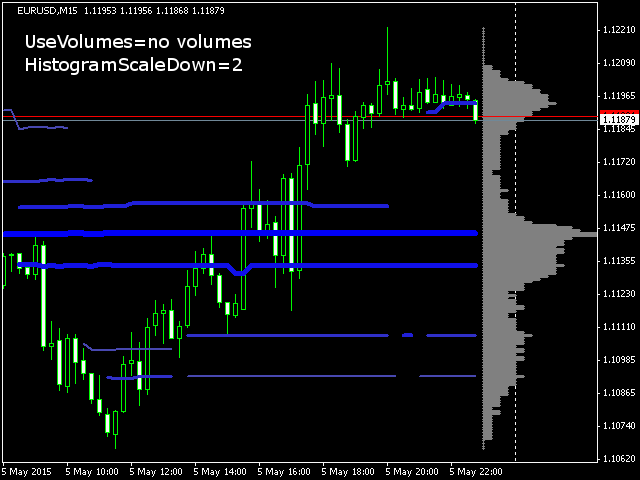
El indicador muestra los niveles de precios más destacados y sus cambios en el historial. Detecta dinámicamente las regiones en las que los movimientos de los precios forman atractores y muestra hasta 8 de ellos. Los atractores pueden servir como niveles de resistencia o soporte y como límites exteriores para las cotizaciones.
Parámetros:
- WindowSize - número de barras en la ventana deslizante que se utiliza para la detección de atractores; por defecto es 100;
- MaxBar - número de barras a procesar (para optimizar el rendimiento); por defecto es 1000; cuando el indicador es llamado desde un experto, usa 1;
- Shift - número de barra para comenzar a procesar desde; por defecto es 0;
- MaxLevels - número de niveles a detectar, hasta 8; por defecto es 5;
- DeltaPoints - ancho mínimo de cada atractor en puntos, es decir, los niveles cercanos no pueden estar más cerca que DeltaPoints/2 entre sí; por defecto es 200;
- StepPoints - granularidad de los valores de precio en los cálculos (para optimizar el rendimiento); por defecto es 10;
- CleanUp - si es true (por defecto), elimina los saltos entre niveles, cuando, por ejemplo, el nivel 1 se convierte en nivel 2 (es decir, pierde su poder); use true para una visualización limpia; use false cuando el indicador es llamado desde un experto;
- Color - color base para los niveles; por defecto es Azul.
Debe estimar qué WindowSize es más adecuado para el marco temporal seleccionado. También cambie DeltaPoints como sea apropiado para insttrumentos de trabajo específicos. Se recomienda tener StepPoints como décimas de DeltaPoints.