ADXSignal
- Indicadores
-
Stanislav Korotky
 Trading is just my hobby. I'm working in IT industry. So developement of experts, indicators, and script is not a problem at all to me. Wide range of technologies are used: MQL4, MQL5, system and applied programming, web-services, neural networks and more.
New: - Versión: 1.1
- Activaciones: 5
ADX clásico renovado para proporcionar señales de trading más rápidas y sólidas.
Este indicador calcula los valores ADX utilizando fórmulas estándar, pero excluye la operación de tomar el módulo de los valores ADX, que se añade forzosamente en ADX por alguna razón. En otras palabras, el indicador conserva los signos naturales de los valores ADX, lo que lo hace más consistente, fácil de usar y da señales antes que el ADX estándar. Estrictamente hablando, cualquier conversión a un valor absoluto destruye una parte de la información, y tiene sentido omitir la operación. Además, el indicador proporciona buffers adicionales para su comodidad.
El indicador muestra 4 líneas:
- ADX con signo - línea gruesa azul claro;
- +(-DI) índice direccional negativo - línea discontinua marrón claro (siempre positiva);
- -(+DI) índice direccional positivo invertido - línea punteada verde claro (siempre negativa);
- (+DI)-(-DI) diferencia entre 2 índices - línea gruesa gris.
Mientras que el ADX tradicional es siempre positivo, ADXSignal puede ser tanto positivo como negativo. Las señales de ADXSignal son similares a las de ADX, pero más claras:
- Cuando ADXSignal sube (no importa - por encima o por debajo de 0), la tendencia alcista está activa. Cuando ADXSignal va hacia abajo (no importa - por encima o por debajo de 0), la tendencia a la baja está activa.
- El momento en que debe abrir una posición en la dirección de la tendencia es cuando la diferencia de los índices direccionales tiene un signo correspondiente a la tendencia. Normalmente, las reglas de ADX implican que usted compra cuando +DI cruza -DI hacia arriba, y va en corto cuando +DI cruza -DI hacia abajo, pero ADXSignal proporciona un solo búfer conveniente para esto - el búfer 4-th: si es > 0, está bien comprar, cuando es < 0, está bien vender.
- También puede notar que +(-DI) y -(+DI) forman ahora un canal, que le da señales adicionales y puede ser tratado como una confirmación - por ejemplo, cuando la diferencia va fuera del canal, la señal se hace más fuerte que cuando la diferencia cruza 0, adecuado para la ampliación de la posición.
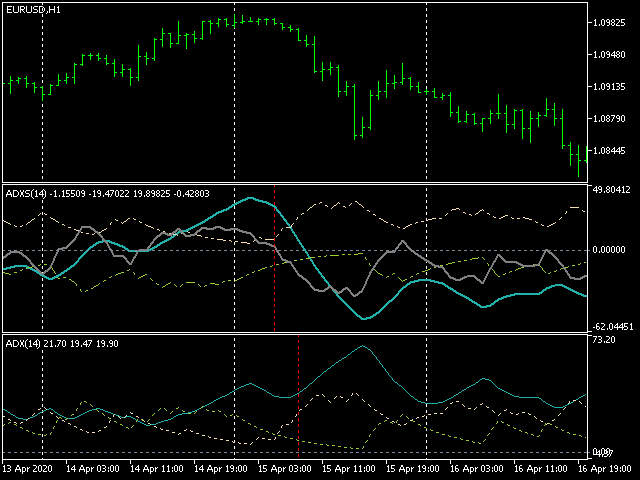
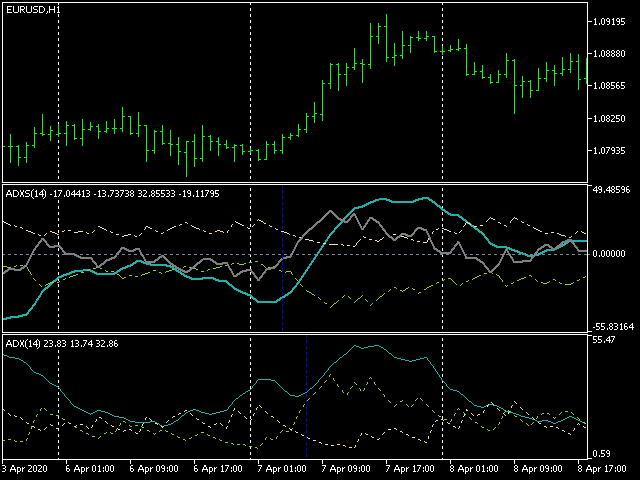
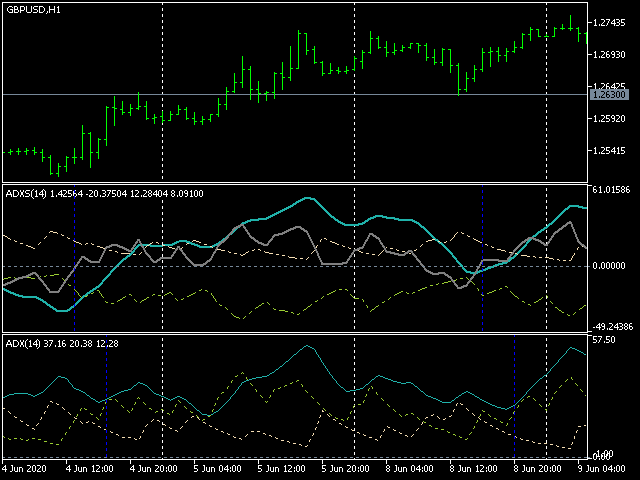
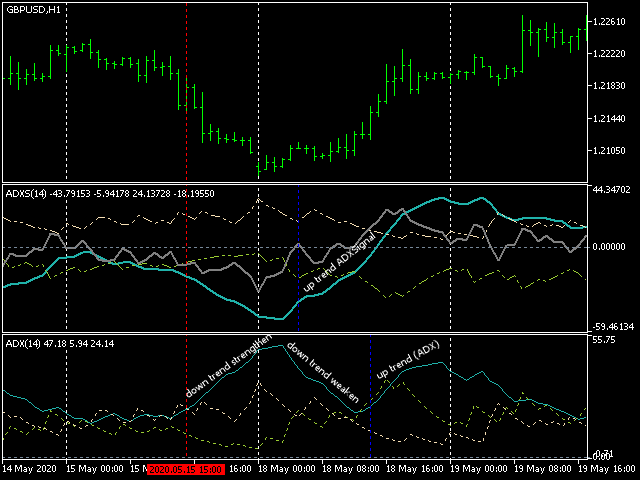
Las siguientes capturas de pantalla muestran cómo se comporta ADXSignal en comparación con el ADX convencional. Se puede observar que ADXSignal da señales antes que ADX. En las barras marcadas con líneas verticales ADXSignal produce señales para nuevas tendencias, pero ADX sigue cayendo y pierde los puntos óptimos de entrada.
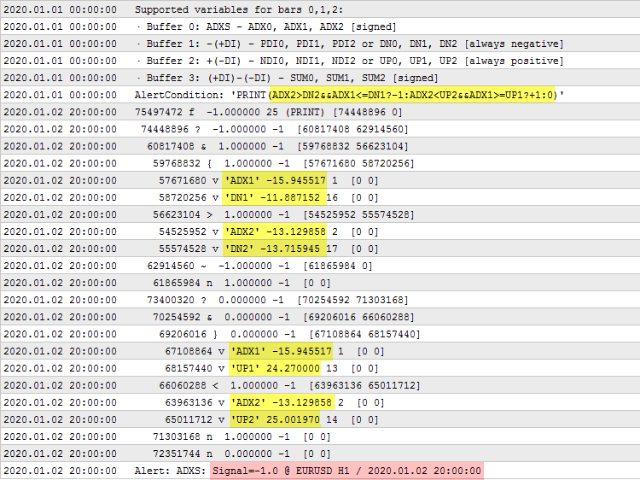
Los parámetros son el periodo ADX (por defecto - 14) y los ajustes de alerta (AlertType - alerta incorporada, e-mail, push-notification, AlertCondition - fórmula, AlertName - nombre de la señal). La fórmula puede utilizar las siguientes variables para 4 buffers en las últimas 3 barras:
- Buffer 0: ADXS - ADX0, ADX1, ADX2 [con signo].
- Buffer 1: -(+DI) - PDI0, PDI1, PDI2 o DN0, DN1, DN2 [siempre negativo].
- Buffer 2: +(-DI) - NDI0, NDI1, NDI2 o UP0, UP1, UP2 [siempre positivo].
- Buffer 3: (+DI)-(-DI) - SUM0, SUM1, SUM2 [con signo].
Ejemplo de la fórmula con 2 señales (compra: +1, +2, venta: -1, -2):
ADX2>DN2&&ADX1<=DN1?-1:ADX2<UP2&&ADX1>=UP1?+1:(SUM2*SUM1<0?(SUM1> 0?+2:-2):0)