VWAP Indicator by PipTick MT5
- Indicadores
-
Michal Jurnik
 "Talent is cheaper than table salt. What separates the talented individual from the successful one is a lot of hard work." - Stephen King. Those few words reflect myself very well. I am probably not the most talented developer in the world but I truly believe in hard work, professional attitude and
 - Versión: 1.5
- Actualizado: 1 diciembre 2021
- Activaciones: 5
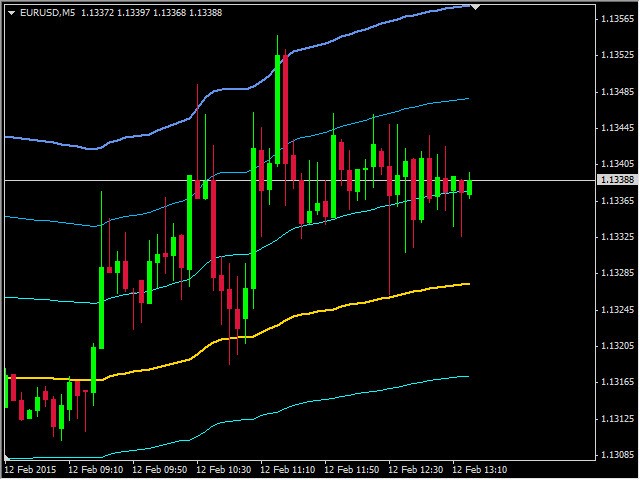
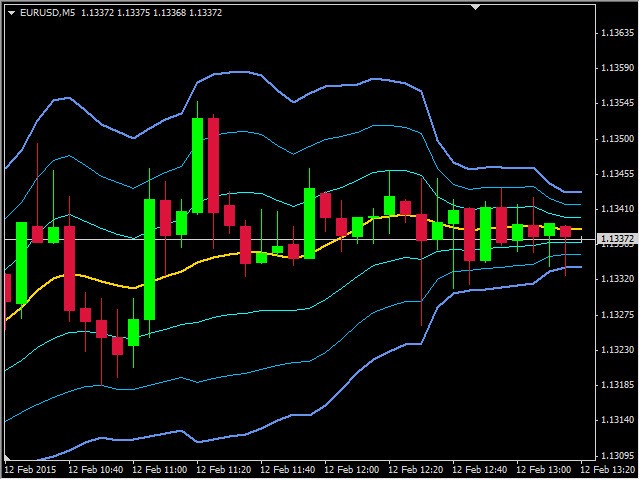
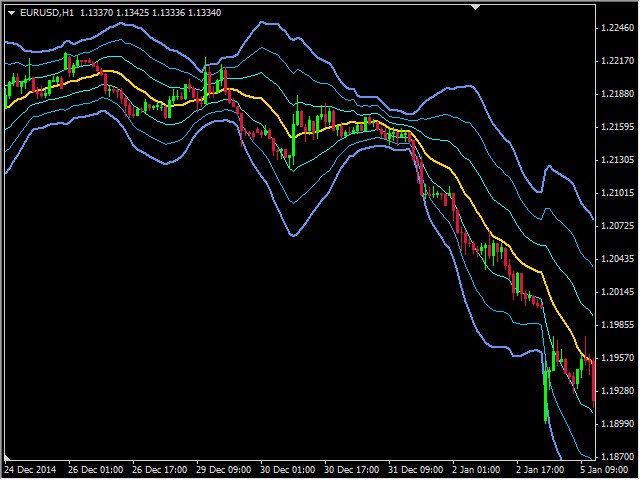
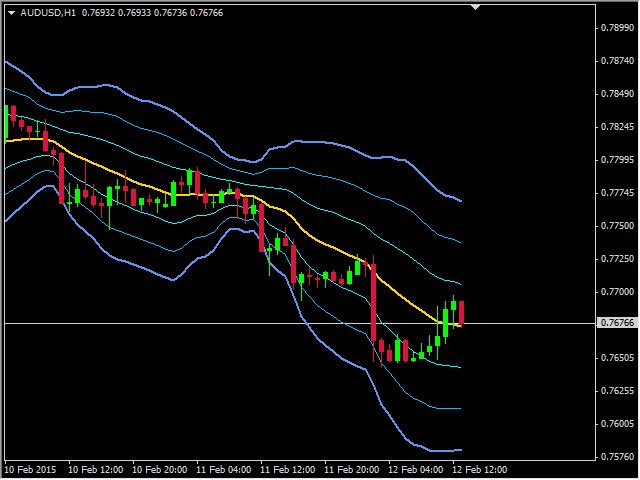
El indicador VWAP es nuestra versión del popular indicador Precio medio ponderado por volumen. El VWAP es la relación entre el valor negociado (precio multiplicado por el número de volumen negociado) y el volumen total negociado durante un periodo de tiempo específico. Como resultado, mide el precio medio del instrumento mucho mejor que la media móvil simple. Aunque hay muchas formas de utilizar el VWAP, la mayoría de los inversores lo utilizan para calcular la media diaria.
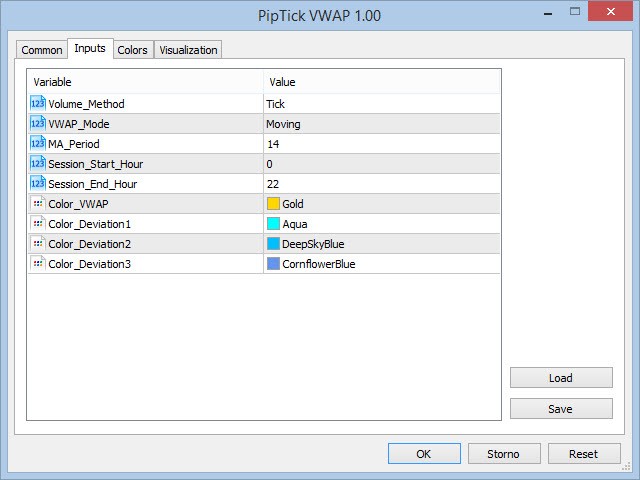
El indicador funciona en cinco modos:
- Móvil - En este modo, el VWAP funciona como Media Móvil con el periodo especificado.
- Diario - En este modo, el VWAP se calcula desde el principio hasta el final del día.
- Semanal - En este modo, el VWAP se calcula desde el principio hasta el final de la semana.
- Mensual - En este modo, el VWAP se calcula desde el principio hasta el final del mes.
- Hora de la sesión - En este modo, el usuario puede establecer las horas de inicio y fin del cálculo del VWAP.
Cómo utilizar el indicador VWAP
Muchos operadores utilizan las bandas VWAP del mismo modo que las bandas de Bollinger. Puede buscar operaciones inversas en la segunda y tercera desviaciones estándar del VWAP. Combinado con la acción del precio o patrones de velas, puede lograr excelentes resultados. Por supuesto, el indicador VWAP también puede utilizarse como referencia, como hacen muchos inversores.
Características principales
- Varios modos opcionales.
- Cálculo de volumen real y por ticks (MT5).
- Primera, segunda y tercera desviación estándar del VWAP.
- Indicador muy rápido y fiable.
- Parámetros personalizables (colores, grosor de línea, periodo VWAP...).
- Se puede utilizar para crear EA (Expert Advisor).
- Disponible para MT4 y MT5.