TrueVolumeSurrogate MT5
- Indikatoren
-
Stanislav Korotky
 Trading is just my hobby. I'm working in IT industry. So developement of experts, indicators, and script is not a problem at all to me. Wide range of technologies are used: MQL4, MQL5, system and applied programming, web-services, neural networks and more.
New: - Version: 1.4
- Aktualisiert: 23 August 2020
- Aktivierungen: 10
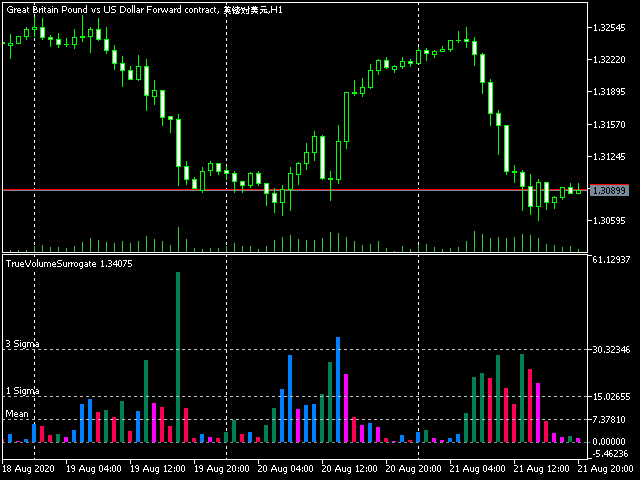
Dieser Indikator liefert ein echtes Volumen-Surrogat auf der Grundlage von Tick-Volumen. Er verwendet eine spezielle Formel zur Berechnung einer annähernd realen Schätzung der Verteilung des Handelsvolumens, was bei Instrumenten, für die nur Tick-Volumen verfügbar sind, sehr praktisch sein kann. Bitte beachten Sie, dass die absoluten Werte des Indikators nicht den realen Volumendaten entsprechen, aber die Verteilung selbst, einschließlich der Gesamtform und des Verhaltens, ähnelt der Form und dem Verhalten der realen Volumina verwandter Instrumente (z. B. Währungsfutures).
Der Indikator zeigt die Volumina als Histogramm in mehreren Farben an. In der Standardeinstellung bedeutet die grüne Farbe, dass das Volumen des aktuellen Balkens größer ist als das des vorherigen, und die rote Farbe bedeutet, dass das Volumen des aktuellen Balkens kleiner ist als das des vorherigen.
Parameter
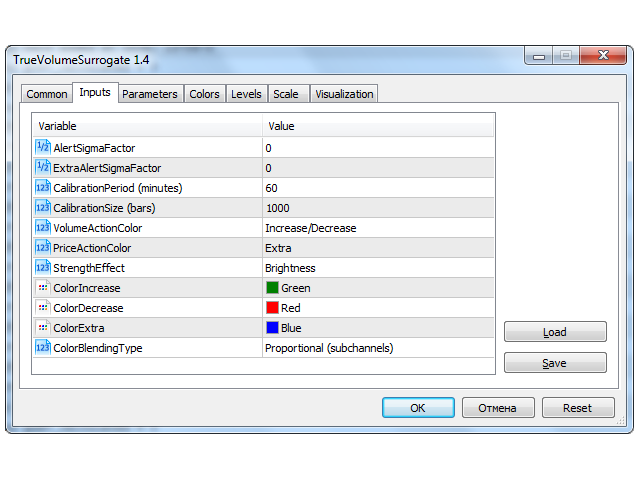
- AlertSigmaFactor, ExtraAlertSigmaFactor - aktiviert/deaktiviert Alarme für die Ereignisse, wenn das Volumen das angegebene Niveau überschreitet;
- CalibrationPeriod - Häufigkeit der Neuberechnung von Mittelwert und Sigma der Volumenbalken; Angabe in Minuten, standardmäßig 60;
- CalibrationSize - Anzahl der Balken für die Berechnung von Mittelwert und Sigma; standardmäßig 1000;
- VolumeActionColor - Farben zur Hervorhebung von gestiegenen und gesunkenen Volumina; standardmäßig Increase/Decrease;
- PriceActionColor - Farben zur Hervorhebung von Aufwärts- und Abwärtsbalken (basierend auf der Preisbewegung im Hauptdiagramm);
- StrengthEffect - Auswahl eines der verfügbaren visuellen Effekte zur Änderung der Farbe entsprechend der "Stärke" des Balkens (relative Position des Schlusskurses auf dem Hauptdiagramm);
- ColorIncrease, ColorDecrease, ColorExtra - 3 Hauptfarben;
- ColorBlendingType - Auswahl eines der Farbmischalgorithmen;
Mit den Parametern AlertSigmaFactor und ExtraAlertSigmaFactor (standardmäßig 0, was bedeutet, dass Warnungen deaktiviert sind) können Sie Warnungen aktivieren, wenn ein Volumen eines der beiden vordefinierten Niveaus (Haupt- und Zusatzvolumen) überschreitet. Die Werte sollten als Faktor der Standardabweichungen (z. B. 1,0 oder 3,0) vom Mittelwert der verfügbaren Historie angegeben werden. Wenn beide Werte ungleich Null sind, können auf einem Balken zwei Warnungen erscheinen, d.h. eine Warnung jeder Art. Die Pegel werden im Diagramm als horizontale Linien (rot und gestrichelt) angezeigt.
Die Version von TrueVolumeSurrogate für MetaTrader 4 existiert.

Stanislav is very co-operative with fast response. Long time I am using this indicator, luckily got it so cheap price. After new update this became more dynamic on volume, price & strength's increase / decrease. So I am giving it 5 Star rating.