Indicadores técnicos para MetaTrader 5 - 25

La media móvil T3 de Tillson se introdujo al mundo del análisis técnico en el artículo '' A Better Moving Average '', publicado en la revista estadounidense Technical Analysis of Stock Commodities. Desarrollada por Tim Tillson, los analistas y operadores de los mercados de futuros pronto quedaron fascinados con esta técnica que suaviza las series de precios al tiempo que disminuye el retraso (lag) típico de los sistemas de seguimiento de tendencias.
FREE
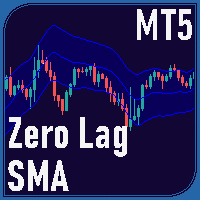
SMA Cero Retraso para MT5 El indicador Zero Lag SMA (ZLSMA) para MT5 proporciona una variación de la Media Móvil Simple (SMA) diseñada para minimizar el retraso, ofreciendo a los operadores una media móvil más sensible que se ajusta más rápidamente a los cambios de precios. Esto hace que sea útil para identificar posibles cambios de tendencia y niveles de precios clave de manera oportuna.
Si desea ver más productos de alta calidad o encargar el desarrollo/conversión de sus propios productos, vi
FREE

UT Bot Alerts es un indicador técnico para MetaTrader 5 que destaca los posibles cambios direccionales basados en las condiciones de impulso.
El indicador marca puntos de señal directamente en el gráfico y puede generar notificaciones opcionales para mayor comodidad. La lógica de generación de señales puede operar en dos modos: Modo de barra cerrada: las señales se confirman sólo después del cierre de la barra. Modo de barra viva: las señales se muestran durante la formación de la barra actual.
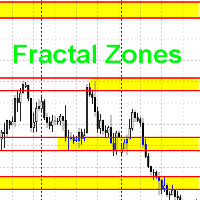
Este indicador dibuja zonas de negociación por fractales de periodos más antiguos, lo que simplifica la negociación por niveles.
Este indicador dibuja dos tipos de zonas de negociación en un gráfico. Por ejemplo, si el período actual es H1, las zonas de negociación se buscarán por fractales de H4 y de D1. En la configuración estándar, las zonas fractales de H4 se dibujarán en color amarillo, y las de D1, en verde. Cuando las zonas se superponen, los colores se mezclan donde las zonas se cruzan.
FREE
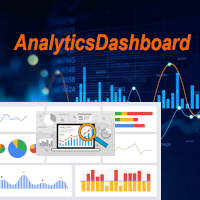
El Panel de Análisis es un indicador que analiza sus operaciones pasadas y presentes, y crea un panel analítico que puede visualizar con gráficos circulares adicionales como vista detallada.
Se consideran principalmente cuatro categorías de análisis: 1) Métricas de rendimiento; 2) Métricas de comportamiento de las operaciones; 3) Métricas de calidad de ejecución; y 4) Métricas de nivel de posición.
Las cuatro métricas analíticas genéricas se han dividido en métricas más específicas, como se m
FREE
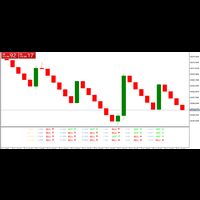
ZZA ASISTENTE DE COMERCIO Este indicador asistente de comercio ZAA es muy poderoso. Aquí usted puede utilizar esto como su asistente de comercio. Así, mientras que la aplicación de este uso de gestión de dinero. Este indicador se puede utilizar en 5 minutos timeframe, 15 minutos timeframe, 1 hora minutos timeframe y por encima de. Trate de practicar esto en su cuenta demo antes de usar en la cuenta real. Este indicador debe aplicarse en meta trader 5 .
FREE
If you love this indicator, please leave a positive rating and comment, it will be a source of motivation to help me create more products <3 Puntos clave El StochRSI es un oscilador que mide el nivel del RSI en relación con su rango alto-bajo durante un periodo de tiempo. Es más sensible que el RSI tradicional y puede resaltar condiciones de sobrecompra o sobreventa en el mercado. StochRSI se utiliza normalmente para generar señales de trading más frecuentes y oportunas en comparación con el RS
FREE

Smart Super Trend Indicator (Gratis) Turn volatility into opportunity — Catch trends early and trade smarter El indicador Supertrend es una de las herramientas más fiables del análisis técnico, diseñada para ayudar a los operadores a identificar rápidamente la tendencia predominante en el mercado y detectar con precisión los posibles puntos de entrada y salida. Basado en la acción del precio y la volatilidad, este indicador de seguimiento de tendencias se adapta dinámicamente a las condiciones d
FREE
El Zero Lag Least Squares Moving Average (ZLSMA) es un indicador avanzado de media móvil diseñado para proporcionar un análisis de tendencias rápido y fluido sin retrasos. Basado en la Least Squares Moving Average (LSMA) , incorpora un cálculo de cero retraso, lo que lo hace altamente receptivo a los cambios de precio. Este indicador ayuda a los traders a identificar la dirección de la tendencia con un mínimo retraso , ideal tanto para estrategias a corto como a largo plazo.
Característic
FREE

Asia Range STDV Indicator
Este indicador está diseñado no sólo para identificar el rango de negociación de la sesión asiática y los niveles de desviación estándar , sino también para ayudar a los operadores a crear una estrategia sistemática de entrada y salida basada en la tendencia diaria del marco temporal superior. El indicador admite escenarios tanto alcistas como bajistas , lo que permite a los operadores centrarse en los momentos clave en los que el máximo o el mínimo del rango de Asia
FREE

Dual Bollinger Session Channel Canales Bollinger de Sesión Fijos Profesionales para MetaTrader 5
Diseñado para análisis de price action, rupturas y estructura institucional del mercado utilizando datos reales de sesión. Oferta Limitada: Este indicador está disponible de forma gratuita hasta el 15/01/2026 o limitado a las primeras 100 descargas , lo que ocurra primero. Descripción del Producto El Dual Bollinger Session Channel es un indicador técnico de nivel profesional para MetaTrader 5 que co
FREE
TW Volume Signal Pro MT5 , aprovechando tecnologías avanzadas de inteligencia artificial y algoritmos inteligentes propietarios, te permite operar en el mercado del oro con mayor confianza y te ofrece una experiencia de trading única e inigualable. ¿Buscas señales de trading precisas y excepcionales en el mercado del oro?
Con TW Volume Signal Pro MT5, puedes convertirte en un trader profesional y lograr un gran éxito en el mercado del oro. ¡Pruébalo gratis!
Características principales de TW V
El indicador Absorption & Exhaustion Detector Professional es una sofisticada herramienta de análisis de volumen diseñada para identificar puntos de inflexión críticos en el mercado mediante el análisis de la relación entre el movimiento del precio y el delta de volumen acumulado (CVD). Este indicador ayuda a los operadores a detectar cuando los movimientos de precios carecen de confirmación de volumen, lo que indica posibles zonas de absorción o agotamiento. CARACTERÍSTICAS PRINCIPALES Cálculo
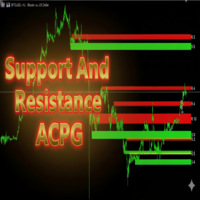
Indicador Support And Resistance ACPG
El indicador Support And Resistance ACPG (desarrollado por Grok by xAI) es una herramienta avanzada para la plataforma MetaTrader 5 (MQL5) diseñada para identificar y visualizar zonas de soporte y resistencia en un gráfico de precios. A diferencia de los indicadores tradicionales de soportes y resistencias, el método ACPG combina un enfoque dinámico basado en puntos de giro (swings), análisis de volatilidad mediante el indicador ATR (Average True Range)
FREE

AP VWAP Bandas Pro (MT5) Precio medio ponderado por volumen con bandas ±σ para un sesgo intradía claro, zonas de reversión media y soporte/resistencia dinámicos. Funciona con criptomonedas (incluido BTC) , divisas , índices y metales . Utiliza tick-volumen cuando el volumen real no está disponible. Lo que muestra Línea VWAP (precio medio ponderado por volumen). Dos envolventes alrededor del VWAP (por defecto ±1σ y ±2σ) para resaltar el equilibrio frente a la extensión. Modos de reajuste : Día ,
FREE

BUSCADOR INTELIGENTE DE TENDENCIAS ADAPTABLE RITZ Inteligencia de tendencias de precisión. Adaptable. Inteligente. En tiempo real. Ritz Smart Trend Adaptive Fin der es un indicador avanzado de inteligencia de mercado diseñado para detectar y adaptarse a la evolución de las estructuras de mercado con precisión dinámica.
Calibra automáticamente su periodo analítico basándose en la volatilidad en tiempo real, el impulso de los precios y la fuerza de la correlación, ofreciendo una verdadera detecció
FREE

1. Visión general Gracias por elegir Trend Maximizer. Esta herramienta está diseñada para el análisis técnico dentro de la plataforma MetaTrader 5. Es un sofisticado indicador de seguimiento de tendencias que ayuda a los operadores a identificar la tendencia predominante del mercado y también puede funcionar como un nivel dinámico de stop-loss. El núcleo del indicador se basa en una combinación de una Media Móvil (MA) seleccionada por el usuario y el indicador Average True Range (ATR). Analizand
FREE

EMA SMA Gold Scalper es un indicador de precisión desarrollado para operadores de XAUUSD (Oro) . Combina la respuesta dinámica de la EMA 55 (Alta/Baja ) con el filtro de dirección de mercado más amplio de la SMA 200 , proporcionando señales de Compra/Venta limpias y procesables. El indicador también incluye "Flechas azules en vivo" en tiempo real , que notifican a los operadores cuando se está formando una configuración de entrada, lo que le da una ventaja crítica antes de que se cierre la vela.
FREE

Indicador CCI altamente configurable. Características: Funciones de alerta altamente personalizables (en niveles, cruces, cambios de dirección vía email, push, sonido, popup) Capacidad multi timeframe Personalización del color (en niveles, cruces, cambios de dirección) Opciones de interpolación lineal y modo de histograma Funciona en el probador de estrategias en modo multi timeframe (también en fin de semana sin ticks) Niveles ajustables Parámetros:
CCI Timeframe: Puede establecer el marco tem
FREE

Indicador TurnPoint - Herramienta de señal de reversión de mercado y tendencia El indicador TurnPoint está diseñado para ayudar a los operadores a identificar posibles puntos de inflexión y niveles clave en el mercado. Mediante el análisis de la acción del precio, destaca las áreas en las que es probable que se produzcan retrocesos o continuaciones, lo que permite a los operadores anticiparse a los cambios de tendencia con mayor eficacia. Esta herramienta incorpora una lógica avanzada para filtr
FREE

Este indicador muestra el delta del volumen (ya sea del volumen de ticks o del volumen real) codificado en un símbolo personalizado, generado por asesores expertos especiales, como RenkoFromRealTicks . MetaTrader no permite valores negativos en los volúmenes, es por eso que tenemos que codificar deltas de una manera especial, y luego usar el indicador CustomVolumeDelta para decodificar y mostrar los deltas. Este indicador es aplicable sólo para instrumentos personalizados generados de forma apr
FREE

Velas Multi Time Frame
Las velas multi time frame, también conocidas como "MTF candles" en inglés, son un indicador técnico que permite visualizar velas japonesas de un marco temporal diferente al marco temporal principal en el que estás operando. Este enfoque ofrece una perspectiva más amplia del comportamiento del precio, lo que resulta especialmente útil para los traders que emplean estrategias de acción del precio. A continuación, se detallan los conceptos clave relacionados con este indic
FREE

AP Día-Semana-Mes Máximo-Mínimo superposición que dibuja los máximos y mínimos del día, semana y mes anteriores en cualquier gráfico. Ideal para planificar sesiones, confluencias y alertas cuando el precio vuelve a niveles de oscilación importantes. Qué hace Traza 6 líneas: Máximo/Bajo del día , Máximo/Bajo de la semana , Máximo/Bajo del mes (de las sesiones anteriores completadas). Alertas de toque/cerca cuando el precio alcanza una línea seleccionada (con una tolerancia fijada por el usuario).
FREE

El indicador Oferta Demanda RSJ PRO calcula y traza las zonas de "Oferta" y "Demanda" en el gráfico, identificando el tipo de Zona (Débil, Fuerte, Verificada, Probada) y en caso de reevaluaciones de la Zona muestra cuántas veces se volvió a probar. Las zonas de "oferta" son las zonas de precios donde se ha producido más oferta que demanda, lo que hace bajar los precios. Las zonas de "demanda" son las zonas de precios donde se ha producido más demanda que oferta, lo que hace subir los precios.

El indicador XE Forex Strengh MT5 muestra información visual sobre la dirección y la fuerza de una señal para el par actual y los marcos temporales elegidos (M5, M15, M30 y H1). Los cálculos se basan en múltiples factores y los resultados se muestran como un panel de color con barra de escala, valores numéricos y flechas. También se muestran los valores del precio actual y el spread del par. Se puede activar una alerta (en forma de correo electrónico o ventana emergente con sonido) para cada ma
FREE
ATT Support and Resistance es un indicador liviano para MetaTrader que encuentra máximos y mínimos locales en tiempo real utilizando el principio fractal y traza automáticamente niveles de soporte y resistencia significativos en función de ellos. Más productos: Aquí Elimina el "ruido" de las líneas muy espaciadas y actualiza las zonas con cada nuevo tick sin una carga innecesaria en la terminal. Indicador clásico con máxima facilidad de configuración y ajuste del número de zonas a visualizar. Y
FREE

Leer esto : Por favor, proporcione comentarios y opiniones para futuras mejoras. WaveTrendPro_Indi v1.05
Indicador WaveTrend con visualización mejorada del histograma: WaveTrendPro_Indi v1.05
Indicador WaveTrend con histograma mejorado: Histograma más pequeño ( se puede ajustar con el parámetro HistScale ). El histograma puede ser positivo o negativo , según el tipo de imagen. Tetap ringan & responsif di berbagai pair/timeframe. Cocok untuk scalper, swing trader, maupun analisis tren jangka p
FREE

Multitimeframe Viewer HiddenEdge - HTF Realtime MiniChart Una visión clara de la estructura de tiempo superior - directamente dentro de su gráfico principal.
Ya no es necesario cambiar de marco temporal. HiddenEdge Multitimeframe Viewer muestra las últimas velas de cualquier marco temporal superior en un panel compacto y en tiempo real, para que pueda ver el panorama general sin perder de vista la ejecución. Características principales Actualización en tiempo real: la vela actual del marco tem
FREE

Trading Dashboard Pro: El Centro de Comando Definitivo para MetaTrader 5 Transforme su terminal en una estación de trading profesional Trading Dashboard Pro es una utilidad integral de gestión de riesgos diseñada para traders profesionales, candidatos a empresas de fondeo (Prop Firms) y scalpers serios. Consolida datos críticos del mercado y métricas de salud de la cuenta en una interfaz elegante. ¿POR QUÉ NECESITA ESTE PANEL? 1. Para Traders de Empresas de Fondeo (FTMO, MFF, etc.)
Las
Canal Soporte Resistencia MT5 El indicador Support Resistance Channel MT5 traza niveles dinámicos de soporte y resistencia basados en un periodo de retroceso configurable, mostrándolos como líneas verdes y rojas respectivamente. Opcionalmente muestra flechas de color dorado cuando el precio toca estos niveles, indicando posibles cambios de tendencia (no señales explícitas de compra/venta) , junto con etiquetas personalizables "RES" y "SUP". Con parámetros ajustables como el periodo de retroceso
FREE

El indicador Advanced Trend Scalper MT5 está diseñado para ayudar tanto a los operadores principiantes como a los profesionales. El indicador analiza el mercado y le da señales de compra y venta. No utiliza ningún otro indicador, funciona sólo con las acciones del mercado. La señal aparece justo después del cierre de la vela y no se vuelve a pintar. El algoritmo eficiente proporciona un alto grado de fiabilidad de tales señales. Advanced Trend Scalper para el terminal MetaTrader 4 : https://www.

Detecte operaciones de alta probabilidad: rupturas de barras sandwich al alcance de su mano Este indicador detecta Barras Sándwich de varios rangos, un patrón de ruptura extremadamente fiable. Una configuración sándwich consiste en una única barra que engulle varias barras anteriores, rompiendo y rechazando todo el rango de precios. [ Guía de Instalación | Guía de Actualización | Solución de Problemas | FAQ | Todos los Productos ] Uso fácil y eficaz Rangos de barras personalizables Selecciones
FREE

La Media Móvil Hull es más sensible a la actividad actual de los precios que una Media Móvil tradicional. Responde más rápidamente a los cambios de tendencia y muestra con mayor precisión el movimiento de los precios. Esta es una versión en color del indicador. Este indicador ha sido desarrollado basado en la versión original creada por Sergey <wizardserg@mail.ru>. Adecuado para todos los marcos temporales.
Parámetros Período - período de suavizado, los valores recomendados son de 9 a 64. Cuant
FREE
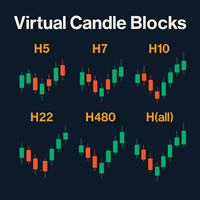
Virtual Candle Blocks – Visualiza el mercado sin límites Virtual Candle Blocks es un indicador avanzado para MetaTrader 5 que te permite crear y visualizar velas de cualquier temporalidad personalizada, incluso aquellas que no existen de forma nativa en la plataforma. Características Principales: Temporalidades Personalizadas: Agrupa las velas base en bloques de la duración que desees (ej. 5h, 14h, 28h, 72h, etc.) para crear una nueva vela virtual. Esto te permite acceder a temporalidades exclus
FREE

Entry Point M5 — sistema de trading completo. Entry Point M5 es un potente indicador diseñado como un sistema de trading totalmente funcional, adecuado para cualquier par de divisas. Analiza la estructura del movimiento del precio, identificando los momentos clave de reversión del mercado y la aparición de nuevos impulsos. El indicador puede adaptarse a diferentes fases del mercado — desde fuertes tendencias hasta rangos laterales — y proporciona señales visualmente claras sin necesidad de filtr
Si te gusta este producto, por favor, dale una calificación de 5 estrellas como muestra de agradecimiento.
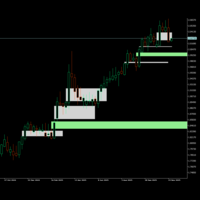
Este indicador identifica y muestra Fair Value Gaps (FVG) en los gráficos de precios.
Fair Value Gaps son zonas de precios donde hay un desequilibrio significativo entre la presión de compra y venta, creando "huecos" en la acción del precio. El indicador detecta dos tipos y cuándo se mitigan (tocan):
FVG alcista: Cuando el mínimo de una vela está por encima del máximo de una vela dos peri
FREE

El indicador Bar Time Countdown muestra el tiempo restante antes de que se cierre la vela (barra) actual y se abra una nueva. Proporciona una cuenta atrás clara y en tiempo real en minutos y segundos , lo que ayuda a los operadores a calcular con precisión sus entradas y salidas durante los mercados en rápido movimiento, especialmente para las estrategias de scalping o ruptura. Diseñado con una interfaz limpia y minimalista , se ajusta automáticamente a cualquier marco temporal y símbolo. La cue
FREE

Stoch Quad Rotation Signal MT5 - The Ultimate Kurisko Strategy Suite Stoch Quad Rotation Signal es un sistema de trading profesional de grado institucional basado en la famosa metodología de Mark Kurisko . Este indicador no es solo un oscilador; es un centro de mando completo que sincroniza cuatro niveles de análisis estocástico con filtros de tendencia avanzados para identificar reversiones y continuaciones de alta probabilidad. El sistema resuelve el mayor problema de los osciladores comunes:
Este asistente de noticias está diseñado para obtener los eventos económicos que necesitan los comerciantes de las principales fuentes editoriales, que publican noticias en tiempo real basándose en Market Watch del terminal con varios y sencillos filtros.
Los operadores de Forex utilizan indicadores macroeconómicos para tomar decisiones informadas sobre la compra y venta de divisas. Por ejemplo, si un comerciante cree que la economía estadounidense va a crecer más rápido que la economía japone
FREE
Advanced UT BOT ALERTS for MT5 Sistema profesional de detección de tendencias con múltiples filtros | Motor UT BOT mejorado Solo ofrecemos indicadores de alta calidad. Advanced UT BOT está diseñado para uso profesional, con una lógica de señales estable y un cálculo seguro que evita retrasos o actualizaciones erróneas.
No redibuja, elimina ni modifica las señales pasadas.
Todas las señales BUY y SELL se generan solo después del cierre de la vela , garantizando estabilidad y precisión.
En el trad

Este indicador se basa en las Bandas de Bollinger y las medias móviles, y utiliza el ADX para obtener el punto de inflexión de la tendencia del mercado y mostrar una señal.
Está pensado básicamente para su uso con pares de divisas y futuros con alta volatilidad. En nuestras pruebas lo utilizamos en XAUUSD, 5m y 15m. La tasa de ganancia es superior al 80% con 50 pips de stop loss y 50 pips de ganancia o más.
El indicador es también un indicador simple que le permite activar o desactivar las al
FREE
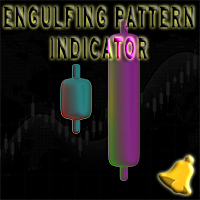
Engulfing Pattern es un indicador gratuito disponible para las plataformas MT4/MT5, su trabajo consiste en proporcionar "alertas" cuando se forma un patrón envolvente "alcista" o "bajista" en el marco temporal. Este indicador viene con opciones de alertas mencionadas en la sección de parámetros más abajo. Únase a nuestro grupo MQL5 , donde compartimos noticias y actualizaciones importantes. También puede unirse a nuestro canal privado, póngase en contacto conmigo para el enlace privado. Engulfin
FREE

El indicador dibuja líneas de soporte y resistencia diarias en el gráfico, así como el nivel de pivote (nivel de pivote).
Adaptado para trabajar en MT5.
Parámetros del indicador:
DayBack - el número de días para marcar líneas; PPcolor - línea de color Pivot; PPwidth - grosor de línea Pivot; PPstyle - estilo de línea Pivot; Supp - color de las líneas de apoyo; Sstyle - estilo de línea de apoyo; Swidth - espesor de las líneas de apoyo; Resistir - color de las líneas de resistencia; Rstyle - est
FREE

Proveedor de señales basado en las divergencias RSI
de un marco temporal superior.
Los 3 primeros búferes exportan una señal.
El marco temporal para el que se detectan las divergencias es opcional, consulte
'RSI divergences timeframe' parameter.
El indicador utiliza diferentes algoritmos para la detección de divergencias:
El algoritmo 'Fast' es la solución más sencilla y la que funciona con mayor rapidez.
El algoritmo 'Estricto' filtra más ruido pero funciona más lento que el anterior.
El al
FREE

TickVolume es una herramienta avanzada de análisis de volumen y flujo de órdenes para MetaTrader 5, diseñada para realizar un seguimiento en tiempo real del dominio de los ticks entre compradores y vendedores. Traduce el volumen bruto de ticks en una visualización intuitiva y procesable, destacando la fuerza, la debilidad, la velocidad y las zonas de absorción a través de múltiples capas de histogramas dinámicos. Características exclusivas y tecnología avanzada Seguimiento de dominancia multica

El ZIGZAG Araña es un algoritmo para determinar lo crítico que es el pico actual extendiendo varias líneas con diferentes parámetros en lugar de una línea entre cada 2 picos. 1. Cuantas más líneas de zigzag se encuentren en un pico , mayor será la probabilidad de que el mercado vaya a una corrección o cambie de dirección. 2. Por lo general, cuando 3-4 líneas de zigzag se encuentran en un pico, el mercado entra en un período de corrección, esto no sucede al instante, puede tomar algún tiempo. 3.
FREE

Descubre los secretos que los grandes jugadores no quieren que veas. ¿Alguna vez te has preguntado si las “ballenas” del mercado siempre entran a la misma hora y en la misma dirección? Este indicador te lo muestra. No da señales de entrada, pero revela patrones históricos de movimiento por hora o día que normalmente pasarían desapercibidos. Por ejemplo, podrías descubrir que los jueves a las 15:00 el EURUSD tiene un 80% de probabilidad de moverse al alza . Ideal para traders que quieren confirma
FREE

CandleAvg Pro: Indicador avanzado MT5 para un trading más inteligente Visualice medias móviles dinámicas directamente superpuestas en los candeleros con precisión. Características principales: Periodos de MA personalizables (SMA/EMA) para detectar tendencias. Señales codificadas por colores: Verde para cruces alcistas, rojo para cruces bajistas. Alertas en tiempo real de rupturas y retrocesos. Compatible con todos los plazos y pares. Aumente su ventaja - detecte entradas/salidas más rápido. ¡Sól
FREE
1. Introducción El Squeeze Momentum Plus es una potente herramienta de análisis técnico diseñada para ayudar a los operadores a identificar los periodos de baja volatilidad del mercado (la fase de "compresión") y evaluar la dirección y la fuerza del impulso de los precios . Este indicador combina los principios de las Bandas de Bollinger y los Canales de Keltner para detectar cambios en la volatilidad del mercado, junto con un oscilador de impulso para medir la presión de compra/venta. 2. Compon
FREE

EMA Multi Timeframe (MTF) - Indicador MT5 Descripción: El indicador EMA Multi Timeframe (MTF) para MT5 le permite mostrar una Media Móvil Exponencial (EMA) de un marco de tiempo superior (o inferior) directamente en su gráfico actual. Ejemplo: Puede ver la EMA 9 diaria (D1 ) trazada directamente en su gráfico H1 , o incluso en un gráfico M5 , ayudándole a alinear sus entradas con tendencias de plazos superiores sin cambiar entre gráficos. Características principales: Mostrar EMA de marcos de tie
FREE
Como se sugiere, con este indicador puede cambiar de un símbolo o marco temporal a otro en el mismo gráfico. Así que olvídate de abrir montones de gráficos en tu pantalla. No está diseñado para traders TIC o SMC, pero si usted es ese tipo de trader aún puede utilizarlo. Imagina que tienes una estrategia que contiene varios indicadores y configuraciones, en un solo gráfico puedes filtrar la oportunidad de entrada y luego pasar al siguiente símbolo o marco temporal.
FREE

Añade una marca de agua con el nombre del activo que se negocia. Se puede ajustar el tamaño de la fuente y el color del texto. Probado con varios activos B3 y Forex Añadir al gráfico y configurar según sea necesario. Si tiene algún problema, no dude en comunicárnoslo y lo solucionaremos lo antes posible. ______________________________
FREE
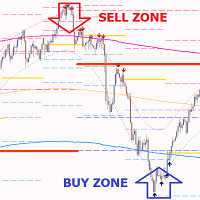
Gold PL MTF es un excelente indicador técnico bursátil. El algoritmo del indicador analiza el movimiento del precio del activo y refleja automáticamente los niveles pivote importantes del período de tiempo especificado (TF) utilizando el método de Fibonacci (sección áurea).
El indicador describe perfectamente la trayectoria del precio del período de tiempo seleccionado (día, semana, mes, año), determina el comienzo de una tendencia y el comienzo de una corrección, que puede convertirse en una

Esta es una versión multi timeframe del indicador de Oferta y Demanda . Le permite analizar un gráfico utilizando la ley de la oferta y la demanda en tres marcos temporales diferentes a la vez. Verá zonas de ventas y compras y determinará los puntos más rentables para abrir posiciones. El indicador se basa en el principio de la fractalidad del mercado. Las zonas de oferta y demanda muestran los lugares en los que un comprador o vendedor fuerte ha hecho que el precio se invierta y cambie de direc
FREE

Este indicador muestra Gann Swing Chart (Una Barra) con onda multicapa. 1. Capa de onda F1 : Las ondas Gann se dibujan en base a las velas. La onda SGann (Swing de Gann) se dibuja basada en la onda Gann de la capa de onda F1. 2. Capa de onda F2: Es una onda Gann dibujada basada en la onda SGann de la capa de onda F1. Las ondas SGann se dibujan en base a las ondas Gann de la capa de ondas F2. 3. 3. Capa de onda F3: Es una onda Gann dibujada basada en la onda SGann de la capa de onda F2. Las ondas
FREE

Raymond Cloudy Day Indicador para MT5 - Pivote basado en la reversión y los niveles de tendencia Raymond Cloudy Day Indicator es un indicador de nivel basado en pivotes para MetaTrader 5 (MT5). Fue desarrollado por Ngo The Hung basado en la idea original de Raymond y está diseñado para dar una visión estructurada de las posibles zonas de reversión, extensiones de tendencia y niveles de soporte / resistencia directamente en el gráfico. La configuración predeterminada está optimizada para XAUUSD e
FREE

Perfil de volumen de rango fijo automático con alertas para MT5
Este indicador muestra dónde ha pasado más tiempo el precio, destacando niveles importantes que se pueden utilizar en el comercio.
y puede mostrar la densidad de precios a lo largo del tiempo, destacando los niveles de precios más importantes, el área de valor y el valor de control de una sesión de negociación determinada. Este indicador se puede adjuntar a marcos de tiempo entre M1 y D1 y mostrará el perfil de mercado para sesio
The Channel Sgnals ProfRoboTrading Indicator for MT5 is an effective Forex trading tool designed to track market movements. The MT5 signal point indicator effectively detects trend reversals after they have already occurred. This Indicator is a fully automated technical tool that includes a number of parameters to track market trends. It automatically examines the ever-changing price dynamics of the market, compares the information with earlier data and generates a trading signal. Because
FREE
El indicador VWAP, la forma abreviada de Volume Weighted Average Price, es similar a una media móvil pero tiene en cuenta el volumen de ticks de las velas. El indicador calcula la media móvil multiplicando el precio de cada vela por el volumen de ticks en la vela. Dicho cálculo pondera con mayor significación el precio donde se realizaron más transacciones.
Características: Estilo visual personalizable Periodo personalizable Facilidad de uso
FREE

Economiza tiempo y toma decisiones más certeras con las VWAPs ancladas Si deseas probar el poder de esta herramienta, puedes descargar el indicador gratuito de VWAPs ancladas para MT5 . Además de trabajar de forma independiente, este indicador también es una extensión para la versión gratuita Sweet VWAP. Esto se debe a que, al hacer clic en la versión gratuita, la VWAP que ves en el puntero del ratón se fijará. Y para una mejor comprensión, lo que estará fijado allí es este indicador, con todas
Indicador Rinse and Repeat para configuraciones de 3 días/sesiones/semanas. Consulte nuestros otros productos para fxer.net:
https://www.mql5.com/en/market/product/114888
https://www.mql5.com/en/market/product/114890
Características diarias del indicador: Cierre/alto/bajo diario Apertura/alto/bajo/cierre semanal Apertura/alto/bajo/cierre mensual Breakouts diarios Rupturas diarias fallidas Sesiones Asia/Londres/Nueva York Días interiores Días fuera Días verdes Días rojos
Indicador de caracter
FREE

King Smart Liquidity MT5 es un indicador analítico avanzado diseñado específicamente para rastrear los flujos de dinero institucional y los grandes bancos en forex, oro, índices, Bitcoin y otros mercados. Este indicador se desarrolló basándose en la metodología de "Smart Money Concept", que se basa en comprender la acción del precio, las zonas de liquidez y cómo se comportan las principales instituciones financieras en el mercado. Este indicador no solo dibuja líneas o zonas, sino que proporcio
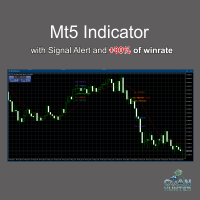
VERSIÓN GRATUITA PARA EL ORO (XAUUSD) Y BTCUSD No se olvide de calificar después de usar este indicador, Gracias.
Características: Etiquetas claras de Compra/Venta con flechas direccionales. Automático Take Profit (TP) y Stop Loss (SL) etiquetas para una mejor gestión del riesgo. Señales gráficas fáciles de leer (sin líneas confusas). Funciona en cualquier marco de tiempo y cualquier activo ( Forex, Oro, Índices, Cripto, Acciones). Compatible con MetaTrader 5 (MT5 desktop & mobile sync) . Per
FREE

Introducción al indicador de caja de tiempo Time Box Indicator es un indicador imprescindible para cualquier operador. Mostrará un cuadro diario, semanal y mensual de acuerdo a sus preferencias. Sin embargo, puede extender cualquier nivel de precios importantes en su gráfico de forma automática. Puede utilizarlos como niveles de soporte y resistencia significativos. Es una herramienta muy simple pero efectiva para sus operaciones.
Configuración gráfica Usar Gráfico Blanco Estilo de línea para e
FREE
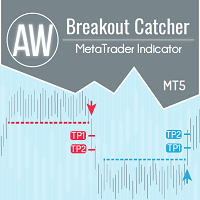
Desgloses de niveles de precios, estadísticas avanzadas, cálculo de TakeProfit y 3 tipos de notificaciones. Beneficios: No vuelvas a dibujar tus resultados Señal estrictamente al cierre de la vela. Algoritmo de filtrado de desglose falso Va bien con cualquier estrategia de tendencias. Funciona en todas las herramientas y series temporales. Manual e instrucciones -> AQUÍ / Resolución de problemas -> AQUÍ / Versión MT4 -> AQUÍ Cómo operar con el indicador Operar con AW Breakout Catcher

Neo Fork v5 se desarrolló para el sistema de trading "Oracle", pero poco a poco se fue complementando con, por ejemplo, ángulos de Gann y otras opciones..... Usted puede crear objetos gráficos con color, estilo y grosor especificados, tales como: rectángulos con y sin relleno, segmentos de líneas de tendencia y una herramienta no estándar - "Neo Fork" en forma de tridente, así como existe la oportunidad de ajustar interactivamente la paleta de colores directamente desde el gráfico, ajustar la vi
FREE

VERSIÓN PRO https://www.mql5.com/en/market/product/144989?source=Site https://www.mql5.com/en/users/gedeegi/seller GEN Soporte & Resistencia (EGGII77) es un indicador MT5 que automáticamente detecta y dibuja niveles de Soporte & Resistencia basados en pivotes de máximos y mínimos. El indicador cuenta con dos conjuntos de S&R (estructura principal y niveles rápidos), un número máximo personalizable de líneas, colores ajustables y una pantalla de gráfico limpia para un análisis más claro de la acc
FREE
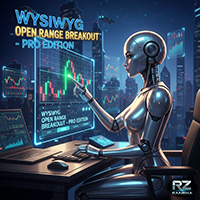
WYSIWYG OPEN RANGE BREAKOUT - EDICIÓN PRO
Indicador ORB ultrapreciso con ruptura de línea inteligente, objetivos dinámicos basados en ATR y adaptabilidad multisesión. Perfecto para traders diarios, swing y algorítmicos que buscan imágenes claras y niveles accionables . Opere con confianza - vea lo que opera, opere lo que ve . "Lo que ves es lo que obtienes". "What You See Is What You Get" – The ultimate ORB indicator delivering ultra-precise trading range visualization with a smart line-breakin
FREE

Bienvenido a Ultimate MA MTF , un indicador multifuncional de Media Móvil (MA) convertido de la versión original de TradingView por ChrisMoody y actualizado con muchas características de gran alcance. Esto no es sólo una típica línea MA. Es una completa herramienta de análisis técnico diseñada para proporcionar a los operadores una visión profunda de las tendencias, la volatilidad y las posibles señales de trading, todo dentro de un único indicador. Características principales 8 tipos de medias
FREE

Presentamos el indicador profesional de señales Arka STM
Con tiempo de cierre de velas Arka - Versión 100% gratuita. Rápido, Preciso e Inigualable en la Identificación de Oportunidades de Trading
Este indicador es el resultado de combinar un análisis avanzado de la acción del precio con algoritmos especializados del mercado, entregando señales claras, oportunas y rentables. Completamente Gratis - Sin Límites de Instalación o Uso
️ Un bot de trading automatizado, totalmente sincroniz
FREE
¿Sabe usted por qué MetaTrader Market es el mejor lugar para vender estrategias comerciales e indicadores técnicos? Con nosotros, el desarrollador no tiene que perder tiempo y fuerzas en publicidad, protección del programa y ajustes de cuentas con los compradores. Todo eso ya está hecho.
Está perdiendo oportunidades comerciales:
- Aplicaciones de trading gratuitas
- 8 000+ señales para copiar
- Noticias económicas para analizar los mercados financieros
Registro
Entrada
Si no tiene cuenta de usuario, regístrese
Para iniciar sesión y usar el sitio web MQL5.com es necesario permitir el uso de Сookies.
Por favor, active este ajuste en su navegador, de lo contrario, no podrá iniciar sesión.