Indicadores técnicos para MetaTrader 5 - 30

El Indicador Kijun-Sen Envelope es una herramienta de seguimiento de tendencias basada en la línea Kijun-Sen del sistema Ichimoku Kinko Hyo. Este indicador crea bandas dinámicas alrededor de Kijun-Sen, formando un canal que ayuda a los traders a identificar tendencias del mercado, posibles reversiones y condiciones de sobrecompra o sobreventa.
Características principales: • Confirmación de tendencias – ayuda a determinar si el mercado está en tendencia o en fase de consolidación. •
FREE

Buscador de Sesiones - Siga las Sesiones del Mercado Forex con Precisión
Adelántese al mercado con Session Finder , un elegante diseño estilo HUB para MetaTrader 5. Proporciona visibilidad en tiempo real de las principales sesiones bursátiles del mundo -Sídney, Tokio, Londres y Nueva York- para que siempre sepa qué mercados están abiertos, cerrados o a punto de cambiar. Características principales: Estado de la sesión en tiempo real: Vea de un vistazo si una sesión está abierta o cerrada. Cuent

Libera el Potencial de tus Operaciones con el Indicador AlphaWave! Tranquilidad en tus Operaciones: El Indicador AlphaWave ha sido diseñado para traer calma a tus operaciones, suavizando el gráfico y proporcionando una lectura precisa de la dirección de la tendencia. Nunca ha sido tan fácil tomar decisiones de operación claras. Tecnología Revolucionaria de Suavizado con 10 Modos: Experimenta una presentación de gráfico suave y clara con el Indicador AlphaWave. La tecnología revolucionaria de su

Una herramienta útil y cómoda para los operadores a la hora de analizar y tomar decisiones.
Peculiaridad
La característica principal de este indicador es su rápido algoritmo . La ganancia en la velocidad de cálculo del polinomio y su valor de la desviación estándar en comparación con los algoritmos clásicos alcanza varios miles de veces. Además, este indicador incluye un Probador de Estrategias con una clara visualización de las transacciones, un gráfico de equidad y el cálculo simultáneo y la
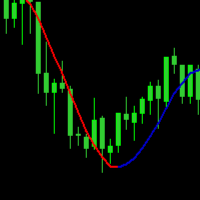
Una media móvil es simplemente una forma de suavizar las fluctuaciones de los precios para ayudarle a distinguir entre el "ruido" típico del mercado y la dirección real de la tendencia . Por "media móvil" se entiende la media del precio de cierre de un par de divisas durante el último número "X" de periodos. Como todo indicador técnico, un indicador de media móvil (MA) se utiliza para ayudarnos a prever los precios futuros.
FREE

El Jackson Auto Candlestick Pattern . Es una poderosa herramienta de acción de precios que auto detectar y alertar a un poderoso oculta patrones de velas . Viene con diferentes skins. Usted puede utilizar este indicador por sí solo para obtener beneficios, pero es de gran alcance cuando se combina con líneas de tendencia, puede descargar el Jackson Auto Trendlines gratis Enlace : UCRW695l9Wgg2ucnnf5DL5Vw Lista de patrones de velas que detecta 1. Alcista y Bajista Engulfing's 2. Pinza Superior e
FREE
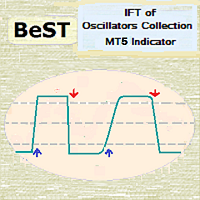
BeST_IFT de la Colección de Osciladores es un Indicador Compuesto MT4/5 que se basa en la IFT (Transformación Inversa de Fisher ) aplicada a los Osciladores RSI , CCI , Estocástico y DeMarker para encontrar los mejores puntos de Entrada y Salida mientras usamos estos Osciladores en nuestro trading. El IFT fue utilizado por primera vez por John Ehlers para ayudar a definir claramente los puntos de activación mientras se utiliza para este cualquier Oscilador común (TASC - Mayo 2004 ). Todas las S

Andrew Pitch tenedor es uno de los más interesantes tendencia cadena & Canal & Fibo análisis técnico, es como TODO en UNA herramienta sería muy suficiente para usted.
Usando 2 Andrew tono Horquillas con 2 diferentes marcos de tiempo en el mismo gráfico es realmente muy duro trabajo y podría ser imposible, pero con este indicador es posible ahora, por otra parte, utilizando este método como Vela Volumen análisis basado en dar una fuerte confianza para su comercio.
Asumo que si usted tiene 1 hor
FREE

Nombre del producto: SavasaLaS Tutelaje | Pro Price Action Compass Deje de adivinar. Empiece a operar con Confluence. SavasaLaS Tutelage no es sólo un indicador; es un sistema de trading completo diseñado para el trader serio de Price Action. Elimina el ruido de los gráficos aplicando estrictamente los tres pilares del trading institucional: Estructura del Mercado , Dirección de la Tendencia y Verificación de Velas . A diferencia de los indicadores estándar que inundan su gráfico con señales déb
FREE
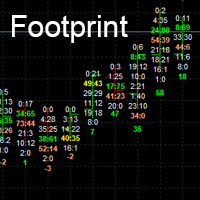
Los gráficos Footprint pueden añadir un nivel de profundidad a tus visuales que los gráficos estándar no pueden alcanzar.
Los gráficos Footprint son una poderosa forma de visualizar las subidas y bajadas del mercado, ayudándote potencialmente a tomar mejores decisiones de trading. Orderflow Footprint en MT5. muestra # de ordenes de mercado en cada tick.
Entradas
Escala de Puntos *1 a *10000
Número de velas a mostrar. Tamaño de Fuente Max Bid Color (Top Seller) Max Ask Color (Top Buyer) Max Bid
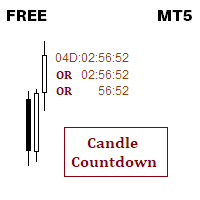
Este indicador es sobre el temporizador de cuenta atrás vela
Puede cambiar el color del temporizador Se pueden establecer 3 colores para diferentes rangos de tiempo Puede establecer el tamaño de la fuente, puede establecer el nombre de la fuente Si necesita algo extra, me ping, voy a añadir que la funcionalidad.
Gracias :) Siempre abierto a la retroalimentación y la crítica si me ayuda a proporcionar más valor. - Rahul
Mis otros indicadores que te pueden gustar
[ He estado operando en forex d
FREE

Filo oculto - PreUS alto-bajo High-Low PreUS es un indicador limpio y ligero que marca niveles de referencia clave antes de que comience la sesión estadounidense.
Dibuja un recuadro de sesión desde las 00:01 hasta las 09:00 CET, identificando el máximo y el mínimo de la sesión asiática, e incluye elementos de referencia adicionales para apoyar las decisiones estructuradas de negociación intradía. Características Dibuja un intervalo rectangular de 00:01 a 09:00 CET Marca claramente el máximo y el
FREE
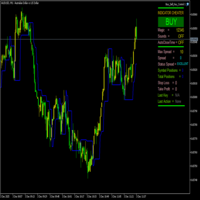
FractalBreakoutLevels Descripción general:
Este indicador traza niveles dinámicos de precios basados en el análisis de los movimientos de precios. Combina datos históricos de precios para identificar niveles clave que pueden servir como referencia para operar. Cómo funciona:
El indicador analiza la estructura del mercado examinando la relación entre los datos de precios actuales e históricos. Dibuja una línea continua que se adapta a las cambiantes condiciones del mercado, sirviendo como un ni
FREE
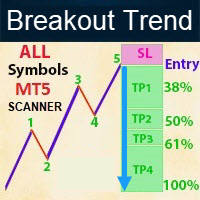
¡Póngase en contacto conmigo para la instrucción, cualquier pregunta! - Actualización gratuita de por vida - No repintar - Yo sólo vendo mis productos en Elif Kaya Perfil, cualquier otro sitio web son robados versiones antiguas, Así que no hay nuevas actualizaciones o apoyo. Introducción Breakout Trend Scanner indicador funciona sobre la base de la onda de Elliott en el análisis técnico describe los movimientos de precios en el mercado financiero que están relacionados con los cambios en el sen

El histograma ADX es una actualización moderna y visual del clásico Índice Direccional Medio (ADX) .
Transforma el ADX estándar y los valores DI+ / DI- en un histograma codificado por colores , haciendo que el análisis de tendencias sea mucho más claro y rápido. Características principales: Histograma con cuatro estados : Azul = Tendencia de compra normal Verde = Tendencia de compra fuerte Naranja = Tendencia de venta normal Rojo = Tendencia de venta fuerte Detección automática de la fuerza: uti
FREE
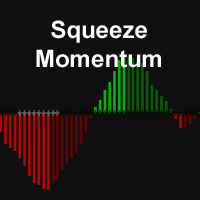
El indicador Squeeze Momentum, identifica periodos de baja volatilidad ("squeeze") cuando las Bandas de Bollinger están dentro del Canal de Keltner, marcado por cruces negras en la línea media. Esto sugiere que el mercado se está preparando para un movimiento significativo.
Las cruces grises indican una "liberación del squeeze", señalando una posible ruptura. Para utilizarlo, espere al primer cruce gris después de un cruce negro y, a continuación, realice una operación en la dirección del impu
FREE

## Visión General del Indicador HiddenGapVolume
**HiddenGapVolume** es un sofisticado indicador técnico de MetaTrader 5 diseñado para detectar brechas ocultas en el mercado y anomalías de volumen a través de análisis estadísticos. Combina medias móviles de volumen con una visualización dinámica codificada por colores para identificar posibles oportunidades de negociación.
### Características principales
- Análisis estadístico del volumen**: Calcula medias móviles y bandas de desviación están
FREE

MonsterDash Indicador de Armónicos es un tablero de patrones armónicos. Reconoce todos los patrones principales. MonsterDash es un tablero que muestra todos los patrones detectados para todos los símbolos y (casi) todos los plazos en formato ordenable y desplazable . Los usuarios pueden añadir sus propios patrones definidos por el usuario . MonsterDash puede abrir y actualizar gráficos con el patrón encontrado.
Configuración Los ajustes por defecto de MonsterDash son lo suficientemente buenos l
Indicador Rinse and Repeat para configuraciones de 3 días/sesiones/semanas. Consulte nuestros otros productos para fxer.net:
https://www.mql5.com/en/market/product/114888
https://www.mql5.com/en/market/product/114890
Características diarias del indicador: Cierre/alto/bajo diario Apertura/alto/bajo/cierre semanal Apertura/alto/bajo/cierre mensual Breakouts diarios Rupturas diarias fallidas Sesiones Asia/Londres/Nueva York Días interiores Días fuera Días verdes Días rojos
Indicador de caracter
FREE

Si te gusta este proyecto, deja un comentario de 5 estrellas. Muchas veces estamos utilizando corredores que están fuera de la zona horaria GMT-0, este
no sólo complica las cosas, pero, puede hacer ver cuando una sesión de negociación comienza
un poco más difícil de lo que debería. Este indicador le permite establecer un desplazamiento de zona horaria que dibujará una línea vertical para el: Día. Semana. Mes. Trimestre. Año.
FREE

Este indicador dibuja los precios más altos y más bajos de los períodos anteriores en el gráfico. Y si lo desea, el indicador puede alertarle cuando el precio actual llegue a estos niveles. Por ejemplo: Si está observando el marco de tiempo H1, el indicador le muestra los precios más bajos y más altos de los períodos H4, D1, W1 y M1. Así que no necesita abrir las ventanas de los otros periodos del gráfico. Opciones de Alerta: Enviar Mensaje Móvil, Enviar E-mail, Mostrar Mensaje, Alerta Sonora P
FREE
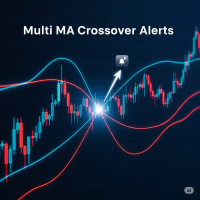
Multi MA Crossover Alerts - La herramienta definitiva para operar con tendencias Descripción completa: ¿Cansado de mirar los gráficos durante horas, temeroso de perderse una señal de cruce crítica? ¿Le resulta difícil analizar la tendencia utilizando varias medias móviles al mismo tiempo? El indicador Multi MA Crossover Alerts es la solución todo en uno que transformará sus operaciones de tendencia. Esta potente herramienta está diseñada para ofrecerle una visión completa del mercado y alertarle
FREE

El indicador Zonas de SyntheticaFX simplifica el proceso de identificación de los niveles clave del mercado en los que es probable que se produzcan retrocesos de los precios. Al incorporar esta herramienta a sus estrategias de negociación, los operadores pueden mejorar su toma de decisiones, mejorar la gestión del riesgo y, en última instancia, aumentar sus posibilidades de éxito en los mercados financieros. Sin embargo, como todos los indicadores técnicos, debe utilizarse junto con otros método
FREE

El indicador está diseñado para construir fácilmente gráficos sintéticos basados en datos de diversos instrumentos financieros. Será útil tanto para operaciones de arbitraje y de pares, como para fines de análisis. Su principal ventaja es la sencillez y claridad. Cada gráfico se presenta como una fórmula matemática común. Por ejemplo, si desea trazar el spread (diferencia) entre EURUSD y GBPUSD con coeficientes 4 y 3, entonces establezca la siguiente fórmula: EURUSD * 4 - GBPUSD * 3 El gráfico r

Descripción One Click Chart Changer es un indicador de MetaTrader 5 ligero y fácil de usar que permite a los operadores cambiar entre múltiples símbolos de negociación al instante con un solo clic. Diseñado para la velocidad y la comodidad, esta herramienta elimina la necesidad de buscar manualmente a través de la ventana de Observación del Mercado. Con su moderna interfaz de panel flotante, puede gestionar el cambio de símbolo directamente desde su gráfico. Características principales Cambio
FREE

Mouse Calculation calcula rápidamente el P/L de cada orden si se cierra al precio que señala el ratón. Ideal para tomar decisiones rápidas con múltiples órdenes: grid, martingala y entradas escalonadas. Precio de break-even y niveles objetivo, a simple vista. Funciones principales Mouse PnL (M) : Vista previa del P/L por orden y del total (incluye swap). Break even Price (B) : Muestra el precio/línea de break-even del conjunto. Time_Sync_Lines (T) : Alinea la misma hora del día en los últimos N
FREE

Una herramienta profesional para el trading - el indicador de divergencia entre el AO y el precio, que le permite recibir una señal sobre un cambio de tendencia de manera oportuna o captar movimientos de retroceso del precio (dependiendo de la configuración). La configuración del indicador le permite ajustar la fuerza de la divergencia debido al ángulo de los picos de la AO y el porcentaje de cambio en el precio, lo que hace posible afinar la fuerza de la señal. El código del indicador está opt
FREE

Un indicador de aumento de precios calcula las variaciones de rango y precio en porcentaje. Resulta muy útil cuando se observa el gráfico.
Le ayuda a tomar decisiones para abrir operaciones cuando el precio está en el nivel más bajo no abra operaciones de venta y abra operaciones de compra y cuando está en el nivel más alto no abra operaciones de compra abra operaciones de venta, no es una señal de entrada para las operaciones, sino para conocer el precio más bajo y más alto que se alcanzará
FREE

El indicador permite simplificar la interpretación de las señales producidas por el indicador ADX clásico.
La posición de las barras altas del histograma con respecto a cero y el color del histograma indican la dirección del movimiento del precio determinado por la intersección de DI+ / DI-.
La posición de las barras altas del histograma con respecto a cero y el color indican la fuerza del movimiento del precio.
El indicador es una continuación lógica de la serie de indicadores que utilizan e
FREE

Esta estrategia de supertendencia le permitirá entrar en largo o en corto a partir de un cambio de tendencia de supertendencia. Tanto el periodo ATR como el multiplicador ATR son ajustables. Si marca la opción "Cambiar el método de cálculo de ATR", el cálculo se basará en el SMA y le dará resultados ligeramente diferentes, que pueden funcionar mejor dependiendo del activo. Asegúrese de introducir el deslizamiento y la comisión en las propiedades para obtener resultados realistas. Si quiere opera
FREE

Facilita ver dónde ha habido zonas de consolidación para precios anteriores y permite resaltar el histograma donde hay la mayor zona de consolidación.
Input parameters Intervalo de precio Es el precio entre los histogramas
Periodo Número de velas a analizar
Porcentagem Destaca el histograma donde hay una consolidación mínima en relación con el período analizado
FREE

Historia Hace años llegué a este sitio buscando un indicador para opciones binarias. Como muchos principiantes, era tan seguro como ingenuo: pensaba que encontraría el “santo grial” que me haría ganar dinero cada día siguiendo flechas en la pantalla. Probé cientos de indicadores, de pago y gratuitos. Ninguno dio resultados consistentes. Con el tiempo volví, ya no como novato, sino como alguien que recorrió todo el camino—subidas y caídas, euforia y frustración—hasta construir un enfoque estable

El tradicional indicador Money Flow Index, esta vez, EA friendly . Hay 3 buffers expuestos que pueden ser utilizados por EAs para analizar automáticamente las condiciones de Sobrecompra y Sobreventa de la cotización. Sólo tiene que utilizar la función tradicional iCustom() para obtener estas señales. Este cálculo del Money Flow Index está basado en el indicador tradicional MFI de Metaquote.
AJUSTES
Periodo MFI Tipo de volumen a analizar (Volumen Real o Ticks) Región inicial de sobrecompra Regió
FREE
Radar de Régimen - Regímenes de Mercado + Bias Stops (MT5) El Radar de Régimen muestra el régimen actual del mercado - Rango, Tendencia Débil, Tendencia Fuerte o Shock - y dibuja líneas de stop basadas en ATR en el gráfico. También proporciona un panel compacto con sugerencias de régimen, dirección, confianza y RSI/Bollinger opcionales. Se trata de una herramienta de análisis; no proporciona señales de negociación y no garantiza ningún beneficio. Funciones principales Detección de régimen en cu
FREE

Indicador Williams %R altamente configurable. Características: Funciones de alerta altamente personalizables (en niveles, cruces, cambios de dirección vía email, push, sonido, popup). Capacidad multi timeframe Personalización del color (en niveles, cruces, cambios de dirección) Opciones de interpolación lineal y modo de histograma Funciona en el probador de estrategias en modo multi timeframe (también en fin de semana sin ticks) Niveles ajustables Parámetros:
Williams %R Timeframe: Puede establ
FREE
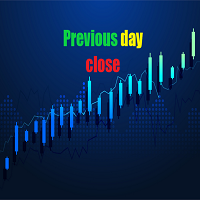
El indicador es una línea justo en el precio de cierre de ayer. Con el indicador, no es necesario añadir o eliminar líneas de cierre del día anterior cada nuevo día. La línea le proporciona un punto de referencia visual instantáneo para el soporte, la resistencia y el sentimiento del mercado . Tanto si opera durante el día como si hace swing trading, esta línea le ayuda a calibrar rápidamente dónde cerró el mercado la última sesión y cómo se relaciona la acción del precio actual con ese nivel. F
FREE
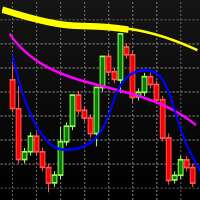
Basado en el indicador MIMA SAR, que es una combinación de los indicadores MIMA Consolidación y MIMA Tendencia de la metodología Phicube. El indicador se compone de 8 fractales, 17,34,72,144,305,610,1292,2554. La tendencia está indicada por las líneas finas y la consolidación por las líneas más gruesas. Para utilizar correctamente el indicador, hay que partir del principio de que en la naturaleza todo sigue el camino de menor resistencia. Esto significa que para que se produzca un cambio de tend
FREE

En este indicador se elige un dato a utilizar de ayer (máximo, mínimo, apertura, cierre, etc) para dibujar automáticamente una línea que será el cero. Y, a partir de ahí se calcula un porcentaje de desviación ("Porcentaje a utilizar") y se utiliza para dibujar otras líneas a ambos lados hasta que se alcance un límite.
Ambos lados pueden tener colores diferentes como se muestra en las capturas de pantalla. Además, se puede utilizar más de un indicador al mismo tiempo.
FREE
**Experimente un trading más inteligente con FVG Super Signal**.
Desbloquee una operativa más sencilla y decisiva con **FVG Super Signal**, un indicador MT5 avanzado de la serie WinWiFi Robot. Esta potente herramienta combina de forma única la técnica Fair Value Gap (FVG) con una sólida lógica de seguimiento de tendencias.
* **Señales claras:** Ofrece alertas intuitivas de Compra/Venta, simplificando sus decisiones de trading. * Compatibilidad universal:** Funciona sin problemas en todos los
FREE

Indicador TurnPoint - Herramienta de señal de reversión de mercado y tendencia El indicador TurnPoint está diseñado para ayudar a los operadores a identificar posibles puntos de inflexión y niveles clave en el mercado. Mediante el análisis de la acción del precio, destaca las áreas en las que es probable que se produzcan retrocesos o continuaciones, lo que permite a los operadores anticiparse a los cambios de tendencia con mayor eficacia. Esta herramienta incorpora una lógica avanzada para filtr
FREE

El indicador Market Steps está diseñado y construido sobre la base de las correlaciones de tiempo/precio de Gann y optimizado por las reglas específicas de Price Action para el mercado de divisas. Utiliza los conceptos de flujo de órdenes del mercado para predecir las zonas de precios potenciales para un alto volumen de órdenes.
El Indicador de Niveles puede ser usado para operar por sí mismo o como una combinación para filtrar señales erróneas de otras Estrategias/Indicadores. Todo operador
El indicador KT Trend Reversal Probability calcula en tiempo real la probabilidad de un cambio de tendencia utilizando un algoritmo refinado basado en el RSI. Esta probabilidad se muestra como un porcentaje claro, lo que te ayuda a identificar cuándo una tendencia actual está perdiendo fuerza o cuándo podría estar formándose una nueva. Ya sea para planificar tus entradas o ajustar tus salidas, este indicador añade una ventaja basada en datos a tus decisiones de trading.
Características
Muestra

En el sistema de negociación "Masters of Risk ", uno de los conceptos principales está relacionado con los lugares donde los mercados cambian de dirección. De hecho, se trata de un cambio de prioridad y una violación de la estructura de la tendencia en los extremos del mercado, donde supuestamente hay o habría stop-losses de participantes "inteligentes" que están fuera de los límites de la acumulación de volumen. Por esta razón, los llamamos "Patrones de Reversión ", lugares con mucho peso para
Gold Flux Signal Pro es un indicador avanzado MT5 con Multi-Timeframe Logic, Candle Timer & Structured Signal Panel Indicador Inteligente de Scalping & Swing para MT5
Este indicador MT5 está diseñado para los operadores que valoran la claridad, la estructura y la precisión en la toma de decisiones. Proporciona una visualización clara de las señales de compra y venta utilizando un sistema lógico estable diseñado para mantener la coherencia después del cierre de la vela. La interfaz incluye un mo

Este indicador puede resultarle útil si sigue una estrategia basada en sesiones. Las barras se colorean según las sesiones. Todo es personalizable.
Ajustes: + Asia Sesión: zime, color, alta, baja + Sesión de Londres: zime, color, high, low + Sesión EEUU: zime, color, alto, bajo
Por favor, no dude en comentar si desea una característica y / o dar una revisión. Gracias.
FREE

Bollinger Bands % o Porcentaje de Bandas de Bollinger es uno de los indicadores utilizados en el Sapphire Strat Maker - EA Builder .
Se calcula utilizando la siguiente fórmula:
Perc = (PRECIO_CIERRE - BANDA_BOLLINGER) / (BANDA_BOLLINGER SUPERIOR - BANDA_BOLLINGER) * 100
Así, tomando la diferencia entre el precio de cierre a la banda inferior y dividiéndolo por la diferencia de los niveles de precios superior e inferior de un indicador de Bandas de Bollinger , podemos calcular este indicador.
FREE

Si te gusta este producto, por favor dale una calificación de 5 estrellas como muestra de agradecimiento.
Este indicador calcula y dibuja los puntos pivote y los niveles de soporte/resistencia para los marcos temporales diario y semanal: Nivel pivote (central) Niveles de soporte S1, S2, S3 Niveles de resistencia R1, R2, R3 Permite mostrar pivotes diarios, semanales o de ambos tipos , ofreciendo a los operadores referencias visuales de posibles zonas de soporte/resistencia.
Modo pivote: Elija qu
FREE

INTRODUCCIÓN Investment Castle Indicator se creó con la esperanza de resolver los siguientes problemas:
1. Dectate la dirección correcta de la tendencia en diferentes períodos de tiempo.
2. Muestra la tasa de aciertos, tasa de ganancias en el gráfico.
3. Este indicador no repinta el gráfico.
4. Este indicador está integrado en Investment Castle EA .
* Visite el sitio web para ver los archivos configurados, actualizaciones y más: https://www.investmentcastle.com
DESCARGO DE RESPONSABILIDAD
FREE
El KT Liquidity Sweep Filter identifica y resalta zonas clave de barrido de liquidez. Combina estas zonas con rechazos claros del precio y un filtro de tendencia adaptable para generar señales precisas de compra y venta alineadas con la tendencia del mercado. Distingue entre zonas de barrido de liquidez mayores y menores, marcando las principales con flechas grandes y las secundarias con flechas pequeñas para facilitar su identificación. Flechas grandes: Indican señales de reversión fuertes que

Este indicador ha sido desarrollado para ayudarlo como comerciante a identificar la dirección del mercado. En el comercio, tenemos tres tipos de movimientos y TENDENCIA ALCIENTE, TENDENCIA ABAJO y LATERAL. El movimiento lateral del mercado es donde la mayoría de los comerciantes quedan atrapados, ya que el precio es consolidación, esto simplemente significa que no hay dirección. Para los revendedores, esto puede ser una ventaja para ellos SOLO si saben cómo identificar cuándo las clases de acti
FREE

Super Strike - El Sistema de Precisión de Tendencia Definitivo
Super Strike es un sistema avanzado de seguimiento de tendencias que combina la precisión probada del algoritmo SuperTrend con el poder de filtrado de una Media Móvil dinámica. Construido para los operadores que exigen precisión y confianza, este indicador transforma la acción del precio en bruto en un sistema visual limpio, intuitivo y altamente informativo - un marco completo para tomar decisiones de trading más inteligentes.
En
FREE

El indicador Santa Donchian es una forma eficaz de detectar soportes, resistencias y rupturas en cualquier mercado.
El canal Donchian mide el máximo y el mínimo de un rango previamente definido. Normalmente, un operador buscaría un rango bien definido y luego esperaría a que el precio rompiera hacia uno de los lados para activar la entrada en la operación. Ventajas Nunca repinta, nunca retropinta, nunca recalcula. Funciona en todos los símbolos y en todos los marcos temporales. Filtro de tenden
FREE
Oscilador de Amplitud de Vela (Candle Amplitude Oscillator) Obtenga una perspectiva clara de la volatilidad del mercado con el Oscilador de Amplitud de Vela. Esta herramienta ligera y eficiente va más allá del simple análisis de precios para mostrarle la verdadera energía dentro de cada vela, ayudándole a tomar decisiones de trading más informadas. En lugar de adivinar si un mercado está activo o tranquilo, este indicador le ofrece una medida precisa y estandarizada de la volatilidad que funcion
FREE

Gold Master Indicator 2.0 Sistema Profesional de Señales para Oro Este indicador avanzado ha sido diseñado y optimizado específicamente para el trading de Oro (XAU), utilizando un enfoque de confluencia técnica : tendencia, momentum, volumen, estructura de mercado (S/R) y validación multi-temporal. Es la herramienta ideal para operadores que priorizan la calidad de la señal y la reducción de ruido operativo sobre la cantidad de entradas. 1. Resumen Funcional El sistema detecta oportunidades de

Ver e interpretar una secuencia de Velas es fácil cuando se es humano... Altos más altos, bajos más altos, son el panorama de una tendencia de Compra, al menos en un corto período de tiempo... Viendo una vela actual más alta y una vela más baja, como un ser humano, puede detectar inmediatamente una "divergencia", una "alerta", un "rango inicial", pero al final y sobre la base de otros análisis un operador humano puede entender y comportarse en consecuencia a este tipo de datos de velas ... ¿Pero
FREE

Esta es una versión gratuita y pronostica sólo 5 barras El indicador FourierExtrapolationMAFree transforma y extrapola la función Media Móvil por el método de Transformación Rápida de Fourier.
1. El periodo de transformación se establece mediante dos líneas verticales, por defecto la primera línea azul y la segunda rosa.
2. Por defecto, la línea de la Media Móvil (MA) se dibuja en rojo.
3. Mediante la Transformada de Fourier, el indicador construye un modelo de N armónicos, que se aproxima lo
FREE

El indicador muestra las pérdidas y ganancias (PnL) del día actual directamente en el gráfico de negociación. Anclado en la esquina superior derecha, muestra "PnL: [cantidad]"-verde si está arriba, rojo si está abajo, blanco si es cero. Cada vez que cierra una operación, se actualiza al instante, sumando sus beneficios, comisiones y swaps de todas las operaciones de compra y venta realizadas desde medianoche. Sin complicaciones, sin gráficos adicionales, sólo información en tiempo real sobre có
FREE

Es el mismo indicador Estocástico clásico, pero con un pequeño giro: cambiamos la Línea de Señal por una línea de 2 colores, para poder usarlo con EAs como sistema de filtrado. Y ya está. Sé que puede parecer estúpido, pero lo necesitaba, así que lo creé. La fórmula original es derecho del pecho de Metaquote, sin adiciones, sin sustracciones, es Stochastics en su núcleo.
Así que no voy a publicar aquí los parámetros Stochastics, ya que son todos los mismos de siempre ... ¡Que lo disfruten!
Si t
FREE

Este indicador calcula la tendencia a través de dos medias móviles diferentes y dibuja líneas de tendencia en zigzag. Puede cambiar la configuración de medias móviles rápidas y lentas para personalizarlo. Entradas:
Periodo de Tiempo MA Rápida : 64 Desplazamiento MA Rápido: 0 Método Fast MA: Suavizado Fast MA Aplicar a: Precio medio Periodo de tiempo MA lento: 32 Desplazamiento MA lento: 0 Método MA lento: Suavizado Slow MA Aplicar a: Precio medio ZigZag Color: Rojo Tipo de ZigZag: DashDot Ancho
FREE

Indicador de color SAR con alarma - Mejore su estrategia de negociación ¿Está cansado de vigilar constantemente los gráficos en busca de cambios de tendencia? Presentamos el Indicador SAR Coloreado con Alarma - una herramienta potente y fácil de usar diseñada para transformar el clásico SAR Parabólico (Stop and Reverse) en un sistema dinámico, visualmente intuitivo e impulsado por alertas. Perfecto para traders de todos los niveles, este indicador ya está disponible en el MQL Market y listo para
FREE

¡Un simple indicador de volumen según el color de la vela!
- ¡Fondo personalizado!
- Soporta volumen por garrapatas o volumen real.
El indicador de Volumen de Metatrader original no muestra los colores de la barra según el color de la Vela, solo cambia de color cuando el volumen de una vela es mayor que el anterior, esto a veces crea confusión para los principiantes y no conoce la real motivo del cambio de color.
Indicador gratuito, ¡el soporte puede tardar un poco en responder!
FREE
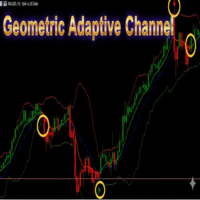
Geometric Adaptive Channel MT5 By Grok(xAI)
Un canal adaptativo de nueva generación basado en geometría multiplicativa y análisis espectral mediante Transformada Discreta de Fourier (DFT). NOTA: En las capturas de pantalla esta también el indicador MA Gaussiana . ---
### ¿Qué es y cómo funciona?
**Geometric Dynamic Channel Pro** es un **indicador de canal innovador** que **no utiliza medias móviles, RSI, MACD ni ATR**. En su lugar, aplica **cálculos geométricos ** sobre el precio en escala
FREE

TrendBoard ALMA SimpleVer — Rápido, claro y fácil de usar TrendBoard ALMA SimpleVer ofrece una forma rápida, clara y muy intuitiva de leer la estructura del mercado en múltiples marcos temporales. La versión gratuita permite monitorear cambios de tendencia basados en ALMA para USDJPY / EURUSD / BTCUSD en tiempo real. Funciones principales de SimpleVer Detección de tendencia suave con ALMA Clasificación de tendencia sin ruido para decisiones más seguras. Destacado inmediato de los giros
FREE
MACD Lines - Indicador MACD con visualización de líneas Descripción Este es un indicador MACD (Moving Average Convergence Divergence) modificado que presenta una visualización más limpia y elegante en comparación con el MACD estándar de MT5. La principal diferencia es que elimina el histograma tradicional y mantiene sólo el MACD y las líneas de señal, lo que permite una mejor visualización de cruces y tendencias. Características principales Línea MACD en azul oscuro con grosor 2 Línea de señal e
FREE

El indicador HighsAndLowsPro para MetaTrader 5 marca máximos y mínimos locales en el gráfico. Distingue entre máximos y mínimos débiles y fuertes. El grosor de las líneas y los colores se pueden ajustar individualmente. Por defecto, los máximos y mínimos débiles se muestran más finos y los fuertes más gruesos. Los máximos y mínimos débiles tienen 3 velas delante y detrás, cuyos máximos son más bajos y cuyos mínimos son más altos. Los máximos y mínimos fuertes tienen 5 velas cada uno.
FREE

Buyer Seller Balance Analyzer ofrece una visión completa de la fuerza de compradores y vendedores en múltiples marcos temporales. Componentes principales: Tabla Buyer/Seller Balance Muestra la proporción de compradores y vendedores Cubre marcos temporales desde M1 hasta MN1 Valores codificados por colores (verde = compradores, rojo = vendedores) Métricas clave: Buyers (%) – Porcentaje de compradores Sellers (%) – Porcentaje de vendedores ️ Balance – Diferencia entre co

Este es un indicador ANTIGUO que era bastante eficiente para ser emparejado con MA Cross, Bollinger Bands, Dochian Channel y muchas otras estrategias y esto le proporciona el cambio de mercado de tendencias BEAR y BULL. Ya que no hay mucho listado en MT5 Market, me gustaría compartir mi propio indicador para su uso. Por favor, siéntase libre de comentar o criticar para mejorar el indicador de la lista.
FREE
Sesiones Bias Esta estrategia de sesgo útil para aquellos que siguen TRADESHARE en youtube. Este script está diseñado por BokaroTraderFx para los traders que desean asistencia para determinar su sesgo de sesión, particularmente para aquellos que operan dentro de sesiones típicamente representadas por una sola vela de 4 horas. El método consiste en utilizar la acción del precio para establecer un sesgo diario, guiando las decisiones sobre si centrarse en las compras, ventas, o ambos. El análisis
FREE

La señal alcista DCA SP500 - WinWiFi Robot Series (Índices, Energía y Divisas) Visión general: Aumente la precisión de sus operaciones con el último indicador de la serie de robots WinWiFi . Diseñado específicamente para mercados de alta volatilidad como los Índices Globales, Energía y Forex, "The Bull DCA SP500 Signal" le ayuda a filtrar el ruido del mercado y capturar las principales tendencias en el marco temporal H4 . Tanto si está scalping para una ruptura o swing trading para tendencias l
FREE

¡El indicador personalizado lleva tu media móvil al siguiente nivel, permitiéndote combinar MA de hasta 5 símbolos diferentes! ¿Por qué? De esta manera, tus decisiones se basan en mercados complementarios. Ejemplo: Tú operas en Nasdaq, pero quieres seguirle la pista a Bitcoin y Russell 2000 al mismo tiempo para conocer la tendencia del mercado. O estás operando con XRP, pero quieres tener una visión global a tu favor. ¡Ahora es posible! Asegúrate de que los símbolos coincidan con tu bróker, ya q
FREE
MetaTrader Market - robots comerciales e indicadores técnicos para los trádres, disponibles directamente en el terminal.
El sistema de pago MQL5.community ha sido desarrollado para los Servicios de la plataforma MetaTrader y está disponible automáticamente para todos los usuarios registrados en el sitio web MQL5.com. Puede depositar y retirar el dinero a través de WebMoney, PayPal y tarjetas bancarias.
Está perdiendo oportunidades comerciales:
- Aplicaciones de trading gratuitas
- 8 000+ señales para copiar
- Noticias económicas para analizar los mercados financieros
Registro
Entrada
Si no tiene cuenta de usuario, regístrese
Para iniciar sesión y usar el sitio web MQL5.com es necesario permitir el uso de Сookies.
Por favor, active este ajuste en su navegador, de lo contrario, no podrá iniciar sesión.