适用于MetaTrader 5的技术指标 - 25

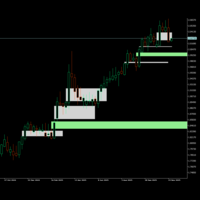
The indicator represents the session boxes for the Asian, European and American sessions. It is possible to change the time of each session, such as color. It is also possible to disable the display of each session. You will find in input parameters variables to modify in format hh:mm. In Colors tab you can change the color of boxes of each sessions. If you need some implementations please contact me.
FREE

Several assets in several markets have the behavior of using specific numbers as Force Numbers, where support, resistance and price thrust is created. Let this indicator draw those levels of support and resistance for you. You can also stack it to show different level of Prices! This technique is being used by Tape Readers and Order Flow traders all over the world for a long time. Give it a try. Challenge yourself to study new ways of Price Action!
SETTINGS
What Price reference to use in the c
FREE

The ADX Histogram is a modern and visual upgrade of the classic Average Directional Index (ADX) .
It transforms the standard ADX and DI+ / DI– values into a color-coded histogram , making trend analysis much clearer and faster. Key Features: Histogram with four states : Blue = Normal Buy Trend Green = Strong Buy Trend Orange = Normal Sell Trend Red = Strong Sell Trend Automatic strength detection : uses the ADX line to separate “normal” vs. “strong” signals. Fully customizable: ADX
FREE

This indicator is based on Bollinger Bands and moving averages, and uses ADX to get the turning point of the market trend and display a sign.
It is basically intended for use with currency pairs and futures with high volatility. In our tests we use it on XAUUSD, 5m and 15m. Win rate is more than 80% with 50 pips stop loss and 50 pips gain or more.
The indicator is also a simple indicator that allows you to enable or disable alerts and change the color of the arrows from the indicator settings
FREE

Dynamic Supply and Demand indicator automatically identifies and displays Supply and Demand Zones on your chart based on price action patterns and market structure. These zones represent areas where institutional buying or selling pressure has historically occurred, making them key levels for potential price reactions. This form of indicator takes inspiration from ICT as well as traditional Support & Resistance formation. **For the first 50 candles (number depends on LookBackCandles) when indic
FREE

Moving Average Convergence/Divergence — схождение/расхождение скользящих средних — технический индикатор, разработанный Джеральдом Аппелем (Gerald Appel), используемый в техническом анализе для проверки силы и направления тренда, а также определения разворотных точек. Встроенный в MetaTrader 5 индикатор MACD не соответствует задумке автора (Gerald Appel):
-линия MACD графически изображена в виде гистограммы, однако гистограммой отражается разница между линией MACD и сигнальной линией;
-сигнальн
FREE

Identification of support and resistance areas
A useful indicator for traders
completely free
Can be used in all symbols
Can be used in all time frames
It has three different trends: short term, medium term, long term
Settings:
Clr1,2: You can change the color of the lines
Type Trend: You can determine the trend
Message me for questions, criticism and suggestions
FREE

Mahdad Candle Timer 是一款轻量级且精确的 MetaTrader 5 指标,它会在最新一根K线旁边显示当前K线的剩余时间。该工具专为依赖精准时机的交易者设计——无论是剥头皮、日内交易,还是等待K线确认的波段交易。 主要功能 精准倒计时 – 以 HH:MM:SS 显示剩余时间(可选毫秒) 动态定位 – 始终与最新K线对齐,不受图表缩放或比例影响 智能颜色适配 – 文本颜色会根据背景和K线方向(看涨/看跌)自动调整 自定义提醒 – 在K线收盘前X秒发出声音或弹窗提醒 完全可定制 – 字体、大小、颜色、刷新速度和提醒参数均可调整 轻量高效 – 占用极低CPU资源,不影响其他指标或EA运行 ️ 输入参数 ShowMilliseconds (true/false) Update Interval (ms) Bullish/Bearish Colors (Light/Dark) Font & Size Enable Alarm (true/false) Alert Seconds Before Close Alert Sound File 使用场景 剥头皮交易者
FREE

super trend version is to help you to have real time view of market move it will help you to get a live view of current market buy signal line and arrow to help you understand batter the direction sell signal line and arrow to help you understand batter the direction trade what you see not what you think this is an simple and best trading tool for our traders of any market crypto gold
FREE
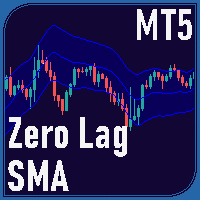
Zero Lag SMA for MT5 The Zero Lag SMA (ZLSMA) indicator for MT5 provides a variation of the Simple Moving Average (SMA) designed to minimize lag, offering traders a more responsive moving average that adjusts more quickly to price changes. This makes it useful for identifying potential trend reversals and key price levels in a timely manner.
If you want to see more high-quality products or order the development/conversion of your own products, visit my partners' website: 4xDev
Get 10% OFF on m
FREE

Dual Bollinger Session Channel MetaTrader 5 专业固定会话布林通道
专为价格行为、突破交易及机构级市场结构分析而设计,基于真实交易会话数据。 限时优惠: 本指标免费提供至 2026年1月15日 ,或限前 100 次下载 ,以先到者为准。 产品概述 Dual Bollinger Session Channel 是一款 MetaTrader 5 的专业级技术指标,它基于前一个真实交易会话(日线或周线)的数据,通过两个独立的布林带计算,构建出固定的统计价格通道。 与传统布林带在每个新K线出现时持续重算不同,本指标会在整个当前活跃会话期间 锁定所有通道水平 ,为交易者在整个交易时段内提供稳定可靠的统计框架。 该方法可精准可视化以下内容: 价格均衡区域 统计超伸区域 波动率扩张与收缩区域 该指标在 任意时间周期 下均完全可用,保持视觉一致性,并消除基于对象类指标常见的失真问题。 运行逻辑 识别上一个有效的交易会话(日线或周线) 计算两条独立的布林带: 内轨(BB1) :使用较小的标准差 外轨(BB2) :使用较大的标准差 所有计算出的水平在当前整个会话
FREE

Free Session High Low Indicator for MetaTrader 5.
This indicator displays the High and Low levels
of a selected trading session.
Features:
Calculates session High and Low levels
Uses closed candles only (non-repainting)
Clean and simple visual display
Suitable for manual trading
Free version limitations:
- Single session
- No alerts
- No breakout logic
This free indicator is provided for educational purposes.
If you need:
Alerts
Multiple sessions
Breakout strategy
Expert Adv
FREE
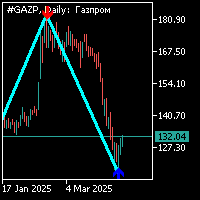
之字形指示器是标准的,周期为34,带有额外的箭头信号。 附加信号与之字形指示器分开计算。该指标的工作如下:1。 当形成之字形指示器的一段并且附加信号以箭头的形式出现时,您需要在箭头的方向上打开一个位置;2。 当zig-zag指示器的另一个臂在与前一个臂的顶部的附加信号(箭头)相反的方向上形成时,就可以建立一个挂单的位置。 在形成与附加信号(箭头)相反的锯齿形肩之后,您可以添加到之前的打开位置或将止损移动到这个水平;4. 如果您以保守的交易模式进行交易,则无法在价格走势的第一次回调之前开设额外的头寸;5。 为了准确地进入市场,您可以等待zig-zag指标段的形成和高级时间框架上的额外信号的出现,同时在距离未平仓头寸不超过40点的位置放置止损。 6. 在您为交易添加了额外的头寸后,未平仓头寸的止损应保持在相同的价格水平,如果头寸在止损处关闭,那么您将以平均值获利;7。 止损,建议在下一个价格回调形成后重新排列(指标的一段将形成之字形朝向附加信号(箭头))。 8. 如果在之字形段形成后,一个额外的信号以箭头的形式出现在你交易的时间框架上,所有的开放头寸都被关闭 9. 在高度波动的金融市场中,

Trend Entry Indicator Your Trading will Be easier with this indicator!!! This Indicator is Developed To make our trading life easier. Get an Arrow for Entry with Take Profit and Slop Loss marks on chart. - Indicator is Based on trend, because thats what we all want we want to follow the trend "it's our friend". - Based on Levels, price action and oscillators. - It works on all currency pairs, all indices, metals and stock. - it works on all pairs/indexes on Deriv including Boom and Crash. - Tim

买卖双方压力指标是一个综合的市场分析工具,能够同时显示从M1分钟图到D1日线图等多个时间框架的市场情绪和力量对比。该指标通过精密的移动平均动量分析算法,在用户可自定义配置的周期内准确计算买方压力和卖方压力的具体百分比数值。其直观的可视化操作面板采用动态进度条设计,买方力量以醒目的青色(蓝绿色)显示,卖方主导力量则以鲜明的红色标识,当压力值达到显著水平时还会显示精确的百分比数值。每个时间框架都集成了专业的ADX平均趋向指数强度测量功能,配备清晰的方向性指标来准确识别和显示当前的上升趋势、下降趋势或横盘震荡市场状态。特别是在市场处于震荡整理期间(当ADX数值低于23阈值时),经验丰富的交易者可以灵活运用区间交易策略,通过在关键支撑位附近逢低买入,在重要阻力区域附近逢高卖出来获取稳定收益。智能化的彩色信号提示点系统为交易者提供即时的视觉确认,帮助准确判断市场条件变化并把握最佳的进场和出场时机。 成功消息- 分析完成!多时间框架情绪数据已准备好用于战略交易决策。

Elliot Waves Analyzer Pro calculates Elliot Waves to Help Identify Trend direction and Entry Levels. Mainly for Swing Trading Strategies. Usually one would open a Position in trend direction for Wave 3 or a Correction for Wave C . This Indicator draws Target Levels for the current and next wave. Most important Rules for Elliot Wave Analysis are verified by the Indicator. The Pro version analyzes Multiple Timeframes and shows the Subwaves and Target-Levels. For an Overview " Elliot Waves Anal
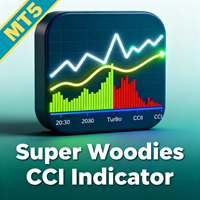
提升您的交易优势,使用 Super Woodies CCI Indicator MT5,这是一个先进的动量振荡器,受肯·伍德著名的 Woodies CCI 系统启发,该系统在 2000 年代初因其双 CCI 方法用于发现循环模式和高概率设置而在日内交易者中流行。广泛受到外汇、股票和商品交易者的青睐,这个指标利用 Commodity Channel Index (CCI) 来检测超买/超卖状况、趋势延续和反转,社区论坛如 Forex Factory 和 TradingView 强调其在减少虚假信号方面的有效性——通常通过清晰的视觉提示如 Zero Line Rejects 和 Trend Line Breaks 将胜率提高 15-25% 在基于动量的策略中。其持久吸引力在于简化复杂的市场动态,在波动会话中启用精确入口,同时最小化情绪交易,使其理想用于剥头皮者、波段交易者和寻求强劲趋势强度确认的自动化系统。 Super Woodies CCI Indicator MT5 通过彩色直方图可视化融合:白色 CCI 线(默认周期 100,典型价格)用于核心动量,黄色 Turbo CCI (TCC

-蜡烛芯填充趋势概念
在市场的高波动性事件中,蜡烛往往会在其移动过程中产生灯芯。蜡烛图中的灯芯反映了价格的拒绝。大多数情况下,这些蜡烛芯被填满是因为有巨大的成交量向该方向推动。烛芯填充趋势扫描那些专注于趋势市场的机会。
它有一个成功率模拟器仪表板,显示带有进入点、获利和止损的实时信号。这个成功率模拟器可以作为回溯测试,检查哪些输入在过去有更好的利润。它计算点数和百分比的利润,根据过去的表现给出一个整体的概念,什么是最好的参数。
- 投入
-趋势阀芯。这个输入决定了指标所要扫描的阀芯的大小。它是以百分比来衡量的。它的默认值为20%。
-信号的数量。这是成功率模拟器所要扫描的信号数量。
-移动平均数。这个过滤器是移动平均线指标和RSI的组合。用户有机会根据自己的需要设置RSI和移动平均线。
-前一栏方向。这个功能可以避免或允许基于前一根蜡烛的信号。如果是真的,该指标将只考虑在前一根蜡烛是在相同的趋势方向上的灯芯作为信号。如果它是假的,它将考虑所有的灯芯。
-最后的高点和低点:该功能允许交易者在最后的 "x "条中扫描最后的高点和低点,以避免范围期。
-最小的蜡烛尺寸。此
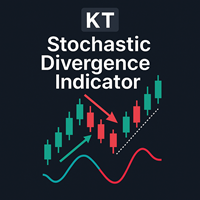
背离是市场中预测价格反转的重要信号之一。KT Stoch Divergence 指标可识别价格与随机指标之间形成的常规和隐藏背离。
KT Stoch Divergence 的局限性
仅将随机背离用作入场信号可能存在较大风险。并非所有背离都预示强烈的反转信号。为了提高准确率,建议结合价格行为和趋势方向使用。
功能特色
标注价格与随机指标之间的常规和隐藏背离。 支持趋势反转与趋势延续的交易策略。 可嵌入至自动交易专家顾问(EA)中使用。 过滤掉不对称背离,减少图表混乱并提升精度。 既可用于入场,也可用于出场。 包含所有 MetaTrader 提供的预警功能。
什么是背离? 通常来说,当价格创出新高时,振荡指标也应创出新高;当价格创出新低时,振荡指标也应创出新低。当价格与振荡指标未同步时,即为出现背离。这表示价格与指标行为相矛盾。背离分为两种类型:
常规背离 常规看涨背离:价格创出新低,但指标创出更高的低点。 常规看跌背离:价格创出新高,但指标创出更低的高点。 隐藏背离 隐藏看涨背离:价格创出更高的低点,指标却创出更低的低点。 隐藏看跌背离:价格创出更低的高点,指标却创出更高的高点

KT Heiken Ashi Alert 基于标准的平均足蜡烛图绘制买入和卖出箭头,并发出交易提醒。对于希望将 Heiken Ashi 应用于交易策略的交易者来说,这是一个必备工具。 当 Heiken Ashi 从空头状态变为多头状态时,绘制买入箭头。 当 Heiken Ashi 从多头状态变为空头状态时,绘制卖出箭头。 支持手机通知、电子邮件、声音和弹窗提醒功能。
什么是 Heiken Ashi? 在日语中,“Heiken Ashi” 的意思是“平均蜡烛”。它用于使蜡烛图更加易于阅读和识别趋势。交易者可以使用 Heiken Ashi 进行进场和出场决策。颜色的变化通常代表市场方向的变化。
重要提示
不建议将 Heiken Ashi Alerts 作为单独使用的指标,应与其他技术指标结合使用以获得更准确的分析。 趋势的改变通常从一根具有上下影线的小蜡烛开始。 没有上影线的红色蜡烛表示强烈的下跌趋势。 没有下影线的蓝色蜡烛表示强烈的上涨趋势。
Heiken Ashi 计算公式 Heiken Ashi 蜡烛图与普通的日本蜡烛图类似,但计算方式不同。 开盘价 =(上一根蜡烛的开盘价 +
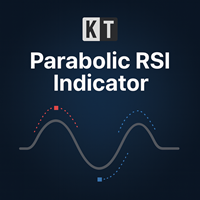
KT Parabolic RSI 将抛物线SAR直接叠加在RSI线上,用来突出可能的市场转折点。传统的RSI超买和超卖读数已经提示潜在的反转,但加入PSAR过滤器后,能有效去除大量噪音,使信号更加清晰和可靠,从而为交易者提供更稳健的入场和出场机会。 大方块信号: 当RSI处于超买或超卖区域时,Parabolic SAR翻转。这通常标志着高概率的市场转折。 小方块信号: 当RSI位于中性区间时出现的SAR翻转。将其视为低概率提示,更适合用于部分止盈或顺势跟随。
功能特点 将RSI动能和Parabolic SAR趋势翻转整合在同一个窗口中,无需再使用两个分离的指标。 出现在RSI窗口中的方块标记会同步显示在主图表上,这样您可以在观察价格走势的同时捕捉到信号。 结合K线形态分析和RSI-SAR定量信号,帮助您在入场前确认图表形态的可靠性。 支持自定义RSI周期、Parabolic SAR步长与最大值,以及超买和超卖阈值,以便适应不同交易风格与市场环境。 提供弹窗、声音、邮件和移动推送提醒,让您即使不在电脑前也能及时掌握每一个信号。
为什么结合RSI和Parabolic SAR有效 RSI

It is the very same classic Stochastic indicator, but with a little twist: we changed the Signal Line with a 2-color line, so we can use it with EAs as a filtering system. And that's it! I know it could seem stupid but I needed that, so I created it. The original formula is right from Metaquote's chest, no additions, no subtractions, it is Stochastics in its core.
So I will not publish here the Stochastics parameters as they are all the same as always... Enjoy!
If you like this indicator, all I
FREE
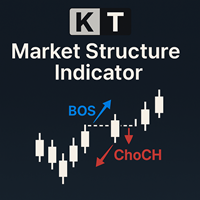
The KT Market Structure intelligently detects and displays Break of Structure (BOS) , Change of Character (CHoCH) , Equal Highs/Lows (EQL) , and various significant swing high/low points using our proprietary algorithm for accurate pattern detection. It also offers advanced pattern analysis by effectively demonstrating the captured profit for each pattern. A fully automated EA based on this indicator is available here: KT Market Structure EA MT5
Features
Accurate Pattern Detection: Our advance
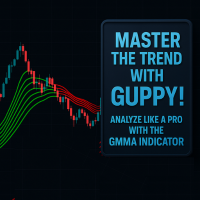
This is a custom Guppy-style Moving Average indicator built for MetaTrader 5 (MT5), designed to replicate the appearance and logic of the popular TradingView version. Unlike the built-in tools in MT5, this indicator offers a simplified yet powerful approach by using only 6 Exponential Moving Averages (EMAs). It provides clean visualization and accurate market layering to help traders make better decisions. Features
TradingView-Style Guppy Logic – Displays 6 EMAs for combined short- and medium-
FREE

Haven Fibonacci Volume Profiles — 您的自动市场区间分析师 隆重推出 Haven Fibonacci Volume Profiles — 一款将市场分析提升到新水平的强大工具。该指标可自动识别基于重要转向点(枢轴点)构建的关键价格区间,并在每个区间上叠加详细的成交量分布图和斐波那契水平。这使交易者能够即时了解流动性集中在哪里,以及真正的支撑位和阻力位位于何处。 其他产品 -> 这里 . 无需再猜测哪个区间是有效的。该指标为您完成所有复杂的工作,同时显示历史和当前的价格区间,让您全面了解市场背景。 指标主要功能 自动识别区间: 指标可独立找到重要的高点和低点(枢轴点),并在此之间构建价格区间。 详细的成交量分布图: 为每个区间计算并显示成交量分布图,突出显示交易活动最多和最少的区域。 可自定义的斐波那契水平: 斐波那契水平会自动应用于每个区间。您可以启用、禁用并自定义每个水平的颜色(0.0、0.236、0.5、1.0 等)。 POC(控制点)可视化: 成交量分布图清晰显示成交量最大的水平,该水平通常作为强支撑或阻力。 历史分析: 指标不仅显示当前的价格区间

Multi-Currency Strength Dashboard PRO MT5 (v2.6) – 货币强弱仪表盘指标 Multi-Currency Strength Dashboard PRO 是一款用于 MetaTrader 5 的指标,可实时计算并显示 8 种主要货币 (USD、EUR、GBP、JPY、CHF、CAD、AUD、NZD)的相对强弱,并分析最多 28 个外汇货币对 (具体取决于您的经纪商是否提供相应交易品种)。 本工具旨在提供清晰、结构化的强弱概览,帮助您更快地 筛选需要进一步分析的货币对 (强势货币对弱势货币),并识别强弱差较小、方向性可能较弱的组合。 主要功能 图表内可视化仪表盘 :以强弱柱状条显示结果(0–100 归一化刻度)。 最多 28 货币对分析 :自动生成可用品种列表,并支持经纪商后缀(如存在)。 Best Pairs :根据可配置的最小强弱差,列出值得关注的组合。 Worst Pairs :识别强弱差较小的组合,用于过滤与回避。 提醒功能 :强势/弱势货币提醒与最佳机会提醒(可选推送通知)。 v2.6 更新内容 新增 3 种计算模式 : Price
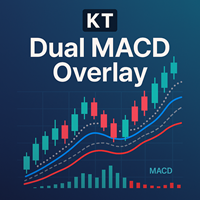
KT Dual MACD Overlay 在价格图表上直接叠加两组完整的 MACD:一组来自当前周期,另一组来自更高周期。快速 MACD 捕捉短线动能,而慢速 MACD 让你始终与大周期趋势保持一致。 两者与 K 线同屏显示,无需来回切换窗口即可获得市场动能的完整视角。
买入信号
主买入: 当上涨趋势启动时,图表会出现一条蓝色竖线。 加仓买入: 快速 MACD 上穿信号线且得到慢速 MACD 与总体多头趋势确认时触发。 卖出信号 主卖出: 当下跌趋势启动时,图表会出现一条橙色竖线。 加仓卖出: 快速 MACD 下穿信号线且得到慢速 MACD 与总体空头趋势确认时触发。
功能 双 MACD(快+慢)联用,形成更完整可靠的系统;单一 MACD 往往缺乏背景。 用竖线清晰标记新趋势起点。 即使错过主入场,仍提供多次顺势再入场机会。 相比标准 MACD 金叉死叉,叠加方案精度与可读性更高。 三类关键事件提醒:主趋势变化、快速 MACD 交叉、来自高周期的慢速 MACD 交叉。 对快速 MACD 交叉进行平滑处理,降低虚假信号。 从零开始编码,界面简洁无杂乱。 支持所有 MetaTrader

Place price Alerts on extended Rectangles and Trendlines - Risk reward indicator MT5 Extend Rectangles & Trendlines to the right edge Mark your supply demand zones with extended rectangle and draw support resistance lines with extended trendline. Find detailed manuals here . Find contacts on my profile . MT4 Rectangle extender indicator will simplify and make it easier for you to analyze markets and stay notified about important events. When you extend rectangle or trendline the action butt

All traders should know the trend before making their decision when placing the buy or sell orders. The first step always starts with supply and demand , rising and falling channels , trend lines, engulfing candles etc. All the above contribute to what is called “Price Action” and that is the best and most reliable way in trading and catching the trend and making profits, without stress. The Investment Castle Trend Line Indicator will automatically draw the trend lines on the MT5 for you.
FREE

El indicador técnico Trend Magic es una herramienta de análisis de tendencias que combina el Índice de Canal de Mercancía (CCI) y el Rango Verdadero Medio (ATR) para identificar la dirección de la tendencia del mercado. Aquí tienes un resumen de sus pros y contras, así como las mejores condiciones del mercado para su uso:
Pros: - Identificación clara de la tendencia: Cambia de color para indicar tendencias alcistas (azul) y bajistas (rojo), lo que facilita la visualización de la dirección del
FREE

Cycle Sniper MT5 Cycle Sniper MT4 Version and definitions : https://www.mql5.com/en/market/product/51950 Important Notes: MT5 Version does not include Breakout Mode and Late Entry Mode Features.
MT5 Version does not include RSI and MFI filter. **Please contact us after your purchase and we will send you the complimentary indicators to complete the system.**
This indicator does not send any signal without a reason...You can observe and analyze the indicator and the signals it sends Cycle Sni

这个指标采用经典的MACD和Zigzag结合用于检测价格和指标的背离,并采用先进的人工智能技术检测背离的有效性。MACD是指标之王,Zigzag也是非常有用的指标,这个指标把两个指标结合起来,发挥两个指标的优势。检测背离存在概率的问题,通常背离了又背离,所有我们试图通过先进的人工智能技术判断背离的有效性,过滤掉无效的背离,然后通过多种方式提醒用户。 促销价:59$ 功能 1.MACD形式的Zigzag指标 2.检测价格和MACD指标背离 3.通过AI技术检测背离的有效性 4.背离信号预警提醒 5.背离信号手机提醒 6.背离信号邮件提醒 7.使用于多个周期 8.使用 强大的ONNX( Open Neural Network Exchange )模型格式
使用 底背离: 单MACD在下面交叉时,指标会检测出是否底背离,画出向上的箭头,并提醒
顶背离: 单MACD在上面交叉时,指标会检测出是否顶背离,画出向下的箭头,并提醒
输入参数 Fast EMA period = 12; Slow EMA period = 26;

FlatBreakout MT5 (Free Version) Flat Range Detector and Breakout Panel for MT5 — GBPUSD Only FlatBreakout MT5 is the free version of the professional FlatBreakoutPro MT5 indicator, specially designed for flat (range) detection and breakout signals on the GBPUSD pair only.
Perfect for traders who want to experience the unique fractal logic of FlatBreakout MT5 and test breakout signals on a live market without limitations. Who Is This Product For? For traders who prefer to trade breakout of
FREE

You can configure to show multiple take profit targets based on the current price all based on volatility; I personally use it every day with an script to automate my entries; For example if i want to stop out for 4 volatility level and use an take profit of 10 volatility based on the 2 minutes of the previous 20 bars i can do it with this indicator; You can configure multiple take and multiple stops with different names to show in your symbol, all take profit and stop losses in this indicator i
FREE

Bollinger bands out/in strategy A strategy created by Joe Ross, and very useful for finding trades when the market is overloaded. Indicator You don't need to find where there are entries on the chart, this indicator shows them for you. The entrance The trade is confirmed when the price closes outside the bollinger bands on a candle and the candle after the price closes inside the bands. comment I want to improve this indicator, so you can help me sending me your reviews and comments, thanks :).
FREE

Highly configurable Williams %R indicator. Features: Highly customizable alert functions (at levels, crosses, direction changes via email, push, sound, popup) Multi timeframe ability Color customization (at levels, crosses, direction changes) Linear interpolation and histogram mode options Works on strategy tester in multi timeframe mode (at weekend without ticks also) Adjustable Levels Parameters:
Williams %R Timeframe: You can set the current or a higher timeframes for Williams %R. Williams
FREE
If you like this product, please give it a 5 star rating as a token of appreciation.
This indicator identifies and displays Fair Value Gaps (FVG) on price charts.
Fair Value Gaps are price zones where there's a significant imbalance between buying and selling pressure, creating "gaps" in price action. The indicator detects two types and when they are mitigated(touched):
Bullish FVG: When a candle's low is above the high of a candle two periods earlier.
Bearish FVG: When a candle's high is bel
FREE

TransitTrendlines this is a automatically trendline drawer, it draw both horizontal and diagonal trendlines. The horizontal trendlines are the pivot points of the day timeframe and the diagonal trendlines are based on the current time frames. You can adjust the diagonal trendlines by increasing the number of bars to draw the diagonal trendline and can also adjust the steepness. Note that the Horizontal trendlines are based on the day pivot points not currant time frame. Join mql5 transitbk98 cha
FREE

Hull Suite by Riz | MT5 Indicator Overview: Hull Suite is a premium trend-following indicator that combines three powerful Hull Moving Average variations (HMA, EHMA, THMA) into one versatile tool. Designed for traders who demand clarity and precision, this indicator helps identify trend direction with minimal lag while filtering out market noise. Key Features: Three Hull Variations – Switch between HMA (classic), EHMA (exponential smoothing), and THMA (triple weighted) to match your trading styl
FREE
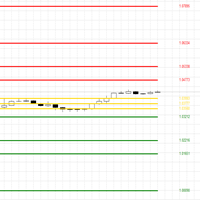
The CPR (Central Pivot Range) Indicator is a powerful technical analysis tool designed to identify key support and resistance levels on your MetaTrader 5 charts. It calculates the Central Pivot (CP) as the average of the previous day's high, low, and close prices, providing a central reference point. Calculates and plots 11 pivot levels (CP, BC, TC, S1-S4, R1-R4) Adjustable lookback period (default: 5 days) Option to show or hide price labels with customizable size and offset Fully customizable
FREE

Market Trading Sessions is an indicator that identifies major market sessions such as:
London (09:00 - 18:00 UTC+2) New York (15:00 - 00:00 UTC+2) Sydney (23:00 - 8:00 UTC+2) Tokyo (02:00 - 11:00 UTC+2)
It displays each session’s start and end times, along with its high and low, providing traders with a clearer view of price volatility throughout the day. The indicator offers high customizability, allowing you to adjust session times and modify the plotting style to match your preference.
If yo
FREE
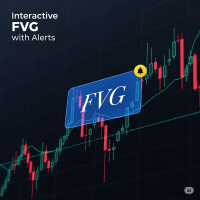
FVG Indicator with Alerts Description: This is a simple and effective indicator for identifying and displaying Fair Value Gaps (FVGs) on any timeframe. The indicator helps you see important price imbalances and provides powerful interactive tools for your analysis. Key Features: Detects FVGs: Clearly identifies and draws boxes around Bullish and Bearish Fair Value Gaps. Midline Level: Displays the 50% equilibrium level inside each FVG box, a critical point of interest. Complete Alert System: Rec
FREE

凤凰点差面板(MT5)
专为MetaTrader 5设计的实时点差监控面板。在图表上以点数形式显示当前买入/卖出点差。
功能定位
点差扩大是交易亏损中最易被忽视的因素之一。在流动性低迷、隔夜持仓、重大新闻事件或市场剧烈波动期间,点差可能急剧扩大——使原本合理的交易瞬间陷入亏损。
凤凰点差面板提供持续的实时点差成本可见性,使交易者能在建仓或管理仓位前做出明智的执行决策。面板自动更新,兼容所有符号类型。
安装
从MQL5市场下载后附加至任意图表。面板即时显示且无需配置。
系统要求
MetaTrader 5 3280版或更高版本。本工具为指标类,支持所有经纪商及符号。
反馈与评价
若您认为本工具实用,敬请在MQL5平台给予五星好评。您的反馈将直接影响凤凰系列工具的未来更新、优化及新功能开发——我们致力于打造交易者真正重视的工具。
技术支持
通过MQL5私信提供终身支持,24小时内响应。
开发方:凤凰环球投资有限公司 2025 凤凰环球投资有限公司。保留所有权利。
FREE

UT Bot Alerts is a technical indicator for MetaTrader 5 that highlights potential directional changes based on momentum conditions.
The indicator marks signal points directly on the chart and can generate optional notifications for convenience. The signal generation logic can operate in two modes: Closed-bar mode: signals are confirmed only after the bar closes. Live-bar mode: signals are displayed during the formation of the current bar. Both modes are available depending on the user's preferr
Support Resistance Channel MT5 The Support Resistance Channel MT5 indicator plots dynamic support and resistance levels based on a configurable lookback period, displaying them as green and red lines respectively. It optionally shows goldenrod-colored arrows when price touches these levels, indicating potential trend changes (not explicit buy/sell signals) , along with customizable "RES" and "SUP" labels. With adjustable parameters like lookback period, arrow size, and label offset, it offers t
FREE

Moving Average RAINBOW Forex traders use moving averages for different reasons. Some use them as their primary analytical tool, while others simply use them as a confidence builder to back up their investment decisions. In this section, we'll present a few different types of strategies - incorporating them into your trading style is up to you! A technique used in technical analysis to identify changing trends. It is created by placing a large number of moving averages onto the same chart. When a
FREE

RiskKILLER_AI Navigator 是一款基于人工智能的多时间框架市场方向与策略助手。 交易表现的关键在于像专业人士一样理解市场。这正是 RiskKILLER_AI Navigator 所提供的: 通过 AI 驱动的趋势、情绪和宏观分析( 独立于 MQL5 ),获得机构级别的洞察,并适应您的交易风格。 购买后,如需获取用户手册,请:1. 发布一条 评论 索要 2. 给我发送 私信 。 [ 专属群组 | MT5 版本 - MT4 版本 ]
核心优势 跨多个时间框架和资产的实时市场方向 AI 驱动的宏观指标、新闻和情绪分析 根据您的交易风格(手动或自动)提供定制建议 与 RiskKILLER_AI 专家顾问 (EA) 直接协同工作
主要特性 AI 驱动的全球趋势仪表板 - 即时查看 M1 到 D1 时间框架下主要外汇货币对和 BTCUSD 的市场偏向(盘整、看涨、看跌)。 策略感知型 AI 助手 - RiskKILLER_AI Navigator 适应您的策略并突出机会: 马丁格尔 / 网格 / 均价定投 (DCA) - 提示风险和波动性陷阱 均值回归 - 识别有利的盘整条

Smart Trend pro New - Advanced Trend Indicator with Interactive GUI Professional trend-following indicator with comprehensive visualization and control panel Key Features: Advanced Trend Detection Reliable Half Trend algorithm for precise trend identification Color-coded trend lines (Blue for bullish, Orange for bearish) Customizable amplitude parameter for different trading styles Interactive GUI Panel Real-time market strength visualization (Bulls vs Bears) Current signal display (Buy/Se
FREE

Investment Castle Support and Resistance Indicator has the following features: 1. Dictates the direction of Buy or Sell trades based on Support and Resistance Levels automatically . 2. Candles stick colors will change to Red for Sell and Blue for Buy (Default settings, user can change from the inputs). 3. This indicator is built-in the Support & Resistance based Investment Castle EA which works with Psychological Key Levels "Support & Resistance".
FREE

This indicator draws regular bullish and bearish divergences in real-time onto the charts. The algorithm to detect those divergences is based on my 10+ years experience of detecting divergences visually. The divergences are drawn as green and red rectangles on the charts. You can even do forward testing in the visual mode of the strategy tester. This FREE Version is restricted to EURUSD and GBPUSD. The full version without restrictions is here: https://www.mql5.com/en/market/product/42758
Para
FREE
TW Volume Signal Pro MT5 利用先进的人工智能技术和专有智能算法,让您在黄金市场中交易更有信心,带来独特且无与伦比的交易体验。
您是否正在寻找高精度和卓越的黄金市场交易信号?
通过 TW Volume Signal Pro MT5,您可以成为专业交易者,并在黄金市场取得巨大成功。立即免费试用!
TW Volume Signal Pro MT5 的主要特点: 精准信号,固定止盈和止损 快速识别市场趋势变化 实时进出场提醒 三重利润目标的风险管理 安全区域自动止损 完全可调和自定义 在图表旁显示信号历史 在黄金和外汇市场表现出色 适合剥头皮交易者(M5 和 M15) 可在策略测试器中测试
为何选择此产品?
高准确性:精确且固定的信号 易用性:简洁友好的界面 灵活性:可自定义设置,兼容您的个人策略 可测试性:可以回测并精确计算盈利 购买此产品可获得价值 $37 的赠品。 要了解如何设置该产品,请阅读此文章。
https://www.mql5.com/en/blogs/post/759779 我们的客服团队随时为您解答!

介紹 旨在解決以下問題的投資城堡指標創建:
1.在不同的時間範圍內確定趨勢的正確方向。
2.在圖表上顯示命中率,獲勝率。
3.該指標不會重新繪製圖表。
4.該指標內置在 Investment Castle EA 中。
*在網站上查看設置的文件,更新和更多信息: https://www.investmentcastle.com
免責聲明 應該清楚地將“ Investment Castle Indicator”和所有帶有其名稱的產品視為交易者可以用來支持其交易的工具。牢記這一點,該工具的效果或有效性完全取決於交易者的投入和/或優化。
強烈建議您,作為交易者,首先要完全熟悉投資城堡指標產品,首先要對模擬或試用帳戶中各種參數的輸入設置進行全面回測,然後再使用投資城堡指標。一個真實賬戶,以便體驗和理解每個參數集如何相互對應,以使投資城堡指標如交易員所設定的那樣起作用。
因此,無論是好是壞,交易者交易經驗的結果,都只是對交易者理解的純粹而直接的反映,並且具有優化和利用投資城堡指標所提供的廣泛功能的能力。
FREE
The Absorption & Exhaustion Detector Professional indicator is a sophisticated volume analysis tool designed to identify critical market turning points by analyzing the relationship between price movement and cumulative volume delta (CVD). This indicator helps traders spot when price movements lack volume confirmation, indicating potential absorption or exhaustion zones. KEY FEATURES Real-time Cumulative Volume Delta (CVD) calculation and normalization Price-volume divergence gap measurement dis

本指标是一款众所周知的 MetaTrader 4 指标,现直接免费在互联网上提供。它完全不会重绘。 它实现了一类突破策略。箭头指示行情的方向。在 M15 或更高时间帧里使用此指标。
FREE

Spline Searcher MT5 — 多货币价格样条与兴趣点早期探测指标 用于自动探测和可视化复杂价格形态初始阶段的辅助工具。本指标仅适用于手动交易,适合那些尝试在早期识别更复杂市场形态或趋势(其中可能包含更简单的形态)的交易者。指标可识别多达六种初始形态:远端或近端K线顶点的抛物线、带可调衰减的谐波振荡、线性波等。所有形态均根据精度、尺寸、持续时间和稳定性等标准进行评估。支持灵活的外观自定义以及高级搜索逻辑。 帮助您获取更多功能的链接 如果您希望: 获取 MetaTrader 4 版本的指标 提出问题或获取支持 本指标适合哪些人? 适合尝试早期发现有趣市场情境并愿意采用多种方法的交易者。 适合使用抛物线、谐波、艾略特波浪等进行分析,并希望在早期阶段自动可视化这些形态的分析师。 适合重视灵活性的用户:您可以开启/关闭形态类型,调整颜色、字体、声音和搜索精度,以匹配您的交易风格。 功能与优势 多形态分析 指标同时搜索 6 种形态:抛物线、谐波、线性波 — 每种均可独立配置。 个性化显示风格 每种形态均可配置主线颜色、辅助线颜色、标签、线宽及相对于价格的偏移。 文本标签与声音通知
FREE

"Envelope of Adaptive Moving Average" 指标是一种帮助您在金融市场做出明智决策的工具。它旨在为您提供清晰的趋势方向以及交易中可能的入场和出场点。
该指标基于自适应移动平均,这意味着它会自动调整以适应市场波动性的变化。这使其在既可能平静又可能波动的市场中特别有用。该指标显示两条包围自适应移动平均线的线条。这些线条有助于识别关键的支撑和阻力水平,从而使您更明智地决定何时买入或卖出资产。
尽管它是一种高级技术工具,但易于理解和使用,适用于新手和经验丰富的交易者。该指标能够适应不断变化的市场条件,使其在各种情况下都具备灵活性和有效性。它提供了市场趋势的清晰视觉表现,有助于避免冲动交易。该指标可以成为您交易工具箱中宝贵的工具。
FREE

1. Overview The Ichimoku Kinko Hyo (or Ichimoku Cloud) is a comprehensive, all-in-one technical analysis indicator designed to provide a deep understanding of market trends, momentum, and dynamic support and resistance levels. This indicator provides a clean, standard implementation of the five core Ichimoku lines. Its key feature is a non-intrusive Status Dashboard that gives you an at-a-glance summary of the current market situation according to the Ichimoku system, allowing for quick and effi
FREE

我们的 Basic Support and Resistance 指示器是提高技术分析所需的解决方案。该指标允许您在图表/ MT4版本
功能
斐波那契水平的集成: 可以选择显示斐波那契水平以及支持和阻力水平,我们的指标使您对市场行为和可能的逆转区域有更深入的了解。
性能优化: 只能在每个栏的打开时更新扩展线,我们的指标可确保最佳性能,而无需牺牲支持和阻力级别的准确性。
输入 主设置 Timeframe: 通过此输入,您可以选择在图表上显示较高时间范围的支撑线和阻力线。 Support/Resistance Strength [Number of Bars]: 使用此输入,您可以确定支撑和电阻的强度。数量越高,支持/阻力越强。 Price mode: 此参数允许您选择哪种价格将用于计算支持和电阻水平。它可以是收盘价,最高价格,最低价格等。取决于您的策略和偏好,您可以选择最适合您需求的价格。 显示设置 Display Fibonacci levels: 此参数确定是否将显示斐波那契水平以及图表上的支持和电阻级别。斐波那契水平是技术分析中使用的关键水平,并使用斐

Santa Trend Indicator is an efficient way to forecast and detect the trend in any market. Advantages Generates instant buy and sell signals. Provides an alternate exit strategy to your existing trading system. Never repaints, never backpaints, never recalculates. Works in all symbols and all timeframes. Perfect trend filter for any strategy or expert advisor. Fully compatible with Expert Advisor (EA) development. Does not lag.
FREE

ADR, AWR & AMR Indicator: Comprehensive Trading Guide Try "Average Daily Range Scalper":
https://www.mql5.com/en/market/product/154469 Core Concepts ADR (Average Daily Range) Definition : The average distance between daily high and low prices over a specified lookback period (typically 14-20 days) Purpose : Measures daily volatility expectations, identifies range-bound versus trending days, sets realistic intraday profit targets Key Insight : Markets tend to respect their average volatility - d
FREE

Candle Detector By Mahefa R. General Description Candle Detector is an advanced technical indicator for MetaTrader 5 , designed to automatically detect and highlight the most important Japanese candlestick patterns directly on the price chart .
It allows traders to quickly identify market reversal and continuation setups without visual clutter. The indicator recolors only the candles that match the selected pattern , ensuring a clear, accurate, and professional chart analysis . ️ How It Work
FREE

Description (English): Trend Test by Subho – Advanced Trend & Step Channel System Trend Test by Subho is a powerful all-in-one trend trading system designed to filter noise and provide clear market direction. This indicator combines two sophisticated algorithms: the Trend Test () and the Subho Step Channel into a single chart overlay. It also features a stylish Live Dashboard that alerts you to the current trend status in real-time. Key Features: Trend Test () Logic: An advanced tr
FREE

指标供需 RSJ PRO 计算并在图表上绘制“供应”和“需求”区域,识别区域类型(弱、强、已验证、已证明),并在区域重新测试的情况下显示它的次数被重新测试。 “供应”区是出现供大于求的价格区域,导致价格下跌。 “需求”区域是需求大于供应的价格区域,从而推高价格。
请务必尝试我们具有可配置功能和警报的专业版本: Suppy Demand RSJ PRO
区域分类 弱:价格区域,如果重新测试,可能会被违反。 强:价格区域已经改变了趋势方向,不太可能很快被重新测试。 已验证:强价区,最多有1-3次复测,但价格未能突破该区。 证明:强势价格区域,有3次或以上复测,但价格未能突破该区域。 Broken/Turncoat:被打破的价格区域,在支撑的情况下成为阻力,在阻力成为支撑的情况下。
设置 显示区域标签和信息:真实案例在区域的右侧写下区域类型和重新测试的次数(如果适用)。 注意:仅当图表偏移选项处于活动状态时才有效。 字体颜色:设置文本的颜色 字体大小:设置字体大小
如果您仍有疑问,请通过直接消息与我联系: https://www.mql5.com/zh/users/robsju

Indicator Name: CM EMA Trend Bars Overview: The CM EMA Trend Bars indicator is a straightforward yet effective tool that changes the color of price bars based on their relationship to the Exponential Moving Average (EMA). This visual cue helps traders quickly identify trend direction and potential trading opportunities. Key Features: Dynamic Bar Coloring: The indicator changes the color of the bars depending on whether they are above or below the EMA, providing a clear visual representation of t
FREE
用于二元期权的信号指标,也可以在外汇以及其他市场上高效使用。适合在 M1–M5 上进行短线网格交易,并包含逐步加仓的信号。 免费版本仅适用于 XAUUSD 货币对。MetaTrader 5 的完整版在这里: https://www.mql5.com/en/market/product/156185 该指标使用两级自适应机制:基础速度轮廓(从一开始就可设置为“快速/平滑”)以及基于交易结果的自动自适应,根据当前市场调整过滤器,并考虑连续获利和亏损信号的情况。 模型在图表上寻找短暂的定向脉冲,并在 K 线收盘时用 CALL(买入)和 PUT(卖出)箭头标记出来,不会重绘。该指标也可以用于传统的 Forex/CFD 账户,但由于持仓周期较短,务必控制点差和佣金,避免成本“吞噬”大部分价格波动。 工作原理 使用自有的多级自适应预测模型,而不是标准的经典指标组合; 分析价格运动的形态与斜率、趋势以及局部波动率; 通过多层噪音和异常波动过滤来分析信号; 只有在通过所有内部检查后才给出箭头信号:智能平滑、过滤逆趋势逻辑、自适应极值过滤器(尽量避免在可能的反转点给出信号)、以及在线自适应市场的轻量级神
FREE

O Indicador valida a força da tendência utilizando o volume negociado. Os candles são mostrados na cor verde indicando força compradora e cor vermelha na força vendedora. O movimento é encerrado pelo SAR parabólico. Vantagens: Filtra distorções de preço sem volume financeiro; Filtra consolidações e movimentos laterais; Filtra divergências de volume pelo indicador Money Flow. Desvantagens: Não filtra todos os falsos rompimentos, visto que rompimentos importantes geram altos volumes financeiros; N
FREE

Highly configurable Bollinger Bands indicator. Features: Highly customizable alert functions (at levels, crosses, direction changes via email, push, sound, popup) Multi timeframe ability Color customization (at levels, crosses, direction changes) Linear interpolation option Works on strategy tester in multi timeframe mode (at weekend without ticks also) Parameters:
Bollinger Bands Timeframe: You can set the lower/higher timeframes for Bollinger Bands. Bollinger Bands Bar Shift: Y ou can set th
FREE

[ How to use the Demo version ] [ MT4 Version ] AO unpaid divergences MT5 AO unpaid divergences is the first indicator developed to detailed analyze Regular and Hidden Divergences. It uses this analysis to find out possible entry points and targets. Below some of the characteristics of this indicator: Time saving Highly customizable Working for all pairs (Crypto, Forex, Stocks, Indices, Commodities...) Suitable for Scalping or Swing trading Possible reversal swings Alerts and Notifications on M

Trading Dashboard Pro: MetaTrader 5 专业交易指挥中心 将您的 MT5 终端升级为机构级交易工作站 Trading Dashboard Pro (交易仪表板专业版) 是专为职业交易员、自营公司(Prop Firm)挑战者和严肃的剥头皮交易者设计的综合风险管理和账户分析工具。通过将关键的市场数据、账户健康指标和历史绩效整合到一个优雅的界面中,它让您可以专注于最重要的事情:做出正确的交易决策。 为什么您需要这个仪表板? 1. 专为自营公司交易员设计 (FTMO, MFF 等)
自营交易公司对 每日回撤 (Daily Drawdown) 和 最大回撤 (Max Drawdown) 有极其严格的规则。
解决方案: 我们的仪表板专门跟踪并显示当前日和当前月的 Max DD (最大回撤)。您将立即知道您距离每日亏损限制还有多远,从而帮助您避免违规爆仓。 2. 专为剥头皮和日内交易者设计
当您在几分钟内频繁进出市场时,您没有时间切换到“历史”选项卡并手动汇总利润。
解决方案: “每日交易分析”部分即时更新,让您一目了然地看到“今天”

Mouse Calculation 通过鼠标指向的价位,快速计算每笔订单在该价位平仓的盈亏。 适用于网格、马丁、分批建仓等多订单持仓时快速决策。回本价、目标价位,一眼可见。 核心功能 Mouse PnL (M) :预览单笔与总计盈亏(含隔夜利息 swap)。 Break even Price (B) :显示组合回本价/盈亏平衡线。 Time_Sync_Lines (T) :对齐最近 N 天的同一时刻,便于对比走势;支持拖动复盘关键行情时刻。 Panel (P) :显示/隐藏控制面板。 About (A) :使用说明与信息入口。 图上显示说明 B / S :订单当前盈亏 M :按鼠标价位估算的“平仓盈亏” T :总计盈亏 最适合的交易场景 网格 :快速确定“篮子止盈位”。 马丁 :快速判断“反弹到哪能回本/转正”。 多订单持仓 :更直观地做减仓与调整。 参数 sync_lines :Time_Sync_Lines 的竖线数量(默认 8)
(其余输入项为颜色/显示风格设置,可按个人喜好调整。) 使用方法 加载到图表(按当前图表品种统计)。 按 M 打开 Mouse PnL (M) ,按
FREE
MetaTrader市场是一个简单方便的网站,在这里开发者可以出售自己的交易应用程序。
我们将帮助您发布您的产品,并向您解释如何为市场准备您的产品描述。市场上所有的应用程序都是加密保护并且只能在买家的电脑上运行。非法拷贝是不可能的。
您错过了交易机会:
- 免费交易应用程序
- 8,000+信号可供复制
- 探索金融市场的经济新闻
注册
登录