MetaTrader 5용 기술 지표 - 25

The indicator represents the session boxes for the Asian, European and American sessions. It is possible to change the time of each session, such as color. It is also possible to disable the display of each session. You will find in input parameters variables to modify in format hh:mm. In Colors tab you can change the color of boxes of each sessions. If you need some implementations please contact me.
FREE

Several assets in several markets have the behavior of using specific numbers as Force Numbers, where support, resistance and price thrust is created. Let this indicator draw those levels of support and resistance for you. You can also stack it to show different level of Prices! This technique is being used by Tape Readers and Order Flow traders all over the world for a long time. Give it a try. Challenge yourself to study new ways of Price Action!
SETTINGS
What Price reference to use in the c
FREE

The ADX Histogram is a modern and visual upgrade of the classic Average Directional Index (ADX) .
It transforms the standard ADX and DI+ / DI– values into a color-coded histogram , making trend analysis much clearer and faster. Key Features: Histogram with four states : Blue = Normal Buy Trend Green = Strong Buy Trend Orange = Normal Sell Trend Red = Strong Sell Trend Automatic strength detection : uses the ADX line to separate “normal” vs. “strong” signals. Fully customizable: ADX
FREE

This indicator is based on Bollinger Bands and moving averages, and uses ADX to get the turning point of the market trend and display a sign.
It is basically intended for use with currency pairs and futures with high volatility. In our tests we use it on XAUUSD, 5m and 15m. Win rate is more than 80% with 50 pips stop loss and 50 pips gain or more.
The indicator is also a simple indicator that allows you to enable or disable alerts and change the color of the arrows from the indicator settings
FREE
Dynamic Supply and Demand indicator automatically identifies and displays Supply and Demand Zones on your chart based on price action patterns and market structure. These zones represent areas where institutional buying or selling pressure has historically occurred, making them key levels for potential price reactions. This form of indicator takes inspiration from ICT as well as traditional Support & Resistance formation. **For the first 50 candles (number depends on LookBackCandles) when indic
FREE

Moving Average Convergence/Divergence — схождение/расхождение скользящих средних — технический индикатор, разработанный Джеральдом Аппелем (Gerald Appel), используемый в техническом анализе для проверки силы и направления тренда, а также определения разворотных точек. Встроенный в MetaTrader 5 индикатор MACD не соответствует задумке автора (Gerald Appel):
-линия MACD графически изображена в виде гистограммы, однако гистограммой отражается разница между линией MACD и сигнальной линией;
-сигнальн
FREE

Identification of support and resistance areas
A useful indicator for traders
completely free
Can be used in all symbols
Can be used in all time frames
It has three different trends: short term, medium term, long term
Settings:
Clr1,2: You can change the color of the lines
Type Trend: You can determine the trend
Message me for questions, criticism and suggestions
FREE

Mahdad Candle Timer 는 가볍고 정밀한 MetaTrader 5용 지표로, 현재 캔들이 마감될 때까지 남은 시간을 최신 봉 옆에 실시간으로 표시합니다. 스캘핑, 데이 트레이딩, 또는 스윙 트레이딩에서 캔들 확정을 기다리는 등 정확한 타이밍을 중시하는 트레이더에게 적합합니다. 주요 기능 정확한 카운트다운 – HH:MM:SS 형식으로 남은 시간 표시 (옵션: 밀리초) 동적 위치 조정 – 차트 확대/축소와 관계없이 항상 최신 캔들과 정렬 스마트 색상 적응 – 배경 및 캔들 방향(상승/하락)에 따라 텍스트 색상 자동 변경 사용자 알림 – 캔들 마감 X초 전에 사운드 또는 팝업 알림 제공 완전한 사용자 설정 – 글꼴, 크기, 색상, 새로고침 속도, 알람 설정 가능 가볍고 효율적 – CPU 사용 최소화, 다른 지표나 EA와 충돌 없음 ️ 입력 파라미터 Sow Milliseconds (true/false) Update Interval (ms) Bullish/Bearish C
FREE

super trend version is to help you to have real time view of market move it will help you to get a live view of current market buy signal line and arrow to help you understand batter the direction sell signal line and arrow to help you understand batter the direction trade what you see not what you think this is an simple and best trading tool for our traders of any market crypto gold
FREE
Zero Lag SMA for MT5 The Zero Lag SMA (ZLSMA) indicator for MT5 provides a variation of the Simple Moving Average (SMA) designed to minimize lag, offering traders a more responsive moving average that adjusts more quickly to price changes. This makes it useful for identifying potential trend reversals and key price levels in a timely manner.
If you want to see more high-quality products or order the development/conversion of your own products, visit my partners' website: 4xDev
Get 10% OFF on m
FREE

Dual Bollinger Session Channel MetaTrader 5 전문 고정 세션 볼린저 채널
실제 세션 데이터를 기반으로 가격 행동(price action), 돌파(breakout), 기관급 시장 구조 분석을 위해 설계되었습니다. 한정 특가: 본 인디케이터는 2026년 1월 15일 까지 또는 선착순 100회 다운로드 에 도달할 때까지, whichever occurs first, 무료 로 제공됩니다. 제품 개요 Dual Bollinger Session Channel 은 MetaTrader 5용 프로페셔널급 기술적 인디케이터로, 직전의 실제 거래 세션 (일간 또는 주간) 데이터만을 기반으로 두 개의 독립적인 볼린저 밴드 계산을 수행하여 고정된 통계적 가격 채널을 생성합니다. 기존의 볼린저 밴드가 새 캔들이 형성될 때마다 지속적으로 재계산되는 것과 달리, 본 인디케이터는 현재 활성 세션 전체 동안 모든 채널 레벨을 고정 하여 트레이더에게 거래 기간 내내 안정적이고 신뢰할
FREE

Free Session High Low Indicator for MetaTrader 5.
This indicator displays the High and Low levels
of a selected trading session.
Features:
Calculates session High and Low levels
Uses closed candles only (non-repainting)
Clean and simple visual display
Suitable for manual trading
Free version limitations:
- Single session
- No alerts
- No breakout logic
This free indicator is provided for educational purposes.
If you need:
Alerts
Multiple sessions
Breakout strategy
Expert Adv
FREE
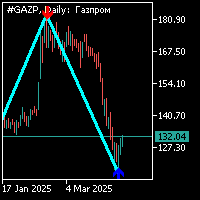
지그자그 표시기는 34 의 주기로 표준으로 추가 화살표 신호가 있습니다. 추가 신호는 지그재그 표시기와 별도로 계산됩니다.이 표시기에 대한 작업은 다음과 같습니다. 지그재그 표시기의 세그먼트를 형성하고 추가 화살표 신호가 나타날 때 화살표 방향으로 위치를 열어야합니다. 이전 팔의 상단에 있는 추가 신호(화살)의 반대 방향으로 지그자그 표시기의 다른 팔을 형성할 때,대기 중인 순서의 위치를 설정하는 것이 가능해집니다.3. 반대쪽 지그재그 어깨에서 추가 신호(화살표)로 형성이 완료되면 이전에 열린 위치에 추가하거나 정지 손실을 이 수준으로 이동할 수 있습니다;4. 보수적 인 거래 모드에서 거래하는 경우 가격 움직임의 첫 번째 철수 전에 추가 포지션을 열 수 없습니다. 정확하게 시장에 진입하려면 지그재그 표시기 세그먼트의 형성과 수석 시간대에 추가 신호의 출현을 기다릴 수 있으며 열린 위치에서 40 점보다 더 가까운 정지를 배치 할 수 있습니다. 6. 당신이 무역에 추가 위치를 추가 한

Trend Entry Indicator Your Trading will Be easier with this indicator!!! This Indicator is Developed To make our trading life easier. Get an Arrow for Entry with Take Profit and Slop Loss marks on chart. - Indicator is Based on trend, because thats what we all want we want to follow the trend "it's our friend". - Based on Levels, price action and oscillators. - It works on all currency pairs, all indices, metals and stock. - it works on all pairs/indexes on Deriv including Boom and Crash. - Tim

매수자-매도자 압력 지표는 M1부터 D1까지 다중 시간프레임에서 시장 심리를 표시합니다. 구성 가능한 기간 동안 이동평균 모멘텀 분석을 사용하여 매수 및 매도 압력 백분율을 계산합니다. 시각적 패널은 매수자 강세를 청록색으로, 매도자 우세를 빨간색으로 보여주는 진행 막대를 중요할 때 백분율 값과 함께 표시합니다. 각 시간프레임에는 상승추세, 하락추세 또는 횡보시장을 보여주는 방향 지표와 함께 ADX 추세 강도 측정이 포함됩니다. 횡보 기간(ADX 23 이하) 동안, 트레이더들은 지지 레벨에서 매수하고 저항 구간에서 매도하여 레인지 전략을 실행할 수 있습니다. 색상 코드 신호 점들은 최적 진입 타이밍을 위한 시장 조건의 빠른 시각적 확인을 제공합니다. 성공 메시지- 분석 완료! 전략적 거래 결정을 위한 다중 시간프레임 심리 데이터가 준비되었습니다.

Elliot Waves Analyzer Pro calculates Elliot Waves to Help Identify Trend direction and Entry Levels. Mainly for Swing Trading Strategies. Usually one would open a Position in trend direction for Wave 3 or a Correction for Wave C . This Indicator draws Target Levels for the current and next wave. Most important Rules for Elliot Wave Analysis are verified by the Indicator. The Pro version analyzes Multiple Timeframes and shows the Subwaves and Target-Levels. For an Overview " Elliot Waves Anal
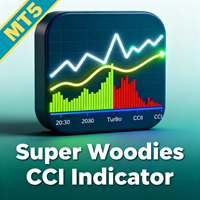
거래 정밀도를 향상시키기 위해 Super Woodies CCI Indicator MT5를 사용하세요. 이는 켄 우드의 유명한 Woodies CCI 시스템에서 영감을 받은 고급 모멘텀 오실레이터로, 2000년대 초반에 데이 트레이더들 사이에서 듀얼 CCI 접근으로 순환 패턴과 고확률 설정을 탐지하는 것으로 인기를 끌었습니다. 소매 및 기관 트레이더들에게 널리 채택된 이 지표는 강력한 추세 식별, 반전 pinpointing, 브레이크아웃 감지에 탁월하며, 연구에 따르면 컨플루언스 전략은 RSI, MACD, ADX와 같은 지표 간 합의를 요구함으로써 승률을 20-30%까지 향상시킬 수 있습니다. 이는 감정적 결정 만들기를 줄이고, 거짓 신호로부터 드로다운을 최소화하며, 변동성 환경에서 스캘핑, 데이 트레이딩 또는 스윙 포지션의 일관된 수익성을 강화합니다. Super Woodies CCI Indicator MT5는 색상 코딩된 히스토그램을 통해 컨플루언스를 시각화합니다: 강세 신호를 위한

- 심지 채우기 트렌드 개념
시장에서 변동성이 큰 이벤트 동안 양초는 이동 중에 심지를 만드는 경향이 있습니다. 촛대의 심지는 가격의 거부를 반영합니다. 이 심지는 대부분 그 방향으로 밀리는 큰 양이 있기 때문에 채워집니다. Wick Fill Trend는 트렌드 시장에 중점을 둔 기회를 스캔합니다.
진입 점과 함께 라이브 신호를 표시하고 이익을 얻고 손실을 막는 성공률 시뮬레이터 대시 보드가 있습니다. 이 성공률 시뮬레이터는 백 테스트로 사용하여 과거에 더 나은 수익을 가진 입력을 확인할 수 있습니다. 핍과 백분율의 이익을 계산하여 과거 성과를 기반으로 사용하기에 가장 적합한 매개 변수가 무엇인지 전체적으로 알 수 있습니다.
- 입력
- 트렌드 심지 :이 입력은 표시기가 스캔해야하는 심지의 크기를 결정합니다. %로 측정됩니다 %. 기본적으로 20 %입니다.
- 신호 수 : 성공률 시뮬레이터를 위해 스캔 할 신호 수입니다.
- 이동 평균 :이 필터는 이동 평균 표시기와 R
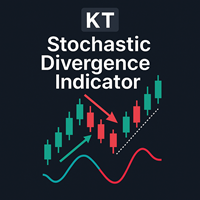
다이버전스는 시장에서 가격 반전을 나타내는 중요한 신호 중 하나입니다. KT Stoch Divergence는 가격과 스토캐스틱 오실레이터 사이에 형성된 정규 및 히든 다이버전스를 표시합니다.
KT Stoch Divergence의 한계
스토캐스틱 다이버전스를 단독 진입 신호로 사용하는 것은 위험할 수 있습니다. 모든 다이버전스가 강력한 반전을 의미하는 것은 아닙니다. 더 나은 결과를 위해 가격 행동 및 추세 방향과 함께 사용하는 것이 좋습니다.
기능
가격과 스토캐스틱 사이의 정규 및 히든 다이버전스를 시각적으로 표시합니다. 추세 반전 및 추세 지속 전략 모두에 적합합니다. EA(자동매매 시스템)에 통합 가능한 구조입니다. 비대칭 다이버전스는 정확도 향상을 위해 제외됩니다. 진입뿐 아니라 청산 신호로도 사용할 수 있습니다. 모든 MT 알림 기능을 포함합니다.
다이버전스란 정확히 무엇인가요? 일반적으로 가격이 고점을 갱신하면 오실레이터도 고점을 갱신해야 하고, 가격이 저점을 갱신하

KT Heiken Ashi Alert는 표준 Heiken Ashi 캔들에 기반하여 매수 및 매도 화살표를 표시하고 다양한 알림을 생성하는 유용한 트렌드 보조 도구입니다. Heiken Ashi를 거래 전략에 통합하고 싶은 트레이더에게 필수적인 도구입니다. Heiken Ashi가 하락 상태에서 상승 상태로 전환되면 매수 화살표가 표시됩니다. Heiken Ashi가 상승 상태에서 하락 상태로 전환되면 매도 화살표가 표시됩니다. 모바일 알림, 이메일, 사운드, 팝업 알림 모두 지원됩니다.
Heiken Ashi란? Heiken Ashi(平均足)는 일본어로 "평균 바"를 의미하며, 기존의 일본식 캔들보다 트렌드를 더 쉽게 파악할 수 있도록 설계된 차트 유형입니다. 이 캔들은 진입과 청산 전략 모두에 활용될 수 있으며, 색상이 바뀌면 종종 시장 방향의 전환을 의미합니다.
중요 포인트
Heiken Ashi Alerts를 단독으로 사용하는 것은 추천하지 않으며, 다른 보조 지표와 함께 사용하는
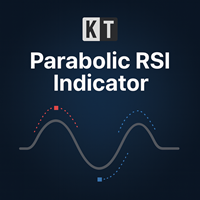
KT Parabolic RSI 는 RSI 선 위에 파라볼릭 SAR을 직접 중첩시켜 시장의 전환점을 더욱 명확하게 보여줍니다. 전통적인 RSI의 과매수와 과매도 구간은 이미 반전을 시사하지만, PSAR 필터를 추가하면 불필요한 노이즈가 제거되어 신호가 더욱 선명하고 신뢰할 수 있게 되며, 거래자가 더 확실한 매매 기회를 잡을 수 있습니다. 큰 사각형 신호: RSI가 과매수 또는 과매도 영역에 있을 때 발생하는 파라볼릭 SAR 전환. 이는 높은 확률로 시장 반전을 나타냅니다. 작은 사각형 신호: RSI가 중립 구간에 있을 때 발생하는 SAR 전환. 이는 확률이 낮은 신호로 간주되며, 부분 청산이나 기존 추세를 따라갈 때 유용합니다.
특징 RSI 모멘텀과 파라볼릭 SAR의 추세 전환을 하나의 오버레이에 결합하여 두 개의 인디케이터 창을 따로 관리할 필요가 없습니다. RSI 창에 나타나는 사각형 마커는 메인 가격 차트에도 동일하게 표시되어 가격 움직임을 보면서도 신호를 확인할 수 있습니다

It is the very same classic Stochastic indicator, but with a little twist: we changed the Signal Line with a 2-color line, so we can use it with EAs as a filtering system. And that's it! I know it could seem stupid but I needed that, so I created it. The original formula is right from Metaquote's chest, no additions, no subtractions, it is Stochastics in its core.
So I will not publish here the Stochastics parameters as they are all the same as always... Enjoy!
If you like this indicator, all I
FREE
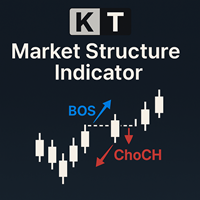
The KT Market Structure intelligently detects and displays Break of Structure (BOS) , Change of Character (CHoCH) , Equal Highs/Lows (EQL) , and various significant swing high/low points using our proprietary algorithm for accurate pattern detection. It also offers advanced pattern analysis by effectively demonstrating the captured profit for each pattern. A fully automated EA based on this indicator is available here: KT Market Structure EA MT5
Features
Accurate Pattern Detection: Our advance
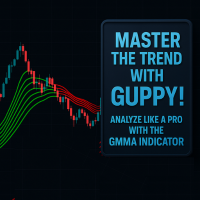
This is a custom Guppy-style Moving Average indicator built for MetaTrader 5 (MT5), designed to replicate the appearance and logic of the popular TradingView version. Unlike the built-in tools in MT5, this indicator offers a simplified yet powerful approach by using only 6 Exponential Moving Averages (EMAs). It provides clean visualization and accurate market layering to help traders make better decisions. Features
TradingView-Style Guppy Logic – Displays 6 EMAs for combined short- and medium-
FREE

Haven Fibonacci Volume Profiles — 자동 시장 범위 분석기 Haven Fibonacci Volume Profiles 를 소개합니다. 이는 시장 분석을 한 차원 높여주는 강력한 도구입니다. 이 지표는 중요한 피봇 포인트를 기반으로 구축된 핵심 가격 범위를 자동으로 식별하고, 각 범위에 상세한 볼륨 프로파일과 피보나치 레벨을 겹쳐 표시합니다. 이를 통해 트레이더는 유동성이 어디에 집중되어 있는지, 그리고 진정한 지지 및 저항 레벨이 어디에 위치하는지 즉시 파악할 수 있습니다. 다른 제품 -> 여기 . 어떤 범위가 유효한지 더 이상 추측할 필요가 없습니다. 이 지표는 과거 및 현재 가격 범위를 모두 표시하여 시장 상황에 대한 완전한 이해를 제공하며, 모든 복잡한 작업을 대신 처리해 줍니다. 주요 지표 기능 자동 범위 감지: 지표가 중요한 고점과 저점(피봇)을 자동으로 찾아 그 사이에 가격 범위를 구성합니다. 상세한 볼륨 프로파일: 각 범위에 대해 볼륨 프로파일이

Multi-Currency Strength Dashboard PRO MT5 (v2.6) – 시각적 대시보드를 포함한 통화 강도 지표 Multi-Currency Strength Dashboard PRO 는 MetaTrader 5 용 지표로, 8개 주요 통화 (USD, EUR, GBP, JPY, CHF, CAD, AUD, NZD)의 상대적 강도를 실시간으로 계산하며, 최대 28개 Forex 통화쌍 (브로커에서 제공하는 심볼에 따라 다름)을 분석합니다. 이 도구의 목적은 통화 강도/약세를 빠르고 구조적으로 보여주어, 분석할 통화쌍 선택 (강한 통화 vs 약한 통화)에 도움을 주고, 강도 차이가 작은 조합을 필터링하기 쉽게 만드는 것입니다. 주요 기능 차트 내 시각적 대시보드 (0–100 정규화 스케일의 강도 바 표시). 최대 28개 통화쌍 분석 (자동 리스트 생성, 필요 시 브로커 접미사 지원). Best Pairs (주목 페어) : 설정 가능한 최소 강도 차이를 기준으로 표시. Wors
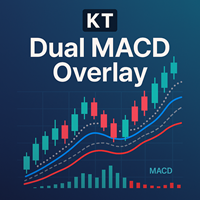
KT Dual MACD Overlay는 현재 시간대와 상위 시간대의 두 MACD 오실레이터를 가격 차트에 직접 겹쳐 표시합니다. 빠른 MACD는 단기 모멘텀을 포착하고, 느린 MACD는 더 큰 추세와의 일관성을 유지합니다. 두 MACD가 캔들 위에 겹쳐 표시되므로 창을 전환하지 않고도 시장 모멘텀을 완벽히 파악할 수 있습니다.
매수 진입
주 매수 진입: 상승 추세가 시작될 때 파란색 세로선이 나타납니다. 추가 매수: 빠른 MACD가 시그널선을 상향 돌파하고, 느린 MACD와 주요 상승 추세가 이를 확인할 때 발생합니다. 매도 진입 주 매도 진입: 하락 추세가 시작될 때 주황색 세로선이 나타납니다. 추가 매도: 빠른 MACD가 시그널선을 하향 돌파하고, 느린 MACD와 주요 하락 추세가 이를 확인할 때 발생합니다.
특징 빠른 MACD와 느린 MACD를 동시에 활용해 단일 MACD보다 완성도 높은 시스템 제공. 추세 시작 지점을 세로선으로 명확하게 표시. 주 진입을 놓쳐도 여러 번

Place price Alerts on extended Rectangles and Trendlines - Risk reward indicator MT5 Extend Rectangles & Trendlines to the right edge Mark your supply demand zones with extended rectangle and draw support resistance lines with extended trendline. Find detailed manuals here . Find contacts on my profile . MT4 Rectangle extender indicator will simplify and make it easier for you to analyze markets and stay notified about important events. When you extend rectangle or trendline the action butt

All traders should know the trend before making their decision when placing the buy or sell orders. The first step always starts with supply and demand , rising and falling channels , trend lines, engulfing candles etc. All the above contribute to what is called “Price Action” and that is the best and most reliable way in trading and catching the trend and making profits, without stress. The Investment Castle Trend Line Indicator will automatically draw the trend lines on the MT5 for you.
FREE

El indicador técnico Trend Magic es una herramienta de análisis de tendencias que combina el Índice de Canal de Mercancía (CCI) y el Rango Verdadero Medio (ATR) para identificar la dirección de la tendencia del mercado. Aquí tienes un resumen de sus pros y contras, así como las mejores condiciones del mercado para su uso:
Pros: - Identificación clara de la tendencia: Cambia de color para indicar tendencias alcistas (azul) y bajistas (rojo), lo que facilita la visualización de la dirección del
FREE

Cycle Sniper MT5 Cycle Sniper MT4 Version and definitions : https://www.mql5.com/en/market/product/51950 Important Notes: MT5 Version does not include Breakout Mode and Late Entry Mode Features.
MT5 Version does not include RSI and MFI filter. **Please contact us after your purchase and we will send you the complimentary indicators to complete the system.**
This indicator does not send any signal without a reason...You can observe and analyze the indicator and the signals it sends Cycle Sni

이 지표는 클래식 MACD와 지그재그 지표를 결합하여 가격과 지표 간의 차이를 감지합니다. 또한 첨단 인공지능(AI) 기술을 사용해 발산의 타당성을 탐지한다.
MACD는 '지표의 왕'으로 알려져 있으며 지그재그도 매우 유용한 지표입니다. 이 두 지표를 결합함으로써 이 지표는 두 지표의 장점을 모두 활용합니다.
발산의 탐지는 확률론적 문제이다. 종종 차이가 발생하고 이어서 같은 방향으로 가격이 추가로 이동하는 경우가 있습니다. 따라서 우리는 고급 AI 기술을 사용하여 발산의 유효성을 판단하고 유효하지 않은 발산을 필터링한 다음 다양한 방법으로 사용자에게 경고하려고 합니다. 할인 가격:59$ 특징 * MACD 형식의 지그재그 표시기 * 가격과 MACD 지표 간의 차이를 감지합니다. * AI 기술을 사용하여 발산의 타당성을 감지합니다. * 사용자에게 발산 신호를 경고합니다. * 휴대폰을 통해 사용자에게 발산 신호를 경고합니다. * 이메일을 통해 사용자에게 발산 신호를 경고합니다. *

FlatBreakout MT5 (Free Version) Flat Range Detector and Breakout Panel for MT5 — GBPUSD Only FlatBreakout MT5 is the free version of the professional FlatBreakoutPro MT5 indicator, specially designed for flat (range) detection and breakout signals on the GBPUSD pair only.
Perfect for traders who want to experience the unique fractal logic of FlatBreakout MT5 and test breakout signals on a live market without limitations. Who Is This Product For? For traders who prefer to trade breakout of
FREE

You can configure to show multiple take profit targets based on the current price all based on volatility; I personally use it every day with an script to automate my entries; For example if i want to stop out for 4 volatility level and use an take profit of 10 volatility based on the 2 minutes of the previous 20 bars i can do it with this indicator; You can configure multiple take and multiple stops with different names to show in your symbol, all take profit and stop losses in this indicator i
FREE

Bollinger bands out/in strategy A strategy created by Joe Ross, and very useful for finding trades when the market is overloaded. Indicator You don't need to find where there are entries on the chart, this indicator shows them for you. The entrance The trade is confirmed when the price closes outside the bollinger bands on a candle and the candle after the price closes inside the bands. comment I want to improve this indicator, so you can help me sending me your reviews and comments, thanks :).
FREE

Highly configurable Williams %R indicator. Features: Highly customizable alert functions (at levels, crosses, direction changes via email, push, sound, popup) Multi timeframe ability Color customization (at levels, crosses, direction changes) Linear interpolation and histogram mode options Works on strategy tester in multi timeframe mode (at weekend without ticks also) Adjustable Levels Parameters:
Williams %R Timeframe: You can set the current or a higher timeframes for Williams %R. Williams
FREE
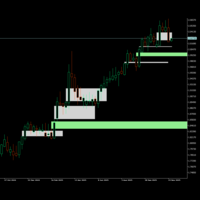
If you like this product, please give it a 5 star rating as a token of appreciation.
This indicator identifies and displays Fair Value Gaps (FVG) on price charts.
Fair Value Gaps are price zones where there's a significant imbalance between buying and selling pressure, creating "gaps" in price action. The indicator detects two types and when they are mitigated(touched):
Bullish FVG: When a candle's low is above the high of a candle two periods earlier.
Bearish FVG: When a candle's high is bel
FREE

TransitTrendlines this is a automatically trendline drawer, it draw both horizontal and diagonal trendlines. The horizontal trendlines are the pivot points of the day timeframe and the diagonal trendlines are based on the current time frames. You can adjust the diagonal trendlines by increasing the number of bars to draw the diagonal trendline and can also adjust the steepness. Note that the Horizontal trendlines are based on the day pivot points not currant time frame. Join mql5 transitbk98 cha
FREE

Hull Suite by Riz | MT5 Indicator Overview: Hull Suite is a premium trend-following indicator that combines three powerful Hull Moving Average variations (HMA, EHMA, THMA) into one versatile tool. Designed for traders who demand clarity and precision, this indicator helps identify trend direction with minimal lag while filtering out market noise. Key Features: Three Hull Variations – Switch between HMA (classic), EHMA (exponential smoothing), and THMA (triple weighted) to match your trading styl
FREE
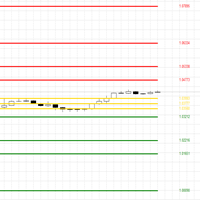
The CPR (Central Pivot Range) Indicator is a powerful technical analysis tool designed to identify key support and resistance levels on your MetaTrader 5 charts. It calculates the Central Pivot (CP) as the average of the previous day's high, low, and close prices, providing a central reference point. Calculates and plots 11 pivot levels (CP, BC, TC, S1-S4, R1-R4) Adjustable lookback period (default: 5 days) Option to show or hide price labels with customizable size and offset Fully customizable
FREE

Market Trading Sessions is an indicator that identifies major market sessions such as:
London (09:00 - 18:00 UTC+2) New York (15:00 - 00:00 UTC+2) Sydney (23:00 - 8:00 UTC+2) Tokyo (02:00 - 11:00 UTC+2)
It displays each session’s start and end times, along with its high and low, providing traders with a clearer view of price volatility throughout the day. The indicator offers high customizability, allowing you to adjust session times and modify the plotting style to match your preference.
If yo
FREE
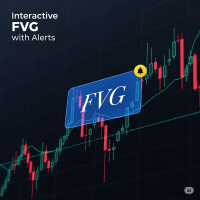
FVG Indicator with Alerts Description: This is a simple and effective indicator for identifying and displaying Fair Value Gaps (FVGs) on any timeframe. The indicator helps you see important price imbalances and provides powerful interactive tools for your analysis. Key Features: Detects FVGs: Clearly identifies and draws boxes around Bullish and Bearish Fair Value Gaps. Midline Level: Displays the 50% equilibrium level inside each FVG box, a critical point of interest. Complete Alert System: Rec
FREE

피닉스 스프레드 패널 (MT5)
MetaTrader 5용 실시간 스프레드 모니터링 패널. 차트에 현재 매수/매도 스프레드를 포인트 단위로 표시합니다.
목적
스프레드 확대는 거래 손실의 가장 간과되기 쉬운 원인 중 하나입니다. 유동성이 낮은 시기, 롤오버, 뉴스 이벤트 또는 변동성이 큰 상황에서는 스프레드가 급격히 확대되어, 그렇지 않으면 유효한 거래를 순식간에 손실로 전환시킬 수 있습니다.
피닉스 스프레드 패널은 스프레드 비용을 지속적으로 실시간으로 가시화하여, 트레이더가 포지션 진입 또는 관리 전에 정보에 기반한 실행 결정을 내릴 수 있도록 합니다. 패널은 자동으로 업데이트되며 모든 심볼 유형과 호환됩니다.
설치 방법
MQL5 마켓에서 다운로드하여 원하는 차트에 부착하세요. 패널은 즉시 표시되며 별도의 설정이 필요하지 않습니다.
요구 사항
MetaTrader 5 빌드 3280 이상. 이 지표는 모든 브로커 및 심볼과 호환됩니다.
피드백 및 리뷰
본 도구가 유용하다
FREE

UT Bot Alerts is a technical indicator for MetaTrader 5 that highlights potential directional changes based on momentum conditions.
The indicator marks signal points directly on the chart and can generate optional notifications for convenience. The signal generation logic can operate in two modes: Closed-bar mode: signals are confirmed only after the bar closes. Live-bar mode: signals are displayed during the formation of the current bar. Both modes are available depending on the user's preferr
Support Resistance Channel MT5 The Support Resistance Channel MT5 indicator plots dynamic support and resistance levels based on a configurable lookback period, displaying them as green and red lines respectively. It optionally shows goldenrod-colored arrows when price touches these levels, indicating potential trend changes (not explicit buy/sell signals) , along with customizable "RES" and "SUP" labels. With adjustable parameters like lookback period, arrow size, and label offset, it offers t
FREE

Moving Average RAINBOW Forex traders use moving averages for different reasons. Some use them as their primary analytical tool, while others simply use them as a confidence builder to back up their investment decisions. In this section, we'll present a few different types of strategies - incorporating them into your trading style is up to you! A technique used in technical analysis to identify changing trends. It is created by placing a large number of moving averages onto the same chart. When a
FREE

RiskKILLER_AI Navigator는 AI 기반의 다중 시간대 시장 방향 및 전략 어시스턴트입니다. 트레이딩 성과는 프로처럼 시장을 이해하는 데 있습니다. 그것이 바로 RiskKILLER_AI Navigator 가 제공하는 것입니다: MQL5 외부 에서 작동하는 AI 기반 트렌드, 심리, 거시 분석을 통해 여러분의 트레이딩 스타일에 맞춰진 기관 수준의 인사이트를 얻으세요. 구매 후 사용자 설명서를 받으려면: 1. 설명서를 요청하는 댓글 을 게시 2. 저에게 쪽지 를 보내주세요. [ 전용 그룹 | 버전 MT5 - MT4 ]
핵심 이점 여러 시간대와 자산에 걸친 실시간 시장 방향 거시 지표, 뉴스, 심리에 대한 AI 기반 분석 여러분의 트레이딩 스타일(수동 또는 자동)에 기반한 맞춤형 조언 RiskKILLER_AI Expert Advisor (EA)와의 직접적인 시너지
주요 기능 AI 기반 글로벌 트렌드 대시보드 - 주요 FX 쌍과 BTCUSD에 대해 M1부터 D1까지의 시장

Smart Trend pro New - Advanced Trend Indicator with Interactive GUI Professional trend-following indicator with comprehensive visualization and control panel Key Features: Advanced Trend Detection Reliable Half Trend algorithm for precise trend identification Color-coded trend lines (Blue for bullish, Orange for bearish) Customizable amplitude parameter for different trading styles Interactive GUI Panel Real-time market strength visualization (Bulls vs Bears) Current signal display (Buy/Se
FREE

Investment Castle Support and Resistance Indicator has the following features: 1. Dictates the direction of Buy or Sell trades based on Support and Resistance Levels automatically . 2. Candles stick colors will change to Red for Sell and Blue for Buy (Default settings, user can change from the inputs). 3. This indicator is built-in the Support & Resistance based Investment Castle EA which works with Psychological Key Levels "Support & Resistance".
FREE

This indicator draws regular bullish and bearish divergences in real-time onto the charts. The algorithm to detect those divergences is based on my 10+ years experience of detecting divergences visually. The divergences are drawn as green and red rectangles on the charts. You can even do forward testing in the visual mode of the strategy tester. This FREE Version is restricted to EURUSD and GBPUSD. The full version without restrictions is here: https://www.mql5.com/en/market/product/42758
Para
FREE
TW Volume Signal Pro MT5는 첨단 AI 기술과 독자적인 스마트 알고리즘을 활용하여 금 시장에서 보다 자신 있게 거래할 수 있도록 해주며, 독특하고 탁월한 거래 경험을 제공합니다.
금 시장에서 높은 정확도와 뛰어난 거래 신호를 찾고 계신가요? TW Volume Signal Pro MT5와 함께라면 전문 트레이더가 되어 금 시장에서 큰 성공을 거둘 수 있습니다. 지금 무료로 체험해보세요!
TW Volume Signal Pro MT5의 주요 기능: 고정된 TP 및 SL을 포함한 정확한 신호 시장 추세 변화의 빠른 감지 진입 및 청산에 대한 실시간 알림 세 가지 수익 목표를 통한 리스크 관리 안전 구역 내 자동 손절 설정 완전한 사용자 맞춤 설정 가능 차트 옆에 신호 히스토리 표시 금 및 외환 시장에서 뛰어난 성능 스캘퍼(M5 및 M15)에 적합 전략 테스터에서 테스트 가능 이 제품을 선택해야 하는 이유:
높은 정확도: 정밀하고 변하지 않는 신호 사용 편의성: 간단

Investment Castle Indicator has the following features: 1. Dictates the direction of the trend in different Timeframes . 2. Shows the hit rate and winning rate on the chart. 3. This indicator does not repaint the chart. 4. This indicator is built-in the Support & Resistance based Investment Castle EA which works with Psychological Key Levels "Support & Resistance" Indicator.
FREE
The Absorption & Exhaustion Detector Professional indicator is a sophisticated volume analysis tool designed to identify critical market turning points by analyzing the relationship between price movement and cumulative volume delta (CVD). This indicator helps traders spot when price movements lack volume confirmation, indicating potential absorption or exhaustion zones. KEY FEATURES Real-time Cumulative Volume Delta (CVD) calculation and normalization Price-volume divergence gap measurement dis

This indicator is a straight port of a well known MetaTrader 4 indicator that is freely available on the Internet. It does not redraw at all. It implements a type of breakout strategy. The arrows indicate market direction. Use the indicator on M15 charts and higher. The indicator draws two bands near price action and generates signals when the price closes below the lower band and also above the upper band. The indicator uses periodic highs and lows to calculate upper and lower threshold bands.
FREE

Spline Searcher MT5 — 가격 스플라인 및 관심 지점의 조기 탐지를 위한 다중 통화 지표 복잡한 가격 형성의 초기 단계를 자동으로 탐지하고 시각화하는 보조 도구입니다. 이 지표는 오직 수동 트레이딩을 위해 설계되었으며, 더 복잡한 시장 형상이나 트렌드(그 구성 요소로 단순한 형성이 포함될 수 있음)를 조기에 포착하려는 트레이더에게 적합합니다. 최대 6가지 유형의 초기 형상을 탐지합니다: 원격 캔들과 근접 캔들에 정점이 있는 포물선, 감쇠 조절이 가능한 조화 진동, 선형 파형 등입니다. 모든 형상은 정확도, 크기, 지속 시간, 견고성 기준에 따라 평가됩니다. 외관에 대한 유연한 사용자 정의와 고급 검색 로직이 제공됩니다. 추가 기능을 얻는 데 도움이 되는 링크 다음과 같은 목적이 있으신 경우: MetaTrader 4용 지표 버전 질문하거나 지원받기 이 지표는 누구를 위한 것인가요? 흥미로운 시장 상황을 조기에 탐지하고 다양한 접근법을 시도하고자 하는 트레이더용입니다.
FREE

"Adaptive Moving Average Envelope" 지표는 금융 시장에서 현명한 결정을 돕는 도구입니다. 이 지표는 트레이딩에서의 트렌드 방향과 가능한 진입 및 이탈 포인트를 명확하게 제시하기 위해 설계되었습니다.
이 지표는 시장 변동성의 변화에 자동으로 적응하는 적응형 이동 평균을 기반으로 합니다. 이는 고요한 시장에서부터 변동성이 큰 시장까지 모두 유용하게 사용할 수 있습니다. 이 지표는 적응형 이동 평균을 둘러싼 두 개의 선을 표시합니다. 이러한 선은 중요한 서포트 및 저항 수준을 식별하는 데 도움을 주며, 자산을 언제 사고 팔아야 하는지에 대한 더 현명한 결정을 내릴 수 있도록 합니다.
고급 기술적인 특성을 가진 이 지표임에도 불구하고, 이해하고 사용하기 쉬워 초보자와 숙련 트레이더 모두에게 적합합니다. 이 지표의 시장 조건에 자동으로 적응하는 능력은 다양한 상황에서 다재다능하고 효과적이라고 할 수 있습니다. 시장 트렌드를 명확하게 시각화하여 충동적인 거래를 피
FREE

1. Overview The Ichimoku Kinko Hyo (or Ichimoku Cloud) is a comprehensive, all-in-one technical analysis indicator designed to provide a deep understanding of market trends, momentum, and dynamic support and resistance levels. This indicator provides a clean, standard implementation of the five core Ichimoku lines. Its key feature is a non-intrusive Status Dashboard that gives you an at-a-glance summary of the current market situation according to the Ichimoku system, allowing for quick and effi
FREE

우리의 Basic Support and Resistance 표시기는 기술 분석을 향상시키는 데 필요한 솔루션입니다.이 표시기는 차트/ MT4 버전
특징
피보나치 수준의 통합 : 지원 및 저항 수준과 함께 피보나치 수준을 표시하는 옵션과 함께, 우리의 지표는 시장 행동과 가능한 역전 영역에 대한 더 깊은 통찰력을 제공합니다.
성능 최적화 : 각 막대의 개구부에서만 확장 라인을 업데이트하는 옵션을 사용하여, 우리의 지표는 지원 및 저항 수준의 정확도를 희생하지 않고 최적의 성능을 보장합니다.
입력 주요 설정 Timeframe: 이 입력을 통해 차트에 더 높은 기간의 지지선과 저항선을 표시하도록 선택할 수 있습니다. Support/Resistance Strength [Number of Bars]: 이 입력을 사용하면 지지대와 저항의 강도를 결정할 수 있습니다.숫자가 높을수록지지/저항이 더 강해집니다. Price mode: 이 매개 변수를 사용하면 지원 및 저항 수준을

Santa Trend Indicator is an efficient way to forecast and detect the trend in any market. Advantages Generates instant buy and sell signals. Provides an alternate exit strategy to your existing trading system. Never repaints, never backpaints, never recalculates. Works in all symbols and all timeframes. Perfect trend filter for any strategy or expert advisor. Fully compatible with Expert Advisor (EA) development. Does not lag.
FREE

ADR, AWR & AMR Indicator: Comprehensive Trading Guide Try "Average Daily Range Scalper":
https://www.mql5.com/en/market/product/154469 Core Concepts ADR (Average Daily Range) Definition : The average distance between daily high and low prices over a specified lookback period (typically 14-20 days) Purpose : Measures daily volatility expectations, identifies range-bound versus trending days, sets realistic intraday profit targets Key Insight : Markets tend to respect their average volatility - d
FREE

Candle Detector By Mahefa R. General Description Candle Detector is an advanced technical indicator for MetaTrader 5 , designed to automatically detect and highlight the most important Japanese candlestick patterns directly on the price chart .
It allows traders to quickly identify market reversal and continuation setups without visual clutter. The indicator recolors only the candles that match the selected pattern , ensuring a clear, accurate, and professional chart analysis . ️ How It Work
FREE

Description (English): Trend Test by Subho – Advanced Trend & Step Channel System Trend Test by Subho is a powerful all-in-one trend trading system designed to filter noise and provide clear market direction. This indicator combines two sophisticated algorithms: the Trend Test () and the Subho Step Channel into a single chart overlay. It also features a stylish Live Dashboard that alerts you to the current trend status in real-time. Key Features: Trend Test () Logic: An advanced tr
FREE

지표 공급 수요 RSJ PRO는 그래프에 "공급" 및 "수요" 영역을 계산하고 표시하여 영역 유형(약함, 강함, 확인됨, 입증됨)을 식별하고 영역을 다시 테스트하는 경우 몇 번인지 보여줍니다. 재시험했다. "공급" 구역은 수요보다 공급이 더 많이 발생하여 가격을 낮추는 가격 구역입니다. "수요" 구역은 공급보다 많은 수요가 발생하여 가격을 상승시키는 가격 구역입니다.
구성 가능한 기능 및 경고가 포함된 전문가용 버전을 사용해 보십시오: Suppy Demand RSJ PRO
구역 분류 약함: 다시 테스트할 경우 위반될 가능성이 있는 가격 영역입니다. 강함: 추세의 방향을 변경했고 그렇게 빨리 재시험될 가능성이 없는 가격 영역. 검증됨: 최대 1~3번의 재테스트가 있었지만 가격이 해당 영역을 깰 수 없는 강한 가격 영역. 입증됨: 3회 이상의 재시험이 있었지만 가격이 해당 지역을 돌파하지 못한 강한 가격 영역. Broken/Turncoat: 지지의 경우 저항이 되고 지지의 경우

Indicator Name: CM EMA Trend Bars Overview: The CM EMA Trend Bars indicator is a straightforward yet effective tool that changes the color of price bars based on their relationship to the Exponential Moving Average (EMA). This visual cue helps traders quickly identify trend direction and potential trading opportunities. Key Features: Dynamic Bar Coloring: The indicator changes the color of the bars depending on whether they are above or below the EMA, providing a clear visual representation of t
FREE

바이너리 옵션용 신호 인디케이터로, Forex 및 기타 시장에서도 효과적으로 사용할 수 있습니다. M1–M5 구간의 단기 그리드 트레이딩에 적합하며, 포지션을 단계적으로 늘려 가기 위한 신호를 포함합니다. 무료 버전은 XAUUSD 통화쌍에서만 작동합니다. MetaTrader 5용 전체 버전은 아래에서 확인할 수 있습니다. https://www.mql5.com/en/market/product/156185 인디케이터는 2단계 적응 방식을 사용합니다. 첫 번째는 기본 속도 프로파일(시작 시점부터 “빠르게/부드럽게”를 설정)이고, 두 번째는 거래 결과에 기반한 자동 적응으로, 승리 및 손실 신호의 연속을 고려하여 현재 시장에 맞게 필터를 조정합니다. 모델은 차트에서 짧은 방향성 임펄스를 탐지하고, 바가 마감될 때 CALL(매수) 및 PUT(매도) 화살표로 표시하며, 리페인트는 발생하지 않습니다. 클래식 Forex/CFD 계좌에서도 사용할 수 있지만, 거래 기간이 짧기 때문에 스프레드와 수수
FREE

O Indicador valida a força da tendência utilizando o volume negociado. Os candles são mostrados na cor verde indicando força compradora e cor vermelha na força vendedora. O movimento é encerrado pelo SAR parabólico. Vantagens: Filtra distorções de preço sem volume financeiro; Filtra consolidações e movimentos laterais; Filtra divergências de volume pelo indicador Money Flow. Desvantagens: Não filtra todos os falsos rompimentos, visto que rompimentos importantes geram altos volumes financeiros; N
FREE

Highly configurable Bollinger Bands indicator. Features: Highly customizable alert functions (at levels, crosses, direction changes via email, push, sound, popup) Multi timeframe ability Color customization (at levels, crosses, direction changes) Linear interpolation option Works on strategy tester in multi timeframe mode (at weekend without ticks also) Parameters:
Bollinger Bands Timeframe: You can set the lower/higher timeframes for Bollinger Bands. Bollinger Bands Bar Shift: Y ou can set th
FREE

[ How to use the Demo version ] [ MT4 Version ] AO unpaid divergences MT5 AO unpaid divergences is the first indicator developed to detailed analyze Regular and Hidden Divergences. It uses this analysis to find out possible entry points and targets. Below some of the characteristics of this indicator: Time saving Highly customizable Working for all pairs (Crypto, Forex, Stocks, Indices, Commodities...) Suitable for Scalping or Swing trading Possible reversal swings Alerts and Notifications on M

Trading Dashboard Pro: 최고의 MT5 트레이딩 지휘 본부 당신의 터미널을 전문 트레이딩 스테이션으로 업그레이드하세요 Trading Dashboard Pro 는 단순한 지표가 아닙니다. 전문 트레이더와 프랍 트레이딩(Prop Firm) 도전자를 위해 설계된 종합 리스크 관리 및 계좌 분석 유틸리티입니다. 중요한 시장 데이터와 계좌 상태를 하나의 우아한 인터페이스로 통합합니다. 이 대시보드가 필요한 이유 1. 프랍 트레이딩 (FTMO, MFF 등) 도전자
프랍 회사들은 일일 드로다운(Daily Drawdown) 에 대해 엄격한 규칙을 가지고 있습니다.
솔루션: 우리 대시보드는 오늘과 이번 달의 최대 드로다운(Max DD) 을 추적하여 표시합니다. 일일 손실 한도에 얼마나 근접했는지 즉시 알 수 있습니다. 2. 스캘퍼 및 데이 트레이더
솔루션: 일일 거래 분석 섹션은 "오늘"과 "어제"의 순이익, 거래 랏(Lot) 수, 총 거래 횟수를 한눈에

Mouse Calculation은 마우스로 가리킨 가격에서 청산한다고 가정했을 때, 각 주문의 손익을 빠르게 계산해 줍니다. 그리드, 마틴, 분할 진입 등 다수 주문 운용 시 빠른 의사결정에 적합합니다. 손익분기 가격과 목표 가격을 한눈에 확인할 수 있습니다. 핵심 기능 Mouse PnL (M) : 주문별/총 손익 미리보기(스왑 swap 포함). Break even Price (B) : 전체 포지션의 손익분기 가격/라인 표시. Time_Sync_Lines (T) : 최근 N일의 동일한 시각을 맞춰 비교; 드래그로 핵심 구간 복기. Panel (P) : 패널 표시/숨김. About (A) : 사용 안내 및 정보. 차트 표시 안내 B / S : 주문의 현재 손익 M : 마우스 가격 기준 “해당 가격 청산 시 손익” 추정 T : 총 손익 추천 사용 시나리오 그리드 : 바스켓 익절 구간을 빠르게 결정. 마틴 : 손익분기/플러스 전환에 필요한 반등 범위를 빠르게 확인. 다수 주문 : 부분 청
FREE
MetaTrader 마켓은 과거 데이터를 이용한 테스트 및 최적화를 위해 무료 데모 거래 로봇을 다운로드할 수 있는 유일한 스토어입니다.
어플리케이션의 개요와 다른 고객의 리뷰를 읽어보시고 터미널에 바로 다운로드하신 다음 구매 전 트레이딩 로봇을 테스트해보시기 바랍니다. 오직 MetaTrader 마켓에서만 무료로 애플리케이션을 테스트할 수 있습니다.
트레이딩 기회를 놓치고 있어요:
- 무료 트레이딩 앱
- 복사용 8,000 이상의 시그널
- 금융 시장 개척을 위한 경제 뉴스
등록
로그인
계정이 없으시면, 가입하십시오
MQL5.com 웹사이트에 로그인을 하기 위해 쿠키를 허용하십시오.
브라우저에서 필요한 설정을 활성화하시지 않으면, 로그인할 수 없습니다.