TRIXs
- Indicadores
- Versión: 1.0

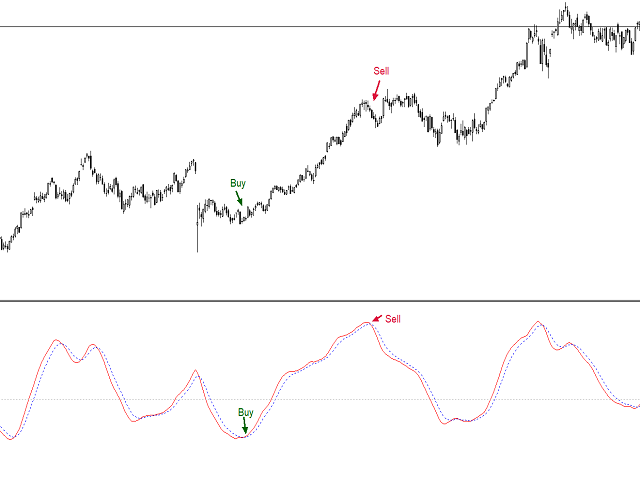
El indicador TRIXs es la combinación del indicador TRIX (Media Móvil Exponencial Triple) con el añadido de una señal SMA (Media Móvil Simple). Proporciona señales de continuidad de tendencia y de inicio de una nueva tendencia.
Los puntos de entrada y salida de las operaciones se producen cuando se cruzan las curvas del indicador.
Funciona mejor cuando se combina con otros indicadores.


Excelente!!!