YouTube'dan Mağaza ile ilgili eğitici videoları izleyin
Bir alım-satım robotu veya gösterge nasıl satın alınır?
Uzman Danışmanınızı
sanal sunucuda çalıştırın
sanal sunucuda çalıştırın
Satın almadan önce göstergeyi/alım-satım robotunu test edin
Mağazada kazanç sağlamak ister misiniz?
Satış için bir ürün nasıl sunulur?
MetaTrader 5 için teknik göstergeler - 25
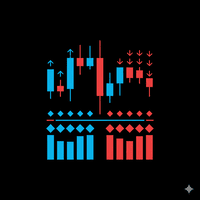
TrendPower All-In-One Strict v1.00 Description TrendPower All-In-One Strict is a comprehensive trend-following trading system designed for MetaTrader 5. It acts as a "confluence detector," meaning it filters market noise by requiring multiple technical indicators to agree before generating a signal. The indicator utilizes a "Strict" logic engine, meaning a signal is only generated when momentum, trend direction, and volatility filters all align perfectly. It displays data in a separate sub-win

The indicator draws daily support and resistance lines on the chart, as well as the Pivot level (reversal level).
Adapted to work in MT5
The standard timeframe for calculating support and resistance levels is D1. You can choose other timeframes according to your strategy (for example, for M1-M15, the optimal timeframe for calculations is H1)
The function for calculating support and resistance levels has been updated; in this calculation option, fibonacci levels are taken into account, respec
FREE

Session Killzone Indicator
Indicator that helps you to identify the killzone times of both London and NewYork sessions which usually is the most times for high volatility and taking liquidity from the market. Killzone times are configurable through indicator parameters. The indicator adjusts the range of the killzones based on the daily trading range.
FREE

GEN Ichimoku Signal Developer: gedeegi Overview GEN Ichimoku Signal is a technical indicator for the MetaTrader 5 platform. It combines two different trend analysis systems, Ichimoku Kinko Hyo and HalfTrend, into a single visual tool. The primary function of the indicator is to color the chart's candlesticks based on whether the conditions of these two systems are in alignment. The indicator provides a visual representation of market conditions by displaying one of three colors: one for aligned
FREE

Acıklama:
Forex piyasasında (PSAR) Profesyonel ve populate göstergelerden Birine Dayanan Yeni ücretsiz göstergemizi tanıtmaktan mutluluk duyuyoruz (PSAR) drank gösterge orijinal Parabolik SAR göstergesinde Yeni bir değişikliktir pro SAR göstergesinde noktalar ve Fiyat tablosu arasındaki geçişi görebilirsiniz, drank crossover bir sinyal değil, hareketin sonu potansiyeli hakkında konuşun, yeni mavi nokta ile satın almaya başlayabilir ve ilk mavi noktadan bir atr önce stop loss koyabilirsiniz ve
FREE

The Volume+ and VSA Signals indicator for MT5 is based on the Volume Spread Analysis (VSA) methodology to provide the signals. The signals are displayed at closing of bars on the main window or subwindow in the form of symbols. The symbols are not repainting. The indicator produces a signal on an individual bar and this signal is not buy or sell signal. When a minor trend goes in the opposite direction of a major trend, there are sequences of major trend-following signals that give a higher pro

This indicator identifies and highlights market inefficiencies, known as Fair Value Gaps (FVG), on price charts. Using a custom algorithm, the indicator detects these areas of imbalance where the price moves sharply, creating potential trading opportunities. Indicator Parameters: Bullish FVG Color (clrBlue) : Color used to highlight bullish inefficiencies. The default value is blue. Bearish FVG Color (clrRed) : Color used to highlight bearish inefficiencies. The default value is red. Bullish FVG
FREE

Smart Grid MT5 automatically recognizes any symbol, period and scale of the chart and marks it up accordingly. It is possible to mark up the chart by trading sessions. The grid consists of the two main line types.
Vertical lines There are two visualization methods: Standard - the lines are divided into three types, separating: Small time period. Medium time period. Large time period. Trading Session - the lines are divided into groups (a total of ten). Each group has two lines: the first is res
FREE
A Renko Tick chart based on continuously adjusting percentage.
Live Renko bricks formed by tick data
Adjustable brick width expert for indicator attached Scalp with a Renko, get weird.
The settings can and will break the script if you turn them up too high. Turning off outline mode will not look as nice, but can potentially allow for a larger number of bricks.
FREE

In the "Masters of Risk" trading system, one of the main concepts is related to places where markets change direction. In fact, this is a change in priority and a violation of the trend structure at the extremes of the market, where supposedly there are or would be stop-losses of "smart" participants who are outside the boundaries of the accumulation of volume. For this reason, we call them "Reversal Patterns" - places with a lot of weight for the start of a new and strong trend.
The important a

CustomRSI50 - 50 Seviyeli Özelleştirilmiş RSI Göstergesi Açıklama CustomRSI50, popüler Göreceli Güç Endeksi (RSI) temel alınarak oluşturulmuş özelleştirilmiş bir teknik göstergedir. Bu gösterge, birçok trader için momentum analizinde kritik öneme sahip olan 50 seviyesine özel vurgu yaparak, RSI'nin net ve özelleştirilebilir bir görselleştirmesini sunar. Ana Özellikler Yapılandırılabilir RSI periyodu Vurgulanan 50 seviyesi referans çizgisi Özelleştirilebilir uygulanan fiyat türü Ayrı pencerede gö
FREE

Emtia Kanalı Endeksi (CCI) göstergesinin çok para birimi ve çok zaman çerçeveli modifikasyonu. Parametrelerde istediğiniz para birimini ve zaman dilimlerini belirtebilirsiniz. Ayrıca panel aşırı alım ve aşırı satım seviyelerini geçerken bildirim gönderebilir. Noktalı bir hücreye tıkladığınızda bu sembol ve nokta açılacaktır. Bu MTF Tarayıcıdır.
Kontrol panelini grafikten gizlemenin anahtarı varsayılan olarak "D"dir.
Parametreler CCI Period — ortalama dönem. CCI Applied price — fiyat türü. C

HiloPower – Advanced Trend and Market Strength Indicator for MetaTrader 5 HiloPower is not just another trend indicator developed from the traditional Hi-Lo. It was designed to offer a more complete and intelligent reading of the market, combining direction, strength, and intensity of movements. With it, the trader can see not only where the price is going, but also how strong and volatile that movement really is.
FREE

Market Sessionsync** is a cutting-edge trading session indicator designed to enhance your trading experience by visually breaking down the market's daily rhythm. With a compact window overlaid on your chart, this indicator provides a split-second understanding of the current trading session through: Basic setup: Set Difference between your local time and your broker time , set DST(Daylight Saving Time) ON or OFF , set timescale sync you want to use (Local, Broker, CET) - A vertical time marker
FREE

SMC Trend Momentum Signal Line
SMC Trend Momentum Signal Line is an MT5 indicator that draws a smoothed on-chart line and colors it in real time: lime for positive momentum, tomato for negative, derived from the “SMC Trend Momentum” subwindow oscillator. This gives you immediate momentum direction directly in the main chart. Note: You must purchase the “SMC Trend Momentum” to see the line. The SMC Trend Momentum Signal Line is and will remain free of charge for you. Key Features Colored On-Char
FREE

If you love this indicator, please leave a positive rating and comment, it will be a source of motivation to help me create more products <3 How to use SuperTrend? When the price crosses above the supertrend line it signals a buy signal and when the price crosses below the supertrend line it signals a sell signal. The supertrend indicator which acts as a dynamic level of support or resistance and helps traders make informed decisions about entry and exit points. When prices are above s upertre
FREE

For feedback, free connect to signal, PARTNER PROGRAM and detailed information : Facebook Welcome to the "Breakeven Line" indicator, version 1.1, developed by Sergei Ivanov in 2025. Visualize breakeven price levels for your trades with precision and ease. Advisor Description The "Breakeven Line" is a MetaTrader (MQL5) indicator that displays breakeven price levels for open buy and sell positions on the current symbol, factoring in commissions and swaps for accurate risk management. Key
FREE

This indicator displays the wave structure of the market in the form several wave levels nested in each other. For each of these levels an automatic preliminary (draft) marking of waves in Elliott's style (123..., ABC... etc.) is created. This markup is completely automatic and absolutely univocal. The indicator is especially useful for beginner wave analysts, because among all the possible versions for wave marking, it allows you to immediately take the most adequate version as a ba
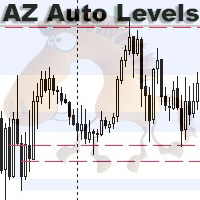
AZ Auto Levels builder ATR edition Indicator of automatic level drawing. For different instruments you need to play with the parameters to find the right ones. So, what is its idea - the indicator searches for levels of interest on the timeframe selected in the settings (by default H1). The search occurs only on candles that are 30% greater than the standard daily ATR of similar candles (you can change this in the settings). ATR is calculated for 20 days ago (also can be changed in the settings)
FREE

This is a dedicated trading auxiliary tool for the MT5 platform, with the core function of automatic counting and labeling of candlesticks within a custom trading session . It adapts to overnight trading scenarios and broker time differences (summer/winter time), features a lightweight design and flexible configuration, and eliminates manual candlestick counting to improve chart analysis efficiency. Core Features Customize the opening and closing time of the trading session in Beijing Time, sup
FREE
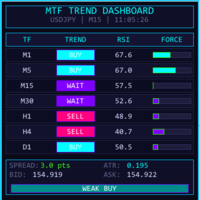
MTF TREND DASHBOARD - Çoklu Zaman Dilimi Trend Analiz Aracı 7 zaman diliminde (M1, M5, M15, M30, H1, H4, D1) trend yönünü aynı anda gösteren güçlü bir görsel panel. === ANA ÖZELLİKLER === EMA kesişimi ile gerçek zamanlı çoklu zaman dilimi trend tespiti Aşırı alım/aşırı satım renk kodlamasıyla RSI değerleri Dinamik trend güç çubukları Genel piyasa eğilim sinyali (Strong Buy/Sell, Bias, Weak, Neutral) Spread, ATR, Alış/Satış fiyatlarının canlı gösterimi Özelleştirilebilir neon renklerle modern koy
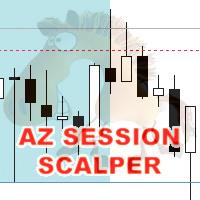
AZ session scalper
A small but useful session indicator, designed primarily for scalping. Enable the session you plan to trade, watch the reaction of the M5/M15 candlesticks to the level of the previous trading session, and enter. We always look at the reaction of the current session to the previous one. For example, if you trade the Americas, enable the European session, and watch how one session takes away liquidity from another. Important: adjust the time to your broker's time zone in the i
FREE

Product Name: SavasaLaS Tutelage | Pro Price Action Compass Stop guessing. Start trading with Confluence. SavasaLaS Tutelage is not just an indicator; it is a complete trading system designed for the serious Price Action trader. It eliminates chart noise by strictly enforcing the three pillars of institutional trading: Market Structure , Trend Direction , and Candlestick Verification . Unlike standard indicators that flood your chart with weak signals, SavasaLaS Tutelage waits for the "Perfect O
FREE

Fundamentação teórica A VWAP é uma média móvel ajustada pelo volume, ou seja o peso de cada preço corresponde ao volume de ações negociadas no período, dando mais importância ao período em que se tenha mais negociações. [1] VWAP = sum(price[i]*volume[i]) / sum(volume[i]) Metodologia É possível configurar o período que será utilizado para o calculo da VWAP, a cor, a espessura e o estilo da linha. A linha é desenhada desde a o começo da série disponível apenas uma vez para economizar recursos com
FREE

CDI Asymmetric Channel PRO – Feature Overview This indicator is a hybrid channel tool that combines three powerful approaches: statistical modeling (long-term) , wave-following logic (short-term) , and quantified distortion analysis (subwindow) —all anchored by a shared fractal peak detection engine. 1. Hybrid Adaptive Algorithm While using a unified fractal detection engine, the indicator simultaneously applies three distinct calculation models with different roles: 1-1. Short-Term (Small Chann

Hull Suite by Riz | MT5 Indicator Overview: Hull Suite is a premium trend-following indicator that combines three powerful Hull Moving Average variations (HMA, EHMA, THMA) into one versatile tool. Designed for traders who demand clarity and precision, this indicator helps identify trend direction with minimal lag while filtering out market noise. Key Features: Three Hull Variations – Switch between HMA (classic), EHMA (exponential smoothing), and THMA (triple weighted) to match your trading styl
FREE

Highly configurable Bollinger Bands indicator. Features: Highly customizable alert functions (at levels, crosses, direction changes via email, push, sound, popup) Multi timeframe ability Color customization (at levels, crosses, direction changes) Linear interpolation option Works on strategy tester in multi timeframe mode (at weekend without ticks also) Parameters:
Bollinger Bands Timeframe: You can set the lower/higher timeframes for Bollinger Bands. Bollinger Bands Bar Shift: Y ou can set th
FREE

Price Predictor Pro Turn Market Patterns into Predictable Profits!
Are you tired of guessing where the market will go next? With Price Predictor Pro , you’ll trade with confidence by spotting powerful chart patterns and receiving precise price projections —directly on your MT5 chart.
What Price Predictor Pro Does: ️ Detects high-probability chart patterns like Double Tops, Double Bottoms, Head & Shoulders, Flags, Pennants, and more . ️ Instantly projects the next price target using adv
FREE
FULL VERSION https://www.mql5.com/en/market/product/145203?source=Site https://www.mql5.com/en/users/gedeegi/seller
GEN TurboTrend Signals is an adaptive volatility-based trend indicator designed to help traders identify dominant trend directions, key momentum transition points, and projected profit-taking zones in a visual and intuitive manner. The indicator utilizes a temporally-weighted moving average combined with statistical dispersion via standard deviation to construct a dynamic volati
FREE

Gösterge tanıtımı:
Gösterge trend çizgisi ve histogram çizer, Küçük fiyat gecikmesi vardır ve gelecekteki işlevleri yoktur, sinyaller kaymaz. Piyasa alanlar arası salınımlar altındayken, gösterge kırmızı ve yeşil histogram gösteriyorsa, bu düşük fiyat bölgesidir, gösterge macenta ve sarı histogram görünüyorsa, burası yüksek fiyat bölgesidir. Yüksek ve düşük fiyat bölgelerine göre piyasanın trendini analiz etmek için de kullanılabilir. Göstergenin bir önceki k satırında yukarı veya aşağı ok old
FREE

ADR, AWR & AMR Indicator: Comprehensive Trading Guide Try "Average Daily Range Scalper":
https://www.mql5.com/en/market/product/154469 Core Concepts ADR (Average Daily Range) Definition : The average distance between daily high and low prices over a specified lookback period (typically 14-20 days) Purpose : Measures daily volatility expectations, identifies range-bound versus trending days, sets realistic intraday profit targets Key Insight : Markets tend to respect their average volatility - d
FREE

这是一个组合指标分析趋势、支撑阻力、买卖点。运用了均线MA、布林带、KDJ、CCI、RSI。
主图上下线是布林带上下线,采用的是20周期和2.3标准差可以用来支撑阻力。 中间的是分析趋势的均线,趋势分析是用均线多周期: 为涨趋势,反之为下跌趋势。在同一种颜色,基本说明趋势没有发生变化。 子图是由 KDJ、CCI、RSI三个指标组成,大于70超买,小于30超卖, 智能提示是运用了算法,主要计算布林带, KDJ、CCI、RSI指标
有三个或四个指标超出市场常态就会发出提示行情可能反转。 子图指标运用了很多数据,刚刚开始加载会有点慢,耐心等待就可以 这个指标是子图指标,还要再下我发布的MMB分析,这样就刚刚好组成一套分析
电脑分辨率的文本大小请设置100%,不然字体会不一样
FREE

Вилка Нео v5, разрабатывалась для торговой системы "Оракул", но постепенно дополнялась, например - углами Ганна и другими опциями... Можно создавать графические объекты с заданным цветом, стилем и толщиной, такие как: прямоугольники с заливкой и без, отрезки трендлиний и нестандартный инструмент - "вилка Нео" в виде трезубца, так же есть возможность интерактивно настраивать цветовую палитру прямо с графика, настраивать видимость объектов для разных ТФ, толщину и стили...
Панель переключается кл
FREE

High Low Swing (HLS) Indicator
The HLS indicator is a technical analysis tool designed to identify swing highs and lows in the market, aiding swing traders in making informed decisions. It offers an adjustable "degree" parameter, allowing you to customize the sensitivity to strong price movements based on current market conditions.
Features:
• Clear Buy/Sell Signals: The indicator plots signals directly on the chart, simplifying trade identification.
• Adjustable Swing Strength: The "degr
FREE
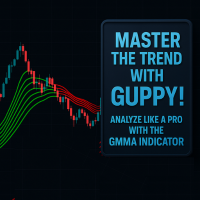
This is a custom Guppy-style Moving Average indicator built for MetaTrader 5 (MT5), designed to replicate the appearance and logic of the popular TradingView version. Unlike the built-in tools in MT5, this indicator offers a simplified yet powerful approach by using only 6 Exponential Moving Averages (EMAs). It provides clean visualization and accurate market layering to help traders make better decisions. Features
TradingView-Style Guppy Logic – Displays 6 EMAs for combined short- and medium-
FREE

The Supertrend etradro indicator is volatility based and is more of a trend following indicator in function. The ATR indicator, which is integrated into the calculation of the super trend, also calculates course gaps (gaps) and does not overlook them. This allows more accurate values to be calculated. When measuring volatility, the mean value of the current price serves as the basis. Since the Supertrend indicator features sliding stop and reversal lines, it is quite similar in function to the P
FREE
If you love this indicator, please leave a positive rating and comment, it will be a source of motivation to help me create more products <3 Key Takeaways StochRSI is an oscillator that measures the RSI level relative to its high-low range over a period of time. It is more sensitive than the traditional RSI and can highlight overbought or oversold conditions in the market. StochRSI is typically used to generate more frequent and timely trading signals compared with the traditional RSI. StochRSI
FREE

AP VWAP Bands Pro (MT5) Volume-weighted average price with ±σ bands for clear intraday bias, mean-reversion zones, and dynamic support/resistance. Works on crypto (incl. BTC) , FX , indices , and metals . Uses tick-volume when real volume isn’t available. What it shows VWAP line (volume-weighted mean price). Two envelopes around VWAP (default ±1σ and ±2σ) to highlight balance vs. extension. Reset modes : Day , Week , or Anchor Time (HH:MM) to start VWAP where you need it (e.g., exchange open).
FREE

Colored Moving Average – Visual Trend Clarity Made Simple The Colored Moving Average is a clean and effective trend visualization tool that enhances any trading strategy. Unlike standard moving averages, this indicator dynamically changes color based on the direction of the trend—green when rising, red when falling—making it easy to spot shifts in momentum at a glance. Perfect for scalping, day trading, or swing trading, this indicator helps you: Instantly identify bullish and bearish phases Fi
FREE

Trendy Stock is a price following indicator that uses Stochastic to show when the price is out of the oversold or overbought areas. The algorithm allows you to stay longer in a trend where the bulls or bears are in control. The indicator changes color immediately the price exits oversold/overbought state. In short, the downtrend [red] bars start to paint when the buying pressure decreases while the uptrend [green] bars form as the buy pressure kicks in. For MT4 version, follow :: https://www
FREE
Indicador com regra de coloração para estratégias que utilizam Inside Bar! Quando rompe a barra inside, se for para cima, compra e posiciona o stop loss na mínima da barra inside. Se romper para baixo, vende e posiciona o stop loss na máxima da barra inside. Pode ser aliada a tendências de outros tempos gráficos e outros filtros.
Grupo de sinais gratuito no telegram: https://t.me/InsideBarRST
FREE
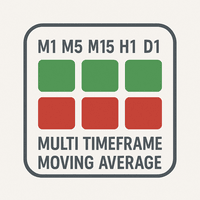
The "MultiTF Moving Average Panel" indicator is more of a helping tool than an indicator, it serves to help know the trend direction for the current currency pair of all timeframes in one place. It is best used with other indicators and signals, to help filter the signals according the trend based on multiple timeframes.
Indicator inputs : - Moving Average period : Default is set to 34. - Moving Average method : The method of calculation of the Moving Average. Default is set to Exponent
FREE

Are you tired of trading without a clear direction ? Do market fluctuations and noise leave you feeling overwhelmed ?
Here is the solution you've been searching for! Imagine an indicator that simplifies trading, cuts through market noise, and provides crystal-clear signals. The Heiken Ashi OHLC Indicator does just that!
What does the Heiken Ashi OHLC Indicator do? It transforms traditional candlestick charts into a trader's dream. Instead of dealing with erratic price movements, you'll witn
FREE

EMA Multi Timeframe (MTF) – MT5 Indicator Description: The EMA Multi Timeframe (MTF) indicator for MT5 allows you to display an Exponential Moving Average (EMA) from a higher (or lower) timeframe directly on your current chart. Example: You can see the Daily (D1) EMA 9 plotted directly on your H1 chart, or even on an M5 chart, helping you align your entries with higher timeframe trends without switching between charts. Key Features: Display EMA from selectable timeframes (M1, M5, M15, M30, H1
FREE

MT4 Version Most indicators draw lines.
This one draws the battlefield. If you ever bought an EA or indicator based on a perfect equity curve — and then watched it bleed out live — you’re not alone.
The problem? Static logic in a dynamic market. Fibonacci Bollinger Bands adapts.
It combines Bollinger structure with customizable Fibonacci levels to mark zones of control — where price reacts, pauses, or reverses. No magic. Just logic that follows volatility. Why this tool matters It
FREE
İkili opsiyonlar için sinyal indikatörü; Forex ve diğer piyasalarda da etkili bir şekilde kullanılabilir. M1–M5 üzerinde kısa vadeli grid (ızgara) işlemleri için uygundur ve pozisyonları kademeli olarak artırmaya yönelik sinyaller içerir. Ücretsiz sürüm yalnızca XAUUSD paritesinde çalışır. MetaTrader 5 için tam sürüm burada: https://www.mql5.com/en/market/product/156185 İndikatör iki seviyeli bir adaptasyon kullanır: başlangıçtan itibaren “hızlı/yumuşak” olarak ayarlanabilen temel hız profili ve
FREE

LogVar , fiyatın logaritmik değişimini hesaplayan ve gösteren bir göstergedir. Bu, dönemler arasındaki yüzde değişiklikleri ölçmenin daha doğru bir yoludur. Geçerli kapanış fiyatını n dönem önceki kapanışla ( iPeriod ) karşılaştırır ve sonucu genişletilmiş logaritmik ölçekte sunar. Çizgi otomatik olarak renklendirilir: Yeşil: fiyat referansın üzerinde (yükseliş trendi). Kırmızı: fiyat referansın altında (düşüş trendi). 0 seviyesi , pozitif ve negatif değişimleri ayıran nötr çizgidir. Ana özel
FREE
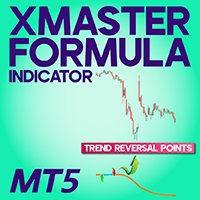
XMaster XHMaster Formula MT5 Indicator – No Repaint Strategy The XMaster / XHMaster Formula Indicator for MetaTrader 5 (MT5) is an upgraded version of the popular MT4 tool, designed to detect trend direction, momentum shifts, and high-probability reversal zones. With enhanced optimization for the MT5 engine, the indicator delivers stable No Repaint signals and performs efficiently on multiple asset classes including Forex, Gold, Cryptocurrencies, and Indices. The MT5 version integrates improved
FREE
The Multi-Frame MACD Indicator is a robust MetaTrader 5 (MT5) indicator that utilizes the Moving Average Convergence Divergence (MACD) to analyze trends across multiple timeframes. This indicator synchronizes MACD-based trend signals from up to nine timeframes (M1, M5, M15, M30, H1, H4, D1, W1, MN1) and presents them with clear visual cues, including a colored MACD line, signal arrows, and a customizable dashboard. Perfect for traders seeking momentum and trend reversal insights. Features Multi-
FREE

Easy Correlations Indicator The Easy Correlations Indicator is designed to help traders analyze the relationship between two correlated instruments. By monitoring the distance between their Relative Strength Index (RSI) values, the indicator highlights situations where one instrument has moved significantly further than the other. This creates potential trading opportunities: Sell the stronger instrument (overstretched RSI) Buy the weaker instrument (lagging RSI) Because the positions are opened
FREE

You may find this indicator helpfull if you are following a session based strategy. The bars are colored according to the sessions. Everything is customisable.
Settings: + Asia Session: zime, color, high, low + London Session: zime, color, high, low + US Session: zime, color, high, low
Please feel free to comment if you wish a feature and/or give a review. Thanks.
FREE

The Fisher Transform is a technical indicator created by John F. Ehlers that converts prices into a Gaussian normal distribution. The indicator highlights when prices have moved to an extreme, based on recent prices. This may help in spotting turning points in the price of an asset. It also helps show the trend and isolate the price waves within a trend. The Fisher Transform is a technical indicator that normalizes asset prices, thus making turning points in price clearer. Takeaways Turning poi
FREE

The RSI Divergence Indicator is a powerful tool designed to identify potential reversals in the market by spotting discrepancies between the Relative Strength Index (RSI) and price movement. Divergences can be a significant indication of an impending trend change, either from bullish to bearish or vice versa. This indicator is built for making the task of identifying potential trade opportunities more straightforward and efficient.
Features: Automatic Detection: The indicator scans the chart
FREE
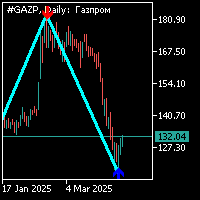
Zig-zag göstergesi, 34 periyotlu standarttır ve ok şeklinde ek bir sinyale sahiptir. Ek sinyal, zig-zag göstergesinden ayrı olarak hesaplanır. Bu gösterge aşağıdaki şekilde çalışır: 1. zıg-zag göstergesinin bir bölümünü oluştururken ve ok şeklinde ek bir sinyal görünürken, konumu ok yönüne doğru açmanız gerekir; 2. zıg-zag göstergesinin bir başka kolu, önceki kolun tepesindeki ek sinyalin (ok) karşı tarafında oluştuğunda, bekleyen emrin konumunu belirlemek mümkündür; 3. zig-zag'ın karşı kolunun

Trend Entry Indicator Your Trading will Be easier with this indicator!!! This Indicator is Developed To make our trading life easier. Get an Arrow for Entry with Take Profit and Slop Loss marks on chart. - Indicator is Based on trend, because thats what we all want we want to follow the trend "it's our friend". - Based on Levels, price action and oscillators. - It works on all currency pairs, all indices, metals and stock. - it works on all pairs/indexes on Deriv including Boom and Crash. - Tim

Alıcı-Satıcı Baskısı Göstergesi, M1'den D1'e kadar çoklu zaman dilimlerinde piyasa duyarlılığını görüntüler. Yapılandırılabilir bir dönem boyunca hareketli ortalama momentum analizi kullanarak alım ve satım baskısı yüzdelerini hesaplar. Görsel panel, alıcı gücünü deniz mavisi, satıcı hakimiyetini kırmızı renkte gösteren ilerleme çubukları ile birlikte önemli olduğunda yüzde değerlerini görüntüler. Her zaman dilimi, yükseliş trendleri, düşüş trendleri veya yatay piyasaları gösteren yönlü gösterg

Elliot Waves Analyzer Pro calculates Elliot Waves to Help Identify Trend direction and Entry Levels. Mainly for Swing Trading Strategies. Usually one would open a Position in trend direction for Wave 3 or a Correction for Wave C . This Indicator draws Target Levels for the current and next wave. Most important Rules for Elliot Wave Analysis are verified by the Indicator. The Pro version analyzes Multiple Timeframes and shows the Subwaves and Target-Levels. For an Overview " Elliot Waves Anal
Ticaret hassasiyetinizi Ultimate Confluence Signal Indicator MT5 ile geliştirin, forex, CFD, kripto paralar ve emtialarda yüksek olasılıklı kurulumlar için ondan fazla kanıtlanmış teknik araçtan sinyalleri senkronize eden güçlü bir çoklu gösterge paketi. Confluence ticaretinin temel prensiplerinden esinlenerek—1990'larda Alexander Elder gibi uzmanlar tarafından "Triple Screen" sisteminde öncülük edilen—bu gösterge, tüccarların birden fazla analiz (trend, momentum, volatilite) katmanlayarak gürül

-Fitil Dolgu Trend konsepti
Piyasadaki yüksek volatilite olayları sırasında, mumlar hareketleri boyunca fitil oluşturma eğilimindedir. Bir mum çubuğundaki fitil, fiyattaki bir reddi yansıtır. Çoğu zaman bu fitiller doldurulur çünkü bu yönde iten büyük bir hacim vardır. Wick Fill Trend, trend piyasalarına odaklanan bu fırsatları tarar.
Giriş noktası, kar alma ve zararı durdurma ile canlı sinyali görüntüleyen bir başarı oranı simülatörü gösterge tablosuna sahiptir. Bu başarı oranı simülatörü, g
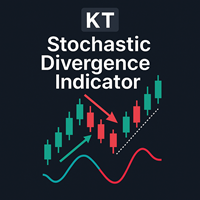
Diverjans, piyasadaki olası fiyat dönüşlerini gösteren en önemli sinyallerden biridir. KT Stoch Divergence, fiyat ile stokastik osilatör arasındaki normal ve gizli uyumsuzlukları gösterir.
KT Stoch Divergence’ın Sınırlamaları
Sadece stokastik diverjansı giriş sinyali olarak kullanmak riskli olabilir. Her diverjans güçlü bir dönüş anlamına gelmeyebilir. Daha iyi sonuçlar için fiyat hareketi ve trend yönü ile birlikte kullanılmalıdır.
Özellikler
Fiyat ile stokastik osilatör arasındaki normal ve

KT Heiken Ashi Alert, standart Heiken Ashi mumlarına dayanarak alım ve satım oklarını çizer ve uyarılar üretir. Heiken Ashi'yi işlem stratejisine dahil etmek isteyen yatırımcılar için vazgeçilmez bir araçtır. Heiken Ashi ayıdan boğa durumuna geçtiğinde alış oku çizilir. Heiken Ashi boğadan ayı durumuna geçtiğinde satış oku çizilir. Mobil bildirim, e-posta, sesli ve pop-up uyarıları dahildir.
Heiken Ashi nedir? Japonca'da "Heiken Ashi" ortalama mum anlamına gelir. Mum grafikleri daha okunabilir

News Radar Pro transforms MT5’s built-in economic calendar into a live, on-chart trading tool. See upcoming macroeconomic events directly on your chart with impact filtering, countdown timers, and intelligent alerts, all in your chosen timezone. No external websites, APIs, or feeds required. How It Works Economic Calendar Integration: Access MT5’s global events database directly on your chart. Event Filtering: Show events by impact level (High, Medium, Low), currency, or major releases like NFP,
FREE
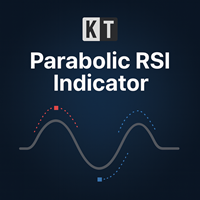
KT Parabolic RSI, olası piyasa dönüş noktalarını vurgulamak için Parabolic SAR’ı doğrudan RSI çizgisi üzerine yerleştirir. RSI’nın klasik aşırı alım ve aşırı satım seviyeleri zaten tersine dönüşleri işaret eder, ancak eklenen PSAR filtresi büyük ölçüde gürültüyü ortadan kaldırarak sinyalleri daha net ve güvenilir hale getirir ve size daha sağlam işlem fırsatları sunar. Büyük Kare Sinyalleri: RSI aşırı alım veya aşırı satım bölgesindeyken gerçekleşen Parabolic SAR dönüşü. Bunlar yüksek olasılıklı
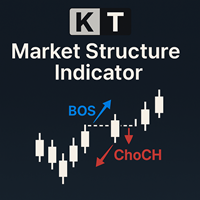
The KT Market Structure intelligently detects and displays Break of Structure (BOS) , Change of Character (CHoCH) , Equal Highs/Lows (EQL) , and various significant swing high/low points using our proprietary algorithm for accurate pattern detection. It also offers advanced pattern analysis by effectively demonstrating the captured profit for each pattern. A fully automated EA based on this indicator is available here: KT Market Structure EA MT5
Features
Accurate Pattern Detection: Our advance
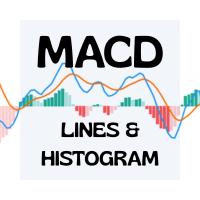
Advanced MACD Indicator with 6 Colors & Adjustable Line Thickness Elevate your trading charts with this fully customizable MACD indicator for MetaTrader 4/5. With six independent color slots and per-line thickness controls, you can tailor every element to your exact preferences. Key Features Six Separate Color Slots
Customize each component with its own color: MACD Line Signal Line Histogram Bars (Bullish) Histogram Bars (Bearish) Zero Line Adjustable Line Thickness
Choose any thickness—from e
FREE

Smoothed Supertrend Indicator - Volatilite Tabanlı Trend Göstergesi ve Yumuşatma Fonksiyonu Smoothed Supertrend Indicator, MetaTrader 5 için klasik Supertrend göstergesinin gelişmiş bir varyantıdır. Ek bir yumuşatma fonksiyonunun entegrasyonu ile piyasa gürültüsü azaltılır ve trend sinyallerinin kalitesi arttırılır. Teknik Açıklama: Gösterge, piyasa volatilitesini ölçmek için Average True Range (ATR) temellidir ve bunu fiyat verilerinin hareketli ortalama yumuşatması ile birleştirir. Sonuç çizg
FREE
AC Pivot Panel – Your Ultimate Pivot Trading Tool The AC Pivot Panel is a powerful yet user-friendly pivot point indicator designed to help traders identify key support and resistance levels with ease. Whether you’re a beginner or an experienced trader, this indicator simplifies pivot trading and enhances your decision-making process. Key Features : Interactive Selection Panel : Easily adjust pivot settings directly on the chart with a compact and intuitive panel. Multiple Pivot Methods : C
FREE

The Stochastic Momentum Index (SMI), developed by William Blau and featured in the January 1993 edition of Technical Analysis of Stocks & Commodities magazine, introduces a unique perspective to trading analysis. Distinguished from the conventional Stochastic Oscillator, which evaluates the current close in relation to the recent x-period high/low range, the SMI assesses the close's position relative to the midpoint of this range. This innovation yields an oscillator with a range of +/- 100, re
FREE

FlatBreakout MT5 (Free Version) Flat Range Detector and Breakout Panel for MT5 — GBPUSD Only FlatBreakout MT5 is the free version of the professional FlatBreakoutPro MT5 indicator, specially designed for flat (range) detection and breakout signals on the GBPUSD pair only.
Perfect for traders who want to experience the unique fractal logic of FlatBreakout MT5 and test breakout signals on a live market without limitations. Who Is This Product For? For traders who prefer to trade breakout of
FREE

Introduction To Time Box Indicator Time Box Indicator is a must have indicator for any trader. It will display daily, weekly and Monthly box according to your preferences. Yet, you can extend any important price levels in your chart automatically. You can use them as the significant support and resistance levels. It is very simple but effective tool for your trading.
Graphic Setting Use White Chart Line Style for Current Open price
Daily Setting Update Timeframe for daily box Number of days to
FREE
MetaTrader mağazası, geliştiricilerin alım-satım uygulamalarını satabilecekleri basit ve kullanışlı bir sitedir.
Ürününüzü yayınlamanıza yardımcı olacağız ve size Mağaza için ürününüzün açıklamasını nasıl hazırlayacağınızı anlatacağız. Mağazadaki tüm uygulamalar şifreleme korumalıdır ve yalnızca alıcının bilgisayarında çalıştırılabilir. İllegal kopyalama yapılamaz.
Alım-satım fırsatlarını kaçırıyorsunuz:
- Ücretsiz alım-satım uygulamaları
- İşlem kopyalama için 8.000'den fazla sinyal
- Finansal piyasaları keşfetmek için ekonomik haberler
Kayıt
Giriş yap
Gizlilik ve Veri Koruma Politikasını ve MQL5.com Kullanım Şartlarını kabul edersiniz
Hesabınız yoksa, lütfen kaydolun
MQL5.com web sitesine giriş yapmak için çerezlerin kullanımına izin vermelisiniz.
Lütfen tarayıcınızda gerekli ayarı etkinleştirin, aksi takdirde giriş yapamazsınız.