Conheça o Mercado MQL5 no YouTube, assista aos vídeos tutoriais
Como comprar um robô de negociação ou indicador?
Execute seu EA na
hospedagem virtual
hospedagem virtual
Teste indicadores/robôs de negociação antes de comprá-los
Quer ganhar dinheiro no Mercado?
Como apresentar um produto para o consumidor final?
Indicadores Técnicos para MetaTrader 5 - 25
The Absorption & Exhaustion Detector Professional indicator is a sophisticated volume analysis tool designed to identify critical market turning points by analyzing the relationship between price movement and cumulative volume delta (CVD). This indicator helps traders spot when price movements lack volume confirmation, indicating potential absorption or exhaustion zones. KEY FEATURES Real-time Cumulative Volume Delta (CVD) calculation and normalization Price-volume divergence gap measurement dis

O oscilador Estocástico é um dos principais indicadores usados na análise de ativos financeiros. É um dos destaques no estudo das movimentações de preço e pode ser um importante sinalizador de mudança de tendências no mercado de capitais . O estocástico é um oscilador utilizado para identificar quando um ativo está sobrecomprado ou sobrevendido. Ele é composto por duas linhas: %K, que é calculado a partir das máximas e mínimas de um período e %D, que é uma média móvel de %K. A nossa versão conté
FREE

O "HiperCube USD INDEX (DXY /USDX) " é um referencial financeiro que representa o desempenho de um grupo específico de ativos, como ações, obrigações ou mercadorias, com valores denominados em dólares norte-americanos. Estes índices ajudam os investidores a acompanhar e comparar o desempenho de determinados setores ou mercados ao longo do tempo. Ao ser expresso em dólares americanos, o índice fornece uma medida consistente para avaliar os investimentos, independentemente da moeda nativa ou da l
FREE

Read This : Please provide comments and reviews for future improvements. WaveTrendPro_Indi v1.05
WaveTrend indicator with enhanced histogram visualization: WaveTrendPro_Indi v1.05
Indikator WaveTrend dengan tampilan histogram yang lebih jelas: Histogram otomatis lebih tinggi (bisa diatur dengan parameter HistScale ). Warna histogram berbeda untuk positif & negatif → tren naik lebih mudah dibaca. Tetap ringan & responsif di berbagai pair/timeframe. Cocok untuk scalper, swing trader,
FREE
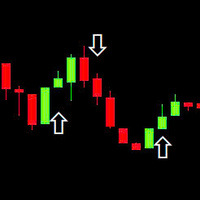
This indicator is based on the RSI (Relative Strength Index) to identify potential Breakout points and draw arrows on the chart to suggest buy/sell signals. Use RSI to find breakout signals. Draw Buy/Sell arrows on the chart. Send alerts when there is a trading signal. Buy (Orange Arrow - 0xFFAA00): When a buy signal appears. Sell (Blue Arrow - 0x0000FF): When a sell signal appears. DRAW_ARROW: Used to draw arrows on the chart.
FREE
MFI Divergence is a technical indicator that detects regular bullish and bearish divergences between price and the Money Flow Index (MFI) at swing highs and lows. It highlights potential reversal points by drawing clean green (bullish) and red (bearish) arrows directly on the chart. The indicator uses configurable swing detection, customizable MFI period, and an optional MFI threshold filter to show signals only in oversold/overbought zones. Alerts are triggered only once per bar on candle close
FREE

"Apresentamos NakaTrend: Seu Detector de Tendências Definitivo para o MetaTrader 5!
Pronto para revolucionar sua experiência de negociação? Conheça o NakaTrend, seu indicador confiável para identificar mudanças de tendência com precisão e facilidade.
Com o NakaTrend, você nunca mais perderá uma oportunidade de capitalizar mudanças no mercado. Quando uma tendência de alta surge, o NakaTrend a sinaliza com um cifrão verde, indicando que você deve fazer uma ordem de compra. E quando a tendência
FREE

O indicador Demanda de Abastecimento RSJ PRO calcula e plota as zonas de "Abastecimento" e "Demanda" no gráfico, identificando o tipo de Zona (Fraca, Forte, Verificada, Comprovada) e em caso de retestes da Zona mostra quantas vezes ela foi testado novamente. Zonas de "oferta" são as zonas de preços onde ocorreu mais oferta do que demanda, fazendo com que os preços caíssem. Zonas de "demanda" são as zonas de preços onde ocorreu mais demanda do que oferta, empurrando os preços para cima.
Certifiq

The initial balance (IB) is a range in which the price spent its first two OPT periods after the opening. In other words, the opening balance is a range of the first hour after the market opened. The opening balance arose from room trading, as room traders observed the various ranges after the market opened.
This indicator allows you to enter the starting and ending hours and minutes of a specific hourly time range so that the trader can set up different IBs according to the market.
Automatic
FREE
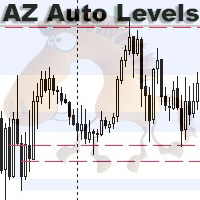
AZ Auto Levels builder ATR edition Indicator of automatic level drawing. For different instruments you need to play with the parameters to find the right ones. So, what is its idea - the indicator searches for levels of interest on the timeframe selected in the settings (by default H1). The search occurs only on candles that are 30% greater than the standard daily ATR of similar candles (you can change this in the settings). ATR is calculated for 20 days ago (also can be changed in the settings)
FREE

The RSI Divergence Indicator is a powerful tool designed to identify potential reversals in the market by spotting discrepancies between the Relative Strength Index (RSI) and price movement. Divergences can be a significant indication of an impending trend change, either from bullish to bearish or vice versa. This indicator is built for making the task of identifying potential trade opportunities more straightforward and efficient.
Features: Automatic Detection: The indicator scans the chart
FREE

O Clock GMT Live tem tudo que você precisa para saber mais sobre nosso corretor, muitas vezes você deve ter se perguntado em que gmt estou ou em que gmt meu corretor está trabalhando, bem com esta ferramenta você poderá saber em tempo real tanto o GMT deslocamento de tempo do corretor e do seu horário local, você também saberá constantemente o ping do corretor Apenas colocando-o em uma hora do dia, você pode obter as informações
O preço aumenta a cada aquisição, com isso vamos proteger para qu
FREE
WYSIWYG OPEN RANGE BREAKOUT - PRO EDITION
Ultra-precise ORB indicator with smart line-breaking, dynamic ATR-based targets, and multi-session adaptability. Perfect for day, swing, and algorithmic traders seeking clear visuals and actionable levels . Trade with confidence – see what you trade, trade what you see . "What You See Is What You Get" "What You See Is What You Get" – The ultimate ORB indicator delivering ultra-precise trading range visualization with a smart line-breaking system. Built
FREE

This is a non-parametric ZigZag providing 4 different methods of calculation. Upward edge continues on new bars while their `highs` are above highest `low` among previous bars, downward edge continues on next bars while their `lows` are below lowest `high` among previous; Gann swing: upward edge continues while `highs` and `lows` are higher than on the left adjacent bar, downward edge continues while `highs` and `lows` are lower than on the left adjacent bar. Inside bars (with lower `high` and
FREE

Trading Dashboard Pro: O Centro de Comando Definitivo no MT5 Transforme seu terminal em uma estação de trading profissional Trading Dashboard Pro é um utilitário completo de gestão de risco e análise de conta, projetado para traders profissionais e candidatos a Mesas Proprietárias (Prop Firms). Ele consolida dados críticos do mercado e métricas de saúde da conta em uma interface elegante e sem latência. POR QUE VOCÊ PRECISA DESTE PAINEL? 1. Para Traders de Mesa Proprietária (Prop Firms)
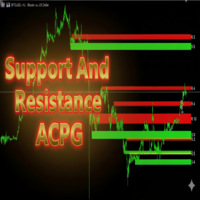
Support And Resistance ACPG Indicator
The Support And Resistance ACPG Indicator (developed by Grok by xAI) is an advanced tool for the MetaTrader 5 (MQL5) platform, designed to identify and visualize support and resistance zones on a price chart. Unlike traditional support and resistance indicators, the ACPG method combines a dynamic approach based on swing points, volatility analysis using the Average True Range (ATR), and an adaptive clustering system to detect high-relevance zones in the
FREE
FREE VERSION FOR GOLD (XAUUSD) AND BTCUSD Dont forget to rate after use this indicator, Thanks.
Features: Clear Buy/Sell labels with directional arrows. Automatic Take Profit (TP) & Stop Loss (SL) labels for better risk management. Easy-to-read chart signals (no messy lines). Works on any timeframe and any asset (Forex, Gold, Indices, Crypto, Stocks). Compatible with MetaTrader 5 (MT5 desktop & mobile sync) . Perfect for: Beginner traders who need straightforward sign
FREE

Fundamentação teórica A VWAP é uma média móvel ajustada pelo volume, ou seja o peso de cada preço corresponde ao volume de ações negociadas no período, dando mais importância ao período em que se tenha mais negociações. [1] VWAP = sum(price[i]*volume[i]) / sum(volume[i]) Metodologia É possível configurar o período que será utilizado para o calculo da VWAP, a cor, a espessura e o estilo da linha. A linha é desenhada desde a o começo da série disponível apenas uma vez para economizar recursos com
FREE
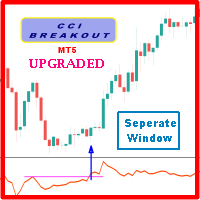
Probability emerges to record higher prices when Commodity Channel Index breaks out oscillator historical resistance level when exhibit overbought values. Since, oscillator breakout of support and resistance have similar effect as price breaks support and resistance levels, therefore, its highly advised to confirm price breakout with oscillator breakout; certainly, will have the same output in short trades. Concept is based on find swing levels which based on number of bars by each side of peak
FREE
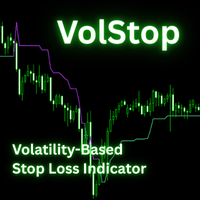
The VolStop Adaptive Volatility-Based Trailing Stop Indicator for MT5 VolStop is a precision volatility-stop indicator for MetaTrader 5, built for traders who want to stay in winning trades longer and exit with discipline. Instead of fixed pips or moving averages, VolStop dynamically tracks price action with ATR-based bands, automatically adapting to market turbulence. Key Features Adaptive Volatility Stops – Calculates a dynamic trailing stop using ATR and a user-set multiplier to match changi
FREE

Entry Point M5 — a complete trading system. Entry Point M5 is a powerful indicator designed as a fully functional trading system suitable for any currency pair. It analyzes the price structure, identifying key moments of market reversals and the emergence of new impulses. The indicator can adapt to different market phases — from strong trending movements to sideways ranges — providing visually clear signals without the need for additional filters or auxiliary tools. Trading with this system is e

DiverX is a powerful and versatile divergence indicator developed for the MetaTrader 5 platform. It detects both Regular and Hidden Divergences based on five popular technical indicators: RSI (Relative Strength Index) , RVI (Relative Vigor Index) , Stochastic Oscillator, CCI (Commodity Channel Index) , and MACD (Moving Average Convergence Divergence) and ATR Plus (author’s proprietary indicator, product page >> ) . The indicator plots results directly on the main chart, providing visual lines
FREE

This indicator is based on Bollinger Bands and moving averages, and uses ADX to get the turning point of the market trend and display a sign.
It is basically intended for use with currency pairs and futures with high volatility. In our tests we use it on XAUUSD, 5m and 15m. Win rate is more than 80% with 50 pips stop loss and 50 pips gain or more.
The indicator is also a simple indicator that allows you to enable or disable alerts and change the color of the arrows from the indicator settings
FREE

Lot Size Calculator - Smart Risk Management Tool
The Lot Size Calculator is a simple but powerful MetaTrader indicator that helps traders manage risk with precision. Instead of guessing your position size, this tool instantly calculates the exact lot size you need based on your account equity, chosen risk percentage, and reward ratio (1:1, 1:2, etc.).
Features:
Input your account equity and risk % per trade Supports both long (buy) and short (sell) trades Automatically adjusts for diffe
FREE
Advanced UT BOT ALERTS for MT5 Sistema profissional de detecção de tendência com múltiplos filtros | Motor UT BOT aprimorado Nós fornecemos apenas indicadores de alta qualidade. Advanced UT BOT foi desenvolvido para uso profissional, com lógica de sinal estável e cálculo seguro que evita atrasos ou atualizações incorretas.
Ele não redesenha, remove nem altera sinais passados.
Todos os sinais de BUY e SELL são gerados somente após o fechamento da vela , garantindo estabilidade e precisão.
No modo
Fique à frente do impulso do mercado com o Pip Movement Alert MT5, um indicador versátil de múltiplas moedas projetado para rastrear e alertar traders sobre movimentos precisos em pips em vários símbolos, ideal para trading de forex, ações, criptomoedas e commodities. Elogiado em comunidades de trading como Forex Factory e Reddit’s r/Forex, e destacado em discussões no Investopedia e TradingView por sua capacidade de detectar mudanças repentinas no mercado, este indicador é indispensável para tr
FREE

O Keltner-Enhanced melhora a precisão e a legibilidade dos Keltner Channels com muitas opções de ajuste, adicionando CINCO novas modalidades de preço ao padrão do Metatrader.
O indicador Keltner-E é um indicador em faixas semelhante às Bandas de Bollinger e aos Envelopes de Média Móvel. Eles consistem em um envelope superior acima de uma linha média e um envelope inferior abaixo da linha média.
As principais ocorrências a serem observadas ao usar os Canais de Keltner são rompimentos acima do
FREE
Simple Spread Indicator (SSI) is a simple and lightweight indicator that displays the current spread value directly on the main chart window.
It helps traders instantly recognize market liquidity conditions and trading costs without opening additional panels or tools. Features Real-time spread display on the main chart Customizable position and font size Minimal system load and no data buffering Useful for scalping and low-spread strategy monitoring How it works The indicator calculates the diff
FREE
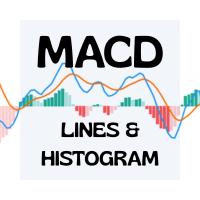
Advanced MACD Indicator with 6 Colors & Adjustable Line Thickness Elevate your trading charts with this fully customizable MACD indicator for MetaTrader 4/5. With six independent color slots and per-line thickness controls, you can tailor every element to your exact preferences. Key Features Six Separate Color Slots
Customize each component with its own color: MACD Line Signal Line Histogram Bars (Bullish) Histogram Bars (Bearish) Zero Line Adjustable Line Thickness
Choose any thickness—from e
FREE

Adaptive Session Trend Pro Easy Plug-and-Play Auto-Optimized Session Trend Indicator for MT5 Adaptive Session Trend Pro is a fully automatic, session-aware trend indicator for MetaTrader 5 that intelligently adapts to the symbol, instrument type, and broker trading session — with zero manual configuration required . Simply attach the indicator to any chart and it instantly: Detects the traded instrument (XAUUSD, US30, EURUSD, Forex pairs) Detects broker server time automatically Applies the cor
FREE

Currency Strength Chart is a powerful Forex indicator designed to track and visually represent the strength of individual currencies within a basket of the 8 major currencies: USD, EUR, GBP, JPY, AUD, NZD, CAD, and CHF. By calculating the relative strength of each currency, the indicator provides traders with a comprehensive overview of how each currency is performing against the others in real-time. This indicator helps traders identify potential trading opportunities by highlighting strong cur
FREE

The big figure is a crucial aspect of forex trading, serving as a reference point for trade execution, risk management, and technical analysis. By understanding the importance of the big figure and incorporating it into their trading strategies, forex traders can improve their decision-making process and increase the likelihood of successful trades. Why is the Big Figure Important? The big figure is important for several reasons: Simplification: Traders often refer to the big figure when discu
FREE

Divergence Hunter - Professional Multi-Oscillator Divergence Detection System Overview Divergence Hunter is a professional-grade technical indicator designed to automatically detect and visualize price-oscillator divergences across multiple timeframes. Built for serious traders who understand the power of divergence trading, this indicator combines precision detection algorithms with an intuitive visual interface. Key Features Multiple Oscillator Support: RSI (Relative Strength Index) MACD (Mo
FREE

Several assets in several markets have the behavior of using specific numbers as Force Numbers, where support, resistance and price thrust is created. Let this indicator draw those levels of support and resistance for you. You can also stack it to show different level of Prices! This technique is being used by Tape Readers and Order Flow traders all over the world for a long time. Give it a try. Challenge yourself to study new ways of Price Action!
SETTINGS
What Price reference to use in the c
FREE

Volume Gives Depth To Price Action! Volume Critical can accurately locate the cheapest areas to place trades. Enter reversals as early as possible to get the best Risk Reward setups!
Features Aggressive algorithm that anticipates reversals Volume Classifications Gray Histograms - Normal Volume, average market activity Orange Histogram - Trending Volume, increased market activity Pink Histograms - Overbought Volume, we can wait for further confirmation to sell Blue Histograms - Oversold Conditio
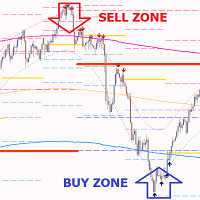
Gold PL MTF - este é um excelente indicador técnico de ações. O algoritmo do indicador analisa o movimento do preço do ativo e reflete automaticamente os Níveis de Pivot importantes do período de tempo especificado (TF) utilizando o método de Fibonacci (secção áurea).
O indicador descreve perfeitamente a trajetória de preços do período selecionado (dia, semana, mês, ano), determina o início de uma tendência e o início de uma correção, que pode evoluir para uma tendência oposta.
O indicador mo

Excellent tracking performance and minimal noise! This trend detection indicator that avoids whipsaws and uncertain market noise and is also agile enough to react to changes in trend.
It is also designed to adapt to dynamic markets.
Functions mainly as a filter to help you trade in the direction of the trend.
Features.
Simple and easy to use. Low load and easy to try out The excellent tracking performance and smooth lines that make it ideal for market analysis Can be used as a trend filter for
FREE

Um indicador simples de price action para destacar inside e outside bars (candles) com cores. É possível escolher qual tipo de barra pode ser destacada entre: inside, outside ou ambas. Também é possível escolher uma primeira cor específica para a sombra e a margem das barras, uma segunda cor específica para uma barra (candle) de alta e uma terceira cor específica para uma barra de baixa.
FREE

O LogVar é um indicador que calcula e exibe a variação logarítmica do preço , uma forma mais precisa de medir as mudanças percentuais entre períodos. Ele compara o preço de fechamento atual com o fechamento de n períodos atrás (definido pelo parâmetro iPeriod ) e apresenta o resultado em uma escala logarítmica amplificada, facilitando a visualização da força e direção da variação. A linha é colorida automaticamente conforme o sinal da variação: Verde: o preço atual está acima do valor logarítmi
FREE

Perfil de volume de intervalo fixo automático com alertas para MT5
Este indicador mostra onde o preço passou mais tempo, destacando níveis importantes que podem ser usados na negociação.
e pode mostrar a densidade de preços ao longo do tempo, delineando os níveis de preços mais importantes, a área de valor e o valor de controle de uma determinada sessão de negociação. Este indicador pode ser anexado a timeframes entre M1 e D1 e mostrará o perfil de mercado para sessões diárias, semanais, mens

An “inside bar” pattern is a two-bar price action trading strategy in which the inside bar is smaller and within the high to low range of the prior bar, i.e. the high is lower than the previous bar’s high, and the low is higher than the previous bar’s low. Its relative position can be at the top, the middle or the bottom of the prior bar.
The prior bar, the bar before the inside bar, is often referred to as the “mother bar”. You will sometimes see an inside bar referred to as an “ib” and its m
FREE

Certainly! Let me introduce you to a powerful tool for MetaTrader 5 (MT5) that can automatically identify and draw support and resistance (S&R) levels on your trading charts. This tool is called the “Support and Resistance Levels Guru” . Support Resistance Levels Guru The Support & Resistance Indicator automatically displays essential S&R levels on your chart. These levels are crucial for technical analysis and are used by many traders. Resistance levels (zones) are shown in R ed , while suppo
FREE
The Channel Sgnals ProfRoboTrading Indicator for MT5 is an effective Forex trading tool designed to track market movements. The MT5 signal point indicator effectively detects trend reversals after they have already occurred. This Indicator is a fully automated technical tool that includes a number of parameters to track market trends. It automatically examines the ever-changing price dynamics of the market, compares the information with earlier data and generates a trading signal. Because
FREE

King Smart Liquidity MT5 é um indicador analítico avançado projetado especificamente para rastrear os fluxos de dinheiro institucional e os grandes bancos no forex, ouro, índices, Bitcoin e outros mercados. Este indicador foi desenvolvido com base na metodologia "Smart Money Concept", que se baseia na compreensão da ação do preço, zonas de liquidez e como as principais instituições financeiras se comportam no mercado. Este indicador não apenas desenha linhas ou zonas, mas fornece uma análise co
Rinse and Repeat indicator for 3 day/session/week setups. Check out our other products for fxer.net:
https://www.mql5.com/en/market/product/114888
https://www.mql5.com/en/market/product/114890
Indicator daily features: Daily close/high/low Weekly open/high/low/close Month open/high/low/close Daily breakouts Daily failed breakouts Asia/London/New York sessions Inside days Outside days Green days Red days
Indicator weekly features:
Weekly breakouts Week dividers Indicator other features: Das
FREE
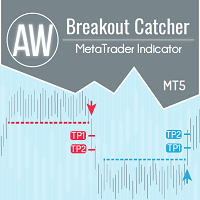
Detalhamento dos níveis de preços, estatísticas avançadas, cálculo de TakeProfit e 3 tipos de notificações. Benefícios: Não redesenhe seus resultados Sinal estritamente no final da vela Algoritmo de filtragem de falha falsa Vai bem com qualquer estratégia de tendências. Funciona em todas as ferramentas e séries temporais Manual e instruções -> AQUI / Resolução de problemas -> AQUI / versão MT4 -> AQUI Como negociar com o indicador Negociar com o AW Breakout Catcher em apenas três etap
Market Structure Shift with FVG Indicator for MT5 This MT5 indicator from the apexfintech.net suite identifies market structure shifts and fair value gaps (FVGs) to provide traders with potential trading opportunities. It alerts users on these events via mobile notifications, enabling them to react quickly to changing market conditions. Key Features: Market Structure Shift Detection: Identifies bullish and bearish market structure shifts based on swing high/low breaks and significant candl
FREE

TickChartAskLine is a specialized indicator for MetaTrader 5 designed to visualize floating spread on tick charts created with TickChartService. The indicator displays two lines on the chart: a blue Bid line (main price) and a red Ask line, allowing traders to visually track spread dynamics in real-time. This is critically important for scalpers and high-frequency traders who need to monitor entry costs at every tick level. The indicator automatically reads the saved spread from the custom sy
FREE
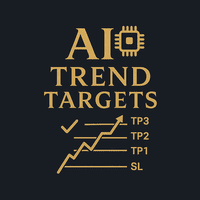
AI Trend Targets – Precision Entries, Targets & Risk in One Overlay AI Trend Targets is a premium smart overlay that turns raw price action into clear, rule-based trade plans: entry, dynamic guard (SL) and three projected targets (TP1–TP3).
It is designed for XAUUSD, major FX pairs and index CFDs, and works on intraday as well as higher timeframes. What it does Behind the scenes, AI Trend Targets combines: A volatility-adaptive “AI Baseline” to define trend direction Context-aware rejection logi
FREE

USD STRENGHT VERSUS MARKET USD (DXY) Versus Market Panel is a professional visual indicator designed to analyze US Dollar strength and pressure against major trading symbols in real time. The indicator compares USD performance (based on DXY logic or internal strength calculation) versus selected symbols, allowing traders to quickly identify dominant currency flow, relative strength, and market bias from a single panel view. Built with a clean, lightweight, and non-intrusive panel , this tool hel
FREE
Advanced ADX Pro: Leve Sua Análise do ADX para o Próximo Nível O Advanced ADX Pro é uma ferramenta de negociação avançada, projetada para transformar sua experiência com o tradicional indicador Average Directional Index (ADX) . Criado para oferecer maior conforto, controle e clareza visual e auditiva , este indicador vai muito além das capacidades do ADX nativo do MetaTrader 5 (MT5). O Que É o ADX e Por Que Ele é Crucial? O ADX é um indicador técnico vital que mede a força da tendência no mer

Highly configurable Macd indicator.
Features: Highly customizable alert functions (at levels, crosses, direction changes via email, push, sound, popup) Multi timeframe ability Color customization (at levels, crosses, direction changes) Linear interpolation and histogram mode options Works on strategy tester in multi timeframe mode (at weekend without ticks also) Adjustable Levels Parameters:
Macd Timeframe: You can set the lower/higher timeframes for Macd. Macd Bar Shift: you can set the o
FREE

This indicator displays Point & Figure charts (PnF charts) in the indicator window. PnF charts show only price movements that are bigger than the specified box size. It helps to eliminate noise and allows focusing on main trends. Time is not a factor here. Only price movements are taken into account. That is why PnF chart is not synchronized with the main chart it is attached to. More about PnF charts: http://stockcharts.com/school/doku.php?id=chart_school:chart_analysis:pnf_charts Indicator wor
FREE

Spot high-probability trades: sandwich bar breakouts at your fingertips This indicator detects Sandwich Bars of several ranges, an extremely reliable breakout pattern. A sandwich setup consists on a single bar that engulfs several past bars, breaking and rejecting the complete price range. [ Installation Guide | Update Guide | Troubleshooting | FAQ | All Products ] Easy and effective usage Customizable bar ranges Customizable color selections The indicator implements visual/mail/push/sound aler
FREE
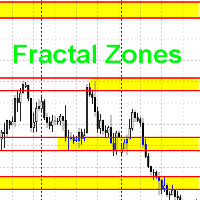
Данный индикатор рисует торговые зоны по фракталам со старших периодов, что упрощает торговлю по уровням.
На одном графике данный индикатор рисует два типа торговых зон. Например если текущий период - H1, то торговые зоны будут искаться по фракталам с H4 и с D1. В стандартных настройках фрактальные зоны с H4 будут рисоваться желтым цветом, а с D1 - зеленым. При наложении зон, происходит смешивание цветов в месте пересечения зон. Как данную вещь поправить, я не знаю в данный момент.
Принцип пои
FREE
https://www.mql5.com/en/users/gedeegi/seller
GEN FXTrendZones GEN FXTrendZones is a technical analysis indicator designed to identify key price zones using Fibonacci retracement and extension levels, while also detecting market structure changes such as Break of Structure (BoS) and Change of Character (CHoCH). The indicator helps traders visualize critical swing areas and potential trend continuation or reversal zones. It includes a visual info panel and optional price alert system.
FREE

Asia Range STDV I ndicator
This Indicator is designed not only to identify the Asia session trading range and Standard Deviation levels but also to assist traders in creating a systematic entry and exit strategy based on the higher timeframe daily trend . The indicator supports both bullish and bearish scenarios, allowing traders to focus on key moments when the Asia range's high or low is "swept" (broken) in line with the confirmed trend. Strategy Overview: 1. Confirming the Daily Trend (Bul
FREE
As the suggested, with this indicator you are able to switch from one symbol or timeframe to another in the same single chart. So forget about opening tons of chart on your screen! It's not designed for ICT or SMC trader, but if you are that kind of trader you still can use it. Imagine you have a strategy containing various indicators and settings, on a single chart you can screen the entry opportunity then move to the next symbol or timeframe.
FREE

Thermo MAP is a multicurrency and multitimeframe indicator that display a smart heat map based on proprietary calculations. Watch how Forex market moved and is currently moving with a single dashboard and have a consistent and good idea of what is happening!
It can be suitable for both scalping or medium/long term, just select options that better fit your trading style Symbols list are automatically sorted based on the preferred column. There is the possibility to click on: First row, timeframe
FREE

Highly configurable CCI indicator. Features: Highly customizable alert functions (at levels, crosses, direction changes via email, push, sound, popup) Multi timeframe ability Color customization (at levels, crosses, direction changes) Linear interpolation and histogram mode options Works on strategy tester in multi timeframe mode (at weekend without ticks also) Adjustable Levels Parameters:
CCI Timeframe: You can set the current or a higher timeframes for CCI . CCI Bar Shift: you can set t
FREE

Mudou um pouco para a velocidade. Testadores necessários para um novo consultor que esteja interessado em me enviar um e-mail 777basil@mail.ru https://backoffice.aurum.foundation/u/DHXP1U
O cálculo do indicador é baseada na alteração do preço na história e é calculado matematicamente, é recalculado a cada vez com uma nova entrada de dados. Pode ser usado em diferentes escalas de tempo. Dos limites do indicador em 70%, ocorre uma alteração de direção do movimento dos preços, ou de consolidação.
FREE

Perfil do mercado do HiperCube! Código de desconto de 20% na Darwinex Zero: DWZ2328770MGM_20 Um Perfil de Mercado é uma representação gráfica que combina informações de preços e de tempo sob a forma de distribuição. Apresenta informações de preço na escala vertical (eixo y) e informações de volume na escala horizontal (eixo x). Este tipo de gráfico fornece informações sobre a atividade do mercado, permitindo que os comerciantes visualizem e avaliem o valor justo de mercado em tempo real.
Funci
FREE

O indicador tradicional Money Flow Index, desta vez, compatível com EAs . Existem 3 buffers expostos que podem ser usados por EAs para analisar automaticamente as condições de sobrecompra e sobrevenda da cotação. Basta usar a função tradicional iCustom() para obter esses sinais. Este cálculo do Money Flow Index é baseado no indicador MFI tradicional da Metaquote.
CONFIGURAÇÕES
Período do MFI Tipo de volume para analisar (Volume Real ou Ticks) Início da região de sobrecompra Início da região de
FREE

The indicator displays the delta and the cumulative delta based on the "Time & Sales" deals list data. In addition to the standard timeframes, the indicator displays data regarding the seconds timeframes (S5, S10, S15, S20, S30) to choose from. Using the rectangle, user can select an arbitrary area in the indicator subwindow to view the ratio of the volumes of deals of buyers and sellers within this area.
Indicator features:
The indicator works correctly only on those trading symbols for which

O Ai Trend Spotter (D Originais).
A queda do Forex.
Muitas vezes perguntamos “Como a Corretora ganha dinheiro ?”, e celebramos quaisquer pequenas negociações vencedoras do nosso lado.
Mas depois de usar (D Originals) você se perguntará "Como fiquei rico da noite para o dia?".
Tão profundo, a ação fala mais alto que a voz.
Com o Ai Trend Spotter, não tenha medo de:
*Manipulação de Mercado
*Reversão de mercado
* Entrada e existência de atirador
* Salto de vela
O indicador é para cad
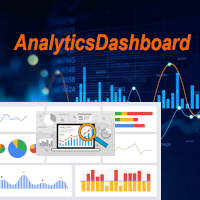
O Painel de Análise é um indicador que analisa as suas negociações passadas e presentes e prepara um painel analítico que pode visualizar com gráficos de pizza adicionais para uma visão detalhada.
São consideradas quatro categorias principais de análise: 1) Métricas de desempenho; 2) Métricas de comportamento negocial; 3) Métricas de qualidade de execução; e 4) Métricas de nível de posição.
As quatro métricas analíticas genéricas foram subdivididas em métricas mais específicas, conforme descr
FREE

**Experience Smarter Trading with FVG Super Signal**
Unlock simpler, more decisive trading with **FVG Super Signal**, an advanced MT5 indicator from the WinWiFi Robot Series. This powerful tool uniquely combines the Fair Value Gap (FVG) technique with robust trend-following logic.
* **Clear Signals:** Delivers intuitive Buy/Sell alerts, simplifying your trading decisions. * **Universal Compatibility:** Works seamlessly across all assets and timeframes. * **Highly Versatile:** Ideal for all tr
FREE

Trendy Stock is a price following indicator that uses Stochastic to show when the price is out of the oversold or overbought areas. The algorithm allows you to stay longer in a trend where the bulls or bears are in control. The indicator changes color immediately the price exits oversold/overbought state. In short, the downtrend [red] bars start to paint when the buying pressure decreases while the uptrend [green] bars form as the buy pressure kicks in. For MT4 version, follow :: https://www
FREE
Mean Reversion Probability – Indicador de Reversão Estatística Descrição curta
Indicador institucional que calcula a probabilidade estatística de reversão para a média móvel de 200 períodos, com base na análise de sobreextensões históricas. Identifica zonas de fadiga do mercado com precisão quantitativa. Principais funcionalidades
Análise estatística avançada – Cria uma base de dados com mais de 500 extensões históricas para calcular probabilidades reais
Pontuação de probabilidade (0–99%) – Qu
Classic ZigZag formula. But no lags and repaints. You can see on screenshots that it shows values between peaks and it is useful to test strategies based on indicator. Because sometimes people find a good idea about it but don't understand that repainting indicators have some things to keep in mind. The parameters are the same as original ZigZag indicator: Depth, Deviation and Backstep. Useful for visual analyze of the chart and cut strategies based on repainting peaks.
FREE
O Mercado MetaTrader contém robôs de negociação e indicadores técnicos para traders, disponíveis diretamente no terminal.
O sistema de pagamento MQL5.community está disponível para todos os usuários registrados do site do MQL5.com para transações em todos os Serviços MetaTrader. Você pode depositar e sacar dinheiro usando WebMoney, PayPal ou um cartão de banco.
Você está perdendo oportunidades de negociação:
- Aplicativos de negociação gratuitos
- 8 000+ sinais para cópia
- Notícias econômicas para análise dos mercados financeiros
Registro
Login
Se você não tem uma conta, por favor registre-se
Para login e uso do site MQL5.com, você deve ativar o uso de cookies.
Ative esta opção no seu navegador, caso contrário você não poderá fazer login.