Indicadores técnicos para MetaTrader 5 - 14

"¿No nos encantaría a todos saber de forma fiable cuándo un valor está comenzando una tendencia y cuándo está en territorio plano? ¿Un indicador que, de alguna manera, nos dijera que debemos ignorar las falsas cabezas y las sacudidas, y centrarnos sólo en el movimiento que cuenta?" El Choppiness Index es un indicador no direccional diseñado para determinar si el mercado está entrecortado (cotizando lateralmente) o no (cotizando dentro de una tendencia en cualquier dirección). Es un indicador osc

# SamuraiFX Combined Pro V14 **Maneja los Giros del Mercado con Volumen y Estructura en Tiempo Real**
Deje de adivinar dónde girará el mercado. El **SamuraiFX Combined Pro** es un completo sistema de trading que combina **Estructura Diaria**, **Flujo de Volumen**, y **Acción del Precio** en un único panel de control que no se repinta. Le ayuda a identificar Reversiones de alta probabilidad y Breakouts potentes sin el retraso de los indicadores tradicionales.
### Ventajas clave
* **No Lag, No

Indicador de Sesión MT5: Siga las horas de los mercados globales con precisión Impulse su estrategia de negociación con este indicador de sesión GRATUITO para MetaTrader 5 , diseñado para ayudarle a identificar sin esfuerzo las sesiones de negociación activas en los mercados mundiales. Perfecto para los operadores de divisas, acciones y materias primas, esta herramienta destaca las horas clave del mercado (asiático, europeo, norteamericano y superposiciones) directamente en su gráfico, asegurand
FREE

OrderFlow Vision - Visualizador de la estructura del mercado institucional OrderFlow Vision es un indicador de Smart Money Concepts (SMC) diseñado para detectar y visualizar automáticamente la estructura de precios institucional directamente en el gráfico.
Identifica y marca los Bloques de Órdenes , las Brechas de Valor Justo (FVGs) , las Rupturas de Estructura (BOS) y los Cambios de Carácter (CHOCH) en tiempo real, ayudando a los operadores a entender cómo se mueve el precio en relación con la
FREE
Indicador de Media Móvil Adaptativa de Regularidad de Tendencia para MT5
Indicador TRAMA para MT5 Visión general
La Media Móvil Adaptativa de Regularidad de Tendencia (TRAMA) es una media móvil adaptativa inteligente que ajusta dinámicamente su sensibilidad basándose en la estructura del mercado y la consistencia de la tendencia. A diferencia de las medias móviles estándar, TRAMA reacciona a la frecuencia con la que se forman nuevos máximos o mínimos dentro de un periodo definido, proporcionan

DESCRIPCIÓN:
-----------
KS Dynamic Trendlines es un indicador avanzado que detecta automáticamente los puntos de oscilación
y traza líneas de tendencia inteligentes que se adaptan a las condiciones del mercado en tiempo real.
CARACTERÍSTICAS PRINCIPALES:
------------
Detección automática de máximos y mínimos de oscilación
Generación dinámica de líneas de tendencia que conectan los puntos de oscilación
Detección de ruptura en tiempo real - las líneas de tendencia rotas desaparecen automáticame
FREE

ZPOWER INDICADOR DE COMPRA Y VENTA
Opere con inteligencia. Opere con confianza. Opere con rentabilidad.
¿Está cansado de dudar de sus operaciones? ¿Entras tarde y sales demasiado pronto, dejando dinero sobre la mesa? Ha llegado el momento de actualizar su estrategia con ZPOWER BUY & SELL INDICATOR, creado con una lógica de nivel institucional que le ayuda a detectar con precisión las configuraciones comerciales de alta probabilidad.
Por qué ZPOWER es diferente
A diferencia de los indicadore
FREE

Triángulo Patrón Gann v3.1 - Complete Feature Documentation Core Functionality OverviewTriangle Pattern Gann v3.1 es un sofisticado indicador de MetaTrader 5 que combina los principios geométricos de comercio de W.D. Gann con el reconocimiento avanzado de patrones de triángulo para entregar señales de comercio accionables. Primary Features1. Sistema de detección de patrones de triánguloReconocimiento de triángulo ascendente
Función: Identifica automáticamente los patrones de continuación a
FREE

Indicador Macd altamente configurable.
Características: Funciones de alerta altamente personalizables (en niveles, cruces, cambios de dirección vía email, push, sonido, popup) Capacidad multi timeframe Personalización del color (en niveles, cruces, cambios de dirección) Opciones de interpolación lineal y modo de histograma Funciona en el probador de estrategias en modo multi timeframe (también en fin de semana sin ticks) Niveles ajustables Parámetros:
Stochastic RSI Timeframe: puede establecer
FREE
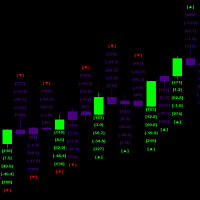
Este indicador ayuda a identificar el inicio de movimientos significativos del mercado mediante el análisis de patrones de velas y su fuerza relativa en la acción del precio .
el indicador ejecuta múltiples cálculos simultáneos cada milisegundo y también hace una triple verificación histórica con el fin de calcular las probabilidades futuras el procesamiento histórico tiene que ser completado antes de que el nuevo Candlestick pueda ser procesado como un conjunto total de la historia total dispo
FREE

El Top and Bottom Identifier Pro es la herramienta esencial para los operadores que utilizan el análisis técnico y la acción del precio como base para sus decisiones. En MetaTrader 5, comprender la estructura del mercado -si el precio está haciendo máximos o mínimos más altos o más bajos- es el primer paso hacia el éxito. Este indicador automatiza este proceso, eliminando la subjetividad y permitiéndole visualizar los puntos de inflexión del precio con claridad inmediata.
FREE
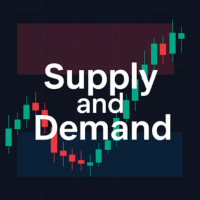
Este indicador ayuda a trazar zonas de oferta y demanda basadas en los conceptos de las TIC. Los operadores pueden personalizar el color de las zonas de oferta y demanda. Por defecto, la demanda es roja y la oferta azul. La forma recomendada de operar por ICT es comprar en la zona de demanda y vender en la zona de oferta. No olvide tener en cuenta otras confluencias a la hora de operar. Tenga en cuenta que es posible que las zonas de oferta y demanda se solapen. En tales casos, recomendaría abst
FREE

Si le gusta utilizar las Medias Móviles tradicionales (como las SMAs y las EMAs) para proporcionar a sus operaciones niveles dinámicos de Soporte y Resistencia, le encantará la Media Móvil Adaptativa (AMA). Creada en 1995 por Perry Kaufman y presentada al mundo en su libro "Smarter Trading : Improving Performance in Changing Markets ", la Media Móvil Adaptativa (también conocida como KAMA - Kaufman Adaptive Moving Average) tiene como objetivo ser la compañera perfecta para seguir una tendencia s
FREE

Un indicador combinado de dos indicadores famosos: RSI , Bandas de Bollinger Se puede utilizar en todos los pares de divisas Se puede utilizar en todos los marcos de tiempo con muchas señales Muy simple y rápido de usar
Descripción:
Este indicador está hecho de la combinación de indicadores RSI y Bandas de Bollinger
Como puede ver, muestra buenas señales y vale la pena usarlo y probarlo
Esperamos que esté satisfecho con este indicador
Ajustes: show past show candle: Muestra el número de vela
FREE
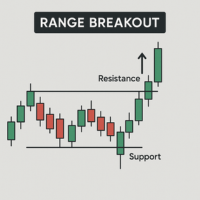
If you love this indicator, please leave a positive rating and comment, it will be a source of motivation to help me create more products <3 Principales conclusiones Dibuja automáticamente los límites superior e inferior del rango para el periodo de tiempo elegido. Alerta cuando el precio rompe por encima o por debajo del rango definido. Soporta el envío de notificaciones vía alerta, email, notificación cuando se produce una ruptura. Se puede utilizar como señal comercial en estrategias basadas
FREE

El indicador Supertrend es una herramienta de análisis técnico de seguimiento de tendencias diseñada para ayudar a los operadores a identificar la dirección de las tendencias del mercado y los posibles puntos de entrada/salida. Funciona basándose en los datos de precios y en el Average True Range (ATR) para crear una línea de señal dinámica que cambia de color en función de la tendencia actual. Color verde: indica una tendencia alcista. Color rojo: indica una tendencia bajista. La supertendencia
FREE

MEDIA MÓVIL RIBBON Ritz MA Ribbon Dynamics - El visualizador de tendencias de última generación Ritz MA Ribbon Dynamics es un sistema futurista de medias móviles multicapa diseñado para visualizar el impulso de la tendencia, el equilibrio de la volatilidad y el ritmo del mercado en una cinta adaptable.
Diseñada para los operadores modernos que exigen claridad, flexibilidad y automatización, esta herramienta transforma la visualización clásica de la media móvil en un marco analítico dinámico. Co
FREE
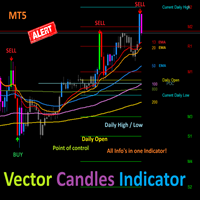
Indicador Vector Candles Esta es una herramienta fácil y segura para MetaTrader 5 (MT5). Colorea las velas en su gráfico basándose en el volumen de operaciones para detectar cambios de tendencia. Vela Vectorial Alcista: Si una vela verde con alto volumen cierra (color lima o azul), venda. Es probable que el precio retroceda hasta el punto de inicio de la vela. Vela de vector bajista: Si una vela roja con alto volumen cierra (color rojo o púrpura), comprar. Es probable que el precio vuelva a sub
FREE

John Bollinger creó este indicador en 2010 como una forma de leer el indicador original (Bandas de Bollinger) de una manera más "técnica", mostrado como un oscilador. El rango típico de las Bandas de Bollinger %B es 0 - 0,5 - 1,0, donde "0" representa la banda inferior, el "0,5" la banda media, y "1" la banda superior. La línea del indicador representa los precios de cierre. Así de sencillo.
AJUSTES
Periodo de análisis de las Bandas de Bollinger Multiplicador de la desviación estándar Desplazam
FREE

Porque el estilo importa
Sé lo molesto que es hacer clic en las propiedades cada vez para cambiar el color de la vela, el fondo a claro u oscuro, y poner o quitar la rejilla. Aquí está la solución con un solo clic: Tres botones personalizables para elegir el estilo de vela que quieran los comerciantes. Un botón para cambiar entre el modo Día y Noche. Un botón para mostrar u ocultar la rejilla en los gráficos. *****En la configuración, puede elegir dónde se mostrarán los botones en la pantalla
FREE

50% de descuento. Precio original: 60 El indicador de Zonas de Soporte y Resistencia para MT5 es un panel multi-marco de tiempo y alerta que encuentra zonas de soporte y resistencia y puntos de pivote para todos los marcos de tiempo de MetaTrader 5 y da alerta cuando el precio tiene interacción con ellos. Descargar versión demo (funciona con los símbolos GBPUSD, EURJPY y NZDUSD) Lea la descripción completa de los parámetros del escáner en la página del blog . Muchas características únicas en un

Estructura del mercado interno y externo (CHoCH/BoS) Descripción: Indicador de mercado Estructura Interno y Externo (CHoCH/BoS) es una potente herramienta de análisis de la Estructura de Mercado (EM) que identifica y visualiza automáticamente los puntos clave de giro (oscilaciones) y las rupturas de estructura en dos escalas temporales/profundidades diferentes: Interna y Externa . Utiliza los conceptos de Cambio de Carácter (CHoCH) y Ruptura de Estructura (BoS ) de la metodología Smart Money Con
FREE

1. Visión general El indicador Scalping PullBack Signal es una potente herramienta de análisis técnico diseñada para ayudar a los operadores a identificar oportunidades de scalping basadas en posibles señales de retroceso y reversión. Esta herramienta es especialmente útil en plazos más cortos (inferiores a 15 minutos), pero también puede aplicarse en plazos más largos para operaciones a más largo plazo. Este indicador integra varios componentes analíticos clave, proporcionando una visión comple
FREE
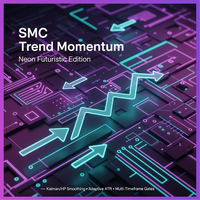
SMC Tendencia Momento SMC Trend Momentum es un oscilador de tendencia que se muestra en una ventana independiente. Combina el sesgo de posición de Donchian con la normalización de tramo ZigZag en una señal suavizada de forma adaptativa. Un histograma codificado por colores con estados de preaviso y aviso facilita la evaluación visual de los cambios de dirección e impulso. Se puede utilizar como filtro la alineación opcional de fotogramas de tiempo superior (H1/H4). Características Oscilador de
CandleStick Patterns Indicator para MT5 - Escáner profesional de patrones Incorpore el análisis probado de velas a su flujo de trabajo. Este indicador escanea automáticamente su gráfico y destaca los patrones de reversión y continuación de alta calidad, para que pueda reaccionar más rápido y con más confianza. Consulte la sección "Más de autor" en la página Mercado para ver nuestra gama completa de indicadores. Qué hace Escanea velas históricas y reales desde un rango de retroceso definido por e

Análisis de Volatilidad Cuántica y Detección de Regímenes de Mercado Schrödinger Market Wells (SMW) ofrece un enfoque alternativo al análisis técnico tradicional. A diferencia de las bandas de volatilidad estándar que se basan únicamente en desviaciones estadísticas simples, el SMW modela la acción del precio utilizando principios de Mecánica Cuántica Financiera . Este indicador interpreta el precio como una partícula interactuando dentro de un "Pozo de Potencial", permitiendo a los traders visu

Esto es sólo un MACD con múltiples símbolos, múltiples marcos de tiempo y múltiples colores. características. Diferentes símbolos y marcos temporales desde el gráfico principal. Dibuja la línea principal, la línea de señal y el histograma. cada línea se puede borrar. se puede distinguir la subida y la bajada. Debido a las características anteriores, este MACD es adecuado para múltiples alineaciones en un solo gráfico. Se puede utilizar de la misma forma que las MiniCandles.
FREE

Presentamos Volume Orderflow Profile , una herramienta versátil diseñada para ayudar a los operadores a visualizar y comprender la dinámica de la presión de compra y venta dentro de un periodo de referencia específico. ¡Perfecto para aquellos que buscan obtener una visión más profunda del comportamiento del mercado basado en el volumen! Versión MT4 - https://www.mql5.com/en/market/product/122656/ El indicador recopila datos sobre los precios máximos y mínimos, junto con los volúmenes de compra y

El indicador VWAP Session Bands es una potente herramienta diseñada para Meta Trader 5. Este indicador calcula el Precio Medio Ponderado por Volumen (VWAP) y sus bandas de desviación estándar dentro de sesiones diarias personalizables, ofreciendo a los operadores una visión clara de las tendencias de los precios y la volatilidad. A diferencia de los indicadores VWAP tradicionales, garantiza líneas suaves y continuas a través de los límites de sesión utilizando los valores de la vela anterior par
FREE

Velas Shadow System - Sistema de visualización de tendencias
Concepto. Se acabó disparar en la oscuridad. Equipa al mercado con visión nocturna".
Shadow System Candles es el sistema visual central del proyecto de trading FX Shadow Operation. Basado en la lógica de la IA (toma de decisiones integrada de ADX y medias móviles), elimina el ruido y visualiza la "verdadera dirección de la tendencia" del mercado con los colores de las velas.
*Esta herramienta no genera señales de flechas. La herram
FREE

PUMPING STATION – Tu estrategia personal "todo incluido"
Te presentamos PUMPING STATION, un indicador revolucionario para Forex que transformará tu forma de operar en una experiencia emocionante y eficaz. No es solo un asistente, sino un sistema de trading completo con potentes algoritmos que te ayudarán a operar de forma más estable. Al comprar este producto, recibes GRATIS: Archivos de configuración exclusivos: para una configuración automática y un rendimiento óptimo. Manual en video paso a
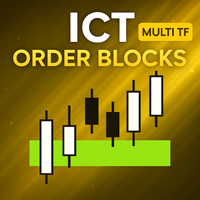
[ Versión MT4 ] [ Kill Zones ] [ Divergencias SMT ] Cómo operar con bloques de órdenes: Haga clic aquí Rendimiento de la interfaz de usuario: Durante las pruebas en el probador de estrategias, la interfaz de usuario puede experimentar retrasos. Tenga la seguridad de que este problema es específico del entorno de pruebas y no afecta al rendimiento del indicador en operaciones reales. Eleve su estrategia de negociación con el indicador Order Blocks ICT Multi TF , una herramienta de vanguardia dise

ICT Unicorn Killer - Detector Completo de Inversión de Liquidez IMPORTANTE: Utilizar en combinación con el Multi-Time-Frame 'Unicorn Hunter' (escáner) para un sistema completo de detectar y matar. https://www.mql5.com/en/market/product/153999
Unicorn Killer identifica configuraciones de reversión de dinero inteligente de alta probabilidad mediante la combinación de cinco confluencias técnicas clave en una herramienta visual optimizada: Fractales → Barrido de liquidez → Ruptura de estructura
FREE

Cybertrade Canales Keltner - MT5 Creado por Chester Keltner, es un indicador de volatilidad utilizado por el análisis técnico. Permite seguir la tendencia de los precios de los activos financieros y generar patrones de soporte y resistencia. Además, las envolventes son una forma de seguir la volatilidad para identificar oportunidades de compra y venta de estos activos.
Funciona en periodos más largos que el periodo visible en el gráfico. Todos los valores están disponibles en forma de buffers
FREE

Canal simple ATR (Average True Range) para encontrar su Stop Loss y/o Take Profit. El indicador permite dibujar un segundo multiplicador si necesita diferentes valores para SL y TP. Deje el segundo multiplicador a 0 si no lo utiliza.
Ajustes + Longitud
+ Suavizado
+ Multiplicador #1 (por defecto 1.5)
+ Multiplicador #2 (poner a 0 si no se usa)
+ Precio alto
+ Precio bajo
+ mostrar línea de precio
+ los colores se pueden cambiar
Por favor, deje sus deseos en los comentarios. Los comentarios ta
FREE

El indicador GomerAI REGIME es un indicador de clasificación de las condiciones del mercado para MetaTrader 5, diseñado para ayudar a los operadores a comprender en qué tipo de entorno de mercado están operando. En lugar de generar señales de trading o ejecutar operaciones, REGIME analiza el comportamiento del precio en tres dimensiones (fuerza de la tendencia, volatilidad y comportamiento del rango) para clasificar el mercado actual en uno de tres regímenes claramente definidos: TRANQUILO: Baj
FREE
BoxLevels Pro — Rango del día anterior y rupturas
BoxLevels Pro traza automáticamente el rango del día anterior (máximo/mínimo) con una línea media y etiquetas, y detecta rupturas en la sesión siguiente con flechas direccionales. Es una herramienta limpia y rápida para estrategias de rango, breakout y reversión en Forex, índices, metales y CFDs. Por qué funciona
El rango de ayer actúa a menudo como zona clave de liquidez. La primera ruptura clara en la sesión siguiente puede generar volatilida
FREE

Indicador Avanzado de Calendario Económico Este indicador muestra directamente en el gráfico todos los eventos económicos futuros relevantes para el par o instrumento seleccionado, permitiendo anticipar momentos de alta volatilidad y planificar las estrategias de trading con mayor precisión. Características principales Visualización de eventos futuros hasta 5 días por adelantado (configurable). Filtro por nivel de impacto de la noticia (alto, medio, bajo). Opción de mostrar líneas verticales de
FREE

Este indicador crea un mapa térmico basado en la profundidad de mercado del símbolo actual o de otro símbolo. Otro símbolo es útil cuando se negocia en el mercado de futuros y un contrato tiene una división "mini" y "completa". Por ejemplo, en Brasil (B3 - BMF&Bovespa), WDO y DOL son contratos de futuros Forex de BRL/USD (donde 1 DOL = 5 WDO) y los grandes bancos trabajan principalmente con DOL (donde la liquidez es importante). Por favor, utilice con M1 timeframe , los objetos son demasiado pe

Este Indicador Mt5 Señala cuando hay dos barras de dirección opuesta engullidas por la barra actual. tiene un cruce de medias móviles exponenciales reciente y la barra anterior estaba sobrevendida/comprada Expert Advisor Disponible en Comentarios Versión Gratuita Aquí : https://www.mql5.com/en/market/product/110114?source=Site Alertas completas para mt5 terminal , teléfono , correo electrónico, imprimir en archivo, imprimir en diario Señal de compra ( línea azul ) Cruce ema pasado ( fijad
FREE
Un indicador digital ligero que combina las herramientas de impulso más importantes directamente en el gráfico. Muestra valores en tiempo real de RSI, ADX, +DI, -DI y DI Spread en un formato limpio y compacto, sin dibujar líneas ni objetos gráficos en el gráfico. Diseñado para proporcionar una visión rápida de la fuerza de la tendencia y el equilibrio entre compradores y vendedores, sin necesidad de abrir ventanas de indicadores adicionales. Totalmente personalizable: la fuente, el tamaño y la p
FREE

Indicador Session Break Out – La mejor herramienta para el análisis de sesiones de trading El Indicador Session Break Out es una herramienta avanzada diseñada para ayudar a los traders a monitorear sesiones de mercado y aprovechar estrategias de trading basadas en el tiempo. Los traders profesionales saben que el tiempo es un factor crucial en el mercado Forex, ya que la volatilidad y la fuerza de las divisas varían según la sesión de trading. Con este poderoso indicador, puedes:
Rastrear las se
FREE
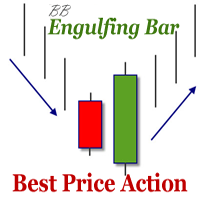
El indicador define la barra envolvente alcista y bajista. El patrón tiene mayor fiabilidad cuando el precio de apertura de la vela envolvente está muy por encima del cierre de la primera vela, y cuando el cierre de la vela envolvente está muy por debajo de la apertura de la primera vela. Para que una barra envolvente sea válida, debe envolver completamente al menos una barra o vela anterior, lo que incluye todo el cuerpo y la mecha. La barra envolvente puede envolver más de una barra siempre qu
FREE

Este indicador de panel de divergencia de múltiples marcos de tiempo y múltiples símbolos envía una alerta cuando se han identificado una o dos divergencias diferentes en varios marcos de tiempo y no en divergencias individuales. Se puede utilizar con todos los marcos de tiempo de M1 a MN. Se pueden mostrar un máximo de 9 períodos de tiempo en el panel de control al mismo tiempo. Es posible habilitar el filtro de tendencia de bandas de media móvil, RSI o Bollinger para filtrar solo las configura

RubdFx Perfect Reversal , El indicador de reversión se utiliza para determinar áreas de soporte y resistencia Dibujando una flecha con un nivel de oferta y demanda (ReversalZones ). -Usted cogerá más oscilaciones reduciendo el período, y menos oscilaciones si usted aumenta el período - Alertas disponibles por móvil , ordenador y correo electrónico . No es empujado por el precio, lo que significa que la flecha se quedará en un solo lugar, adecuado para scalping y el comercio a largo plazo. Tambié

Todo en uno: detección de tendencias, retrocesos y agotamiento
Este indicador es una implementación personal del famoso Traders Dynamic Index, que utiliza RSI, medias móviles y bandas de volatilidad para encontrar tendencias, retrocesos y agotamientos de precios. Sin embargo, esta implementación particular soporta no sólo RSI, sino muchos otros. Es adecuado para scalping, day trading y swing trading y tiene como objetivo proporcionar una imagen completa de las condiciones actuales del mercado.
FREE

El indicador Turtle Trading pone en práctica el sistema de negociación original de Dennis Richards y Bill Eckhart, conocido comúnmente como The Turtle Trader. Este sistema de seguimiento de tendencias se basa en las rupturas de máximos y mínimos históricos para tomar y cerrar operaciones: es totalmente opuesto al enfoque de "comprar bajo y vender alto". La regla principal es "Operar una ruptura de N días y tomar beneficios cuando se rompe un máximo o mínimo de M días (N debe estar por encima de
FREE

Lleve la popular funcionalidad "Crosshair with Magnet Mode" de las modernas plataformas de gráficos directamente a su terminal MetaTrader 5. Crosshair for MT5 es una herramienta de precisión diseñada para los operadores que exigen exactitud. A diferencia de la retícula estándar de MT5, esta herramienta inteligente detecta automáticamente los precios de Apertura, Máximo, Mínimo y Cierre de sus velas. Cuando el ratón pasa cerca de una vela, la retícula "se ajusta" a la mecha más cercana o al preci
FREE

Auto Fibo Expansion es un indicador que proyecta los niveles de expansión de Fibonacci por encima y por debajo del precio de apertura del día. Realiza el cálculo basándose en el día anterior y proyecta los niveles en el día actual. Es muy eficaz para encontrar zonas "psicológicas" de soporte y resistencia. Su apariencia es totalmente configurable y puedes establecer hasta 30 niveles diferentes. Disfrútelo. Este es un indicador gratuito, pero me llevó horas desarrollarlo. Si quieres pagarme un ca
FREE

KT Trend Trading Suite es un indicador multifuncional que combina una estrategia de seguimiento de tendencias con múltiples puntos de ruptura como señales de entrada.
Una vez que se establece una nueva tendencia, el indicador proporciona varias oportunidades de entrada para aprovecharla con éxito. Se utiliza un umbral de retroceso para evitar señales de entrada poco significativas.
La versión para MT4 está disponible aquí https://www.mql5.com/en/market/product/46268
Características
Combina
¡Es nuestro aniversario! Para devolvérselo, disfrute de este descuento del 60% durante la próxima semana (precio original 239 $)
Hemos combinado todos nuestros queridos indicadores como: Key level order block , Key level supply and demand , Key level liquidity grab y Key level wedge en un único indicador y cuadro de mandos.
Novedades Cuadro de mandos : Hay un tablero de fácil acceso para todas sus necesidades. Botón Multi-timeframe : Ahora hay una opción multi-marco temporal para los Bloques d

El Contador de Barras de Amiguinho es un indicador de la acción del precio para mostrar el conteo de barras (velas) con algunas opciones interesantes.
Sobre el parámetro "Período de análisis si el marco de tiempo actual está en minutos, entonces el período de análisis se considerará en días; si el timeframe actual está en días, entonces el periodo de análisis se considerará en meses; o si el periodo de análisis se considerará en años.
FREE

El indicador Separadores de periodos separa periodos de tiempo, especificados por el usuario.
Admite todos los marcos temporales, mayores o alícuotas al marco temporal actual. En caso de un período incorrecto, el indicador lo modifica al valor correcto más cercano. Bonificación adicional - la separación de los períodos de tiempo no estándar - MOON, MOON/2, MOON/4 (fases lunares). Los separadores se trazan utilizando los buffers del indicador. El indicador utiliza un objeto gráfico para la inform
FREE

Mejore su estrategia de seguimiento de tendencias con UCS_RH_IRB (Rob Hoffman Inventory Retracement Bar) MT5 , un indicador de precisión que identifica las velas que retroceden un 45% o más en contra de la tendencia predominante, destacando los puntos en los que la actividad institucional contra-tendencia suele disminuir y el movimiento dominante se reanuda. Basado en la conocida metodología IRB de Rob Hoffman, este indicador ofrece confirmaciones visuales claras para configuraciones de continu

Nota del Desarrollador:
Esta es la versión lite del Indicador Doble TMA con Bandas.
Usted puede encontrar la versión de pago que viene con alertas y flechas de señal en pantalla incorporadas aquí .
También voy a vender un EA basado en este sistema de comercio pronto una vez que todos backtesting y optimización se han completado.
¡Libere su potencial de trading con el Indicador de Doble TMA con Detección de Reversión!
Diseñado para swing y reversal trading, esta versátil herramienta integra
FREE

Introducción a Fractal Pattern Scanner El indicador fractal se refiere al indicador técnico que hace uso de la geometría fractal que se encuentra en el mercado financiero. Fractal Pattern Scanner es un indicador fractal avanzado que incorpora la última tecnología de negociación tras un exhaustivo trabajo de investigación y desarrollo de la geometría fractal en el mercado financiero. La característica más importante de Fractal Pattern Scanner es la capacidad de medir la probabilidad de punto de i
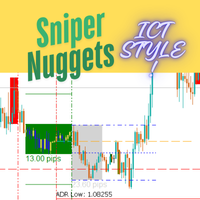
¡¡¡¡¡¡¡¡!!!!!!!! Sniper Nuggets !!!!!!!!
Sniper Nuggets es un indicador todo en uno para muchas cosas del estilo de las TIC. Incluye las siguientes funcionalidades: Periodos personalizados : que le permiten establecer horas de inicio y fin de periodo diario personalizadas a su gusto. Marcadores ADR : que traza el rango medio diario. Worktime : que traza las distintas casillas del gráfico para el rango de Asia (incluidos sus puntos máximo, mínimo y medio, y las predicciones de desviación estánd
FREE

Este indicador es la versión mql de las Velas Heiken Ashi Suavizadas . Find out more here: https://www.mql5.com/en/users/rashedsamir/seller Los gráficos Heikin-Ashi se asemejan a los gráficos de velas , pero tienen una apariencia más suave ya que siguen un rango de movimientos de precios, en lugar de seguir cada movimiento de precios como con las velas.
Debido a que las velas Heikin Ashi se calculan en base a promedios, las velas tendrán sombras más pequeñas que las velas japonesas normales.
FREE

Este es un indicador para el patrón Quasimodo o Over and Under. Encuentra automáticamente los puntos de oscilación e incluso puede colocar operaciones virtuales con stop loss y take profit. Pulse el botón "Optimizar" para encontrar automáticamente la configuración más eficaz. El patrón consta de cuatro patas A,B,C,D como se muestra en las imágenes. Los precios de apertura y cierre de las operaciones virtuales son el precio Bid, pero las estadísticas del panel de visualización tienen en cuenta el
FREE

Si tiene la oportunidad de leer el libro "Trend Trading - A Seven-Step Approach to success " de Daryl Guppy, tendrá una gran cantidad de información sobre cómo "leer" el mercado. En su libro, Daryl muestra, entre otras cosas, cómo podemos utilizar una herramienta visual para medir la volatilidad y la tendencia entre períodos de largo y corto plazo: El GMMA - Guppy Multiple Moving Averages .
En lugar de utilizar su idea original de tener 12 Medias Móviles Exponenciales en tu gráfico - que podría
FREE

Estructura del mercado Altas y bajas Visión general:
Market Structure Highs and Lows es un indicador profesional que detecta y visualiza automáticamente los puntos clave de la estructura de precios: máximos superiores (HH), mínimos superiores (HL), máximos inferiores (LH) y mínimos inferiores (LL). Ayuda a los operadores a ver claramente la dirección de la tendencia, los retrocesos y el flujo del mercado a través de una estructura ZigZag limpia. Cómo funciona:
El indicador analiza los puntos
FREE

Este indicador encuentra patrones Three Drives. El patrón Three Drives es un patrón de inversión de 6 puntos caracterizado por una serie de máximos más altos o mínimos más bajos que se completan en una extensión de Fibonacci del 127% o del 161,8%. Señala que el mercado está agotado y que puede producirse una inversión. [ Guía de instalación | Guía de actualización | Solución de problemas | FAQ | Todos los productos ] Tamaños de patrones personalizables
Colores y tamaños personalizables
Periodos
FREE

El indicador muestra gráficos minimizados de cualquier símbolo de cualquier período de tiempo. El número máximo de gráficos mostrados es 28. Los gráficos se pueden ubicar tanto en la ventana principal como en la inferior. Dos modos de visualización: velas y barras. La cantidad de datos mostrados (barras y velas) y los tamaños de los gráficos son ajustables. Para trabajar con un mini chat, primero debe colocar los indicadores deseados en un gráfico regular, luego guardarlo como una plantilla y ap
FREE

Este indicador encuentra Doble techo y Doble fondo Ejemplo : Que es un Doble Tope Cuando el precio establece un nuevo máximo y luego cae, a continuación, revertir a la misma zona de la vela de alta entonces se considera un doble techo válido y viceversa para doble fondo. 1. 1. Traza un máximo y un mínimo en el gráfico visible si ChartChange está establecido en true, de lo contrario busca en la apertura de una nueva barra.
2. 2. Si se encuentra un doble techo y un doble suelo en la ventana visibl
FREE

Escáner de Acción del Precio Koala - Desatando el Poder de la Acción del Precio Introducción: Descubre el nuevo Escáner de Acción del Precio Koala: una herramienta versátil, multimoneda y multitamframe diseñada para detectar patrones esenciales de acción del precio y presentarlos en una tabla de escaneo intuitiva. Resumen: Este indicador va más allá de lo común, ofreciendo a los usuarios la capacidad de identificar patrones clave de acción del precio en múltiples monedas y marcos temporales. Car
FREE

El indicador dibuja la línea de apertura diaria. Parámetros
Desplazamiento GMT (minutos) La zona horaria puede ser desplazada. El valor se da en minutos. Dibuja el precio de apertura de la barra regular más cercana Este parámetro puede ajustar la línea de precio de apertura cuando se utiliza el cambio GMT. Sí - Dibuja la línea de apertura basada en la barra regular más cercana del periodo del gráfico actual. No - Dibuja la línea de apertura basada en la barra más cercana del gráfico M1. Supong
FREE

Cambio en la entrega estatal (CiSD).
Panorama general: El Cambio en la Entrega de Estado (CiSD) es un indicador de microestructura que identifica puntos pivotales críticos en los que el mercado (Algoritmo de entrega de precios) cambia su enfoque direccional de buscar liquidez en un lado del mercado al otro. En concreto, señala una transición de la liquidez impulsada por la compra a la impulsada por la venta. CiSD marca el precio de apertura preciso que señala el cambio fundamental en la estruc
FREE

HiLo Activator es un indicador de análisis técnico desarrollado por Robert Krausz, un reputado trader húngaro con carrera en EE.UU.
Es un indicador de tendencia que le ayuda a predecir el cambio de la tendencia actual. En una tendencia alcista se muestra en la parte inferior de las velas; en una tendencia bajista se muestra en la parte superior.
Su único ajuste es el período de cálculo.
Es posible tener alertas cuando una nueva tendencia comienza. ¡Que lo disfrutes! Este es un indicador gratuito
FREE

Utilizar el oscilador estocástico con una media móvil es una estrategia sencilla pero muy eficaz para predecir una inversión o continuación de tendencia.
El indicador fusiona automáticamente ambos indicadores en uno solo. También le proporciona alertas visuales y sonoras.
Está listo para ser utilizado con nuestro EA programable, Sandbox, que puede encontrar más abajo: Nuestro EA programable: https: //www.mql5.com/en/market/product/76714 ¡Disfrute del indicador!
Este es un indicador gratuito, pe
FREE
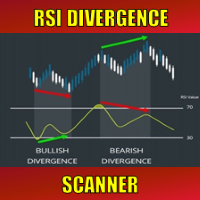
Special offer : ALL TOOLS , just $35 each! New tools will be $30 for the first week or the first 3 purchases ! Trading Tools Channel on MQL5 : Join my MQL5 channel to update the latest news from me En los mercados financieros dinámicos, identificar señales de reversión de tendencia es esencial para una negociación efectiva. RSI Divergence Scanner está diseñado para ayudarle a detectar señales de divergencia RSI en varios pares de divisas y marcos de tiempo de manera precisa y efici
FREE
Compruebe lo fácil y sencillo que es comprar un robot en la MetaTrader AppStore, la tienda de aplicaciones para la plataforma MetaTrader.
El Sistema de pago MQL5.community permite efectuar pagos con ayuda de PayPal, tarjeta bancaria y los sistemas de pago más populares. Además, le recomendamos encarecidamente testar el robot comercial antes de la compra, para así hacerse una idea más completa sobre él.
Está perdiendo oportunidades comerciales:
- Aplicaciones de trading gratuitas
- 8 000+ señales para copiar
- Noticias económicas para analizar los mercados financieros
Registro
Entrada
Si no tiene cuenta de usuario, regístrese
Para iniciar sesión y usar el sitio web MQL5.com es necesario permitir el uso de Сookies.
Por favor, active este ajuste en su navegador, de lo contrario, no podrá iniciar sesión.