Support Resistance Pattern
- Indicadores
- Versión: 1.0
- Activaciones: 5
Support Resistance Pattern se basa en soportes y resistencias para encontrar los puntos en los que la divisa probablemente irá en una dirección definida.
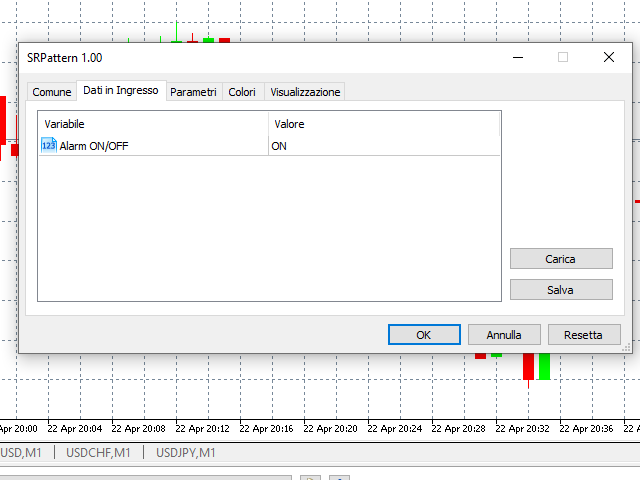
Entradas:
- Alarma ON/OFF: activa o desactiva la alarma en pantalla.
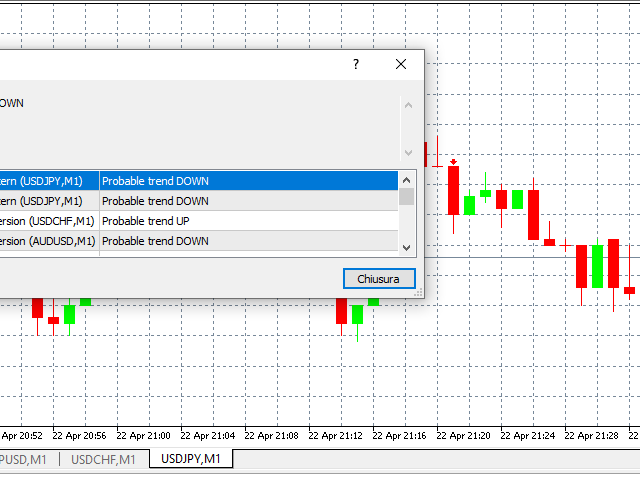
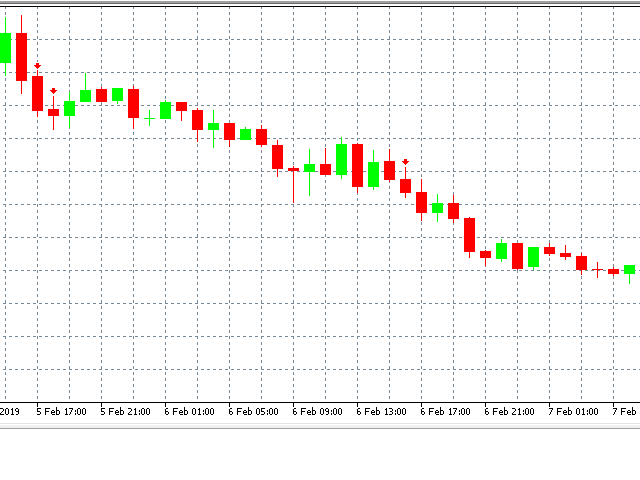
El indicador dibuja una flecha señalando la dirección a seguir basándose en cuando un patrón específico de barras se encuentra cerca de un soporte o una resistencia.
Support Resistance Pattern puede ayudarle a elegir el momento de realizar sus operaciones en una dirección concreta, reforzando su estrategia de trading.