Indicadores técnicos para MetaTrader 5 - 15
El rastreador de velas de marco de tiempo superior se utiliza para obtener una visión de cómo es la vela de marco de tiempo superior seleccionada. Traza la vela después del precio actual. Puede ser útil para los traders diarios y los traders a corto plazo que a menudo se preocupan por el aspecto de la vela del marco de tiempo superior actual. Puede seleccionar el marco de tiempo superior o inferior de las opciones proporcionadas: Por defecto, el color para los osos es rojo y para los toros es ve
FREE

Lleve la popular funcionalidad "Crosshair with Magnet Mode" de las modernas plataformas de gráficos directamente a su terminal MetaTrader 5. Crosshair for MT5 es una herramienta de precisión diseñada para los operadores que exigen exactitud. A diferencia de la retícula estándar de MT5, esta herramienta inteligente detecta automáticamente los precios de Apertura, Máximo, Mínimo y Cierre de sus velas. Cuando el ratón pasa cerca de una vela, la retícula "se ajusta" a la mecha más cercana o al preci
FREE

KT Trend Trading Suite es un indicador multifuncional que combina una estrategia de seguimiento de tendencias con múltiples puntos de ruptura como señales de entrada.
Una vez que se establece una nueva tendencia, el indicador proporciona varias oportunidades de entrada para aprovecharla con éxito. Se utiliza un umbral de retroceso para evitar señales de entrada poco significativas.
La versión para MT4 está disponible aquí https://www.mql5.com/en/market/product/46268
Características
Combina
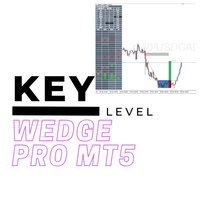
¡Es nuestro aniversario! Para devolvérselo, disfrute de este descuento del 60% durante la próxima semana (precio original 239 $)
Hemos combinado todos nuestros queridos indicadores como: Key level order block , Key level supply and demand , Key level liquidity grab y Key level wedge en un único indicador y cuadro de mandos.
Novedades Cuadro de mandos : Hay un tablero de fácil acceso para todas sus necesidades. Botón Multi-timeframe : Ahora hay una opción multi-marco temporal para los Bloques d

Trend Catalyst Pro Indicador Profesional Multi-Tendencia con Confirmación 7 veces, Alertas Inteligentes, Resumen de Noticias y Panel Integrado para MetaTrader 5. Trend Catalyst Pro combina las señales de siete indicadores de mercado probados en una única puntuación clara. En lugar de analizar cada indicador individualmente, obtienes un resultado visible en la vela del gráfico: Flechas y texto como "6/7 LONG" o "7/7 SHORT" Velas codificadas por colores según la fuerza de la señal Un panel que mu
FREE

Detector de velas envolventes
Patrón detectable Patrones de Velas Dobles Envolvente alcista
La primera vela es negra. La segunda vela se abre con un hueco por debajo del cuerpo real de la vela negra, pero sube hasta cerrar por encima del cuerpo real de la vela negra. En otras palabras, el cuerpo real de la segunda vela envuelve completamente el cuerpo real de la primera vela. Envolvente bajista
La primera vela es blanca. La segunda vela abre con un gap por encima del cuerpo real de la vela bla
FREE
Perfect Day Scalper Pro
Su Rutina Diaria de 5 Puntos para un Ingreso de 5 Cifras.
Precio: $150 USD (Deje de Perseguir, Empiece a Cobrar)
---
Una Operación. Un objetivo. Una vuelta de la victoria. Su día está hecho.
(Olvídese de los sueños de más de 1000 pips que se convierten en pérdidas de más de 100 pips. La verdadera riqueza se basa en la consistencia, no en la complejidad. ¿Qué pasaría si todo su día de operaciones terminara en 15 minutos, con una sola operación de alta probabilidad qu
FREE

Este indicador forma un canal basado en las lecturas del indicador ADX (índice de movimiento direccional promedio), muestra e informa al comerciante de una reversión del precio en los límites de este canal y también puede informar cuando el precio toca los límites del canal. También dibuja líneas de puntos adicionales, que dependen de las lecturas + DI y -DI del indicador ADX. También tiene una opción para filtrar señales en función de las lecturas estocásticas. El canal dibujado por este indic
FREE
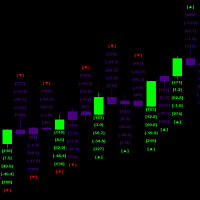
Este indicador ayuda a identificar el inicio de movimientos significativos del mercado mediante el análisis de patrones de velas y su fuerza relativa en la acción del precio .
el indicador ejecuta múltiples cálculos simultáneos cada milisegundo y también hace una triple verificación histórica con el fin de calcular las probabilidades futuras el procesamiento histórico tiene que ser completado antes de que el nuevo Candlestick pueda ser procesado como un conjunto total de la historia total dispo
FREE

N/B : Todos nuestros productos vienen con nuestra compra gratuita ''DAILY SCALPER EA'' - bit .ly/4qlFLNh Desarrollador de Whatsapp para el suyo después de la compra exitosa
EL INDICADOR DE ENTRADA PERFECTA
¡Entrar en operaciones como un profesional con el indicador de entrada perfecta!
No más conjeturas. Sólo precisión. Doble-ZigZag + Confirmación Fractal = Sólo las Configuraciones de Compra y Venta más Fuertes.
¿Está cansado de señales falsas, entradas tardías y confusión interminable e

Introducción a Fractal Pattern Scanner El indicador fractal se refiere al indicador técnico que hace uso de la geometría fractal que se encuentra en el mercado financiero. Fractal Pattern Scanner es un indicador fractal avanzado que incorpora la última tecnología de negociación tras un exhaustivo trabajo de investigación y desarrollo de la geometría fractal en el mercado financiero. La característica más importante de Fractal Pattern Scanner es la capacidad de medir la probabilidad de punto de i

Este indicador encuentra Doble techo y Doble fondo Ejemplo : Que es un Doble Tope Cuando el precio establece un nuevo máximo y luego cae, a continuación, revertir a la misma zona de la vela de alta entonces se considera un doble techo válido y viceversa para doble fondo. 1. 1. Traza un máximo y un mínimo en el gráfico visible si ChartChange está establecido en true, de lo contrario busca en la apertura de una nueva barra.
2. 2. Si se encuentra un doble techo y un doble suelo en la ventana visibl
FREE

INTRODUCCIÓN AL INDICADOR GPT SPIKES El indicador GPT Spikes es una revolucionaria herramienta de negociación diseñada específicamente para los mercados Boom and Crash de la plataforma Deriv. Utiliza algoritmos de última generación para proporcionar a los operadores una visión precisa del mercado, ayudándoles a detectar picos de mercado y puntos de inversión con una precisión sin precedentes. Tanto si es nuevo en el trading como si es un profesional experimentado, el indicador GPT Spikes le ofre
FREE

El indicador ATR Exit utiliza el cierre de la vela + el valor del ATR para trazar líneas de trailing stop (naranja bajo las compras, magenta sobre las ventas) que avanzan con la tendencia hasta que ésta cambia de dirección. Utiliza un múltiplo del Average True Range (ATR), restando su valor del cierre en la compra y sumando su valor al cierre en la venta. Además, las líneas de trailing stop se generan para apoyar la dirección de la tendencia de la orden (larga o corta): En una tendencia alcista
FREE

El indicador de compra y venta Range Filter es una herramienta de análisis técnico de seguimiento de tendencias diseñada para identificar puntos óptimos de entrada y salida en el mercado. Filtra el ruido del mercado creando bandas dinámicas en torno a los movimientos de los precios, generando señales claras de compra y venta cuando el precio atraviesa estas bandas. Características principales Filtrado de rango dinámico : Utiliza un sofisticado algoritmo para calcular bandas adaptativas que se aj
FREE

Configuración gráfica y señales de compra y venta basadas en la estrategia de swing, posición y day trade de Stormer (Alexandre Wolwacz, trader brasileño ), descrita en su canal de youtube ( https://www.youtube.com/watch?v= 0QZ_NjWkwl0).
Las indicaciones de compra y venta se basan en 2 patrones de velas (Inside Bar [Amarillo] y Reversal Closing Price [Azul y Rojo] ), 3 Medias Móviles y 1 Estocástico .
Indicadores: Inside Bar - Patrón de velas que indica la continuidad de la tendencia o un cam
FREE
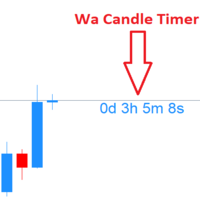
Wa Candle Timer MT5 muestra en el gráfico principal una cuenta regresiva en vivo hasta el cierre de la vela actual. Al acercarse el fin de la barra, el temporizador cambia de color (por defecto cuando ha transcurrido ~95% de la duración de la vela, es decir, ~5% restante).
Indicador ligero, claro e ideal para quienes sincronizan entradas/salidas con el cierre de velas. Funciones clave Cuenta regresiva en tiempo real hasta el cierre del bar para cualquier símbolo y marco temporal. Cambio de color
FREE
Indicador Re verse RSI Signals
El indicador Reverse RSI Signals es una versátil herramienta de análisis técnico diseñada para MetaTrader 5 (MT5). Transforma los cálculos tradicionales del RSI en bandas dinámicas basadas en el precio, integra Supertrend para la identificación de tendencias e incluye la detección de divergencias para posibles señales de inversión. Este indicador superpuesto proporciona información visual y basada en alertas para ayudar a los operadores a detectar condiciones de
FREE

Si le gusta utilizar las Medias Móviles tradicionales (como las SMAs y las EMAs) para proporcionar a sus operaciones niveles dinámicos de Soporte y Resistencia, le encantará la Media Móvil Adaptativa (AMA). Creada en 1995 por Perry Kaufman y presentada al mundo en su libro "Smarter Trading : Improving Performance in Changing Markets ", la Media Móvil Adaptativa (también conocida como KAMA - Kaufman Adaptive Moving Average) tiene como objetivo ser la compañera perfecta para seguir una tendencia s
FREE

Volume Profile Indicator - Guía del usuario Descripción : El Indicador de Perfil de Volumen es una poderosa herramienta diseñada para MetaTrader 5. Visualiza la actividad del mercado mediante la distribución del volumen a través de los niveles de precios, mostrando: Histograma de volumen en cada nivel de precios POC (Punto de Control) - el precio con el mayor volumen negociado Área de valor: el rango que cubre un porcentaje configurable del volumen (por ejemplo, 70%) Niveles de soporte: Mínimo,
FREE

Zenith Session Flux es un indicador técnico de nivel profesional para MetaTrader 5 diseñado para identificar y visualizar las ventanas de negociación institucionales conocidas como ICT Killzones. El indicador automatiza el proceso de alineación temporal sincronizando la hora del servidor de su broker con la hora local de Nueva York, garantizando que los cuadros de sesión y los pivotes de precios aparezcan en los momentos institucionales precisos, independientemente de la zona horaria de su broke
FREE

El indicador Supertrend es una herramienta de análisis técnico de seguimiento de tendencias diseñada para ayudar a los operadores a identificar la dirección de las tendencias del mercado y los posibles puntos de entrada/salida. Funciona basándose en los datos de precios y en el Average True Range (ATR) para crear una línea de señal dinámica que cambia de color en función de la tendencia actual. Color verde: indica una tendencia alcista. Color rojo: indica una tendencia bajista. La supertendencia
FREE
Hull Moving Average (HMA) para MT5 – Indicador de tendencia rápido, suave y sin retraso
Hull Moving Average (HMA) es un indicador de tendencia de alto rendimiento para MT5 que ofrece señales ultra suaves y casi sin retraso. A diferencia de SMA, EMA o WMA, el HMA reacciona de inmediato a los cambios del mercado mientras filtra el ruido — perfecto para scalpers y traders intradía. Construido con un motor eficiente de medias móviles ponderadas, aplica la fórmula original de Alan Hull y genera una
FREE

Magic Candles es un nuevo producto que permite identificar la fase actual del mercado (tendencia alcista, bajista o plana).
Este indicador pinta barras de diferentes colores según el estado actual del mercado y avisa al usuario sobre los cambios de tendencia con alertas.
Magic Candles es perfecto para operar con divisas (incluidas las criptomonedas) y opciones binarias.
Ventajas Adecuado para especulación y comercio intradiario. El indicador no se vuelve a dibujar (recalcula), las señales se

VJ Sniper - MT5 Comprar / Vender Indicador: Este indicador es tan simple como comprar en tendencia alcista y vender en tendencia bajista. Hay niveles Gráficos de Soporte / Resistencia para elegir las mejores Entradas. Antecedentes: Cualquier indicador incorporado de MT5 no funciona como independiente, tales como estocástico, CCI o DeMarker etc. Pero la combinación de ellos con el trabajo de proyección de tendencia y dar los mejores resultados para las entradas de comercio. Así que este indicador

El dibuja líneas de tendencia con ancho de tendencia ajustable, con ajustes de ruptura de tendencia y notificaciones de ruptura de tendencia (Alerta, Sonido, Email) y de una nueva flecha aparecida. Las flechas apuntan a la dirección de la orden a abrir (COMPRA, VENTA).
Parámetros MaxHistoryBars - el número de barras en la historia. Profundidad (0 = configuración automática) - Área de búsqueda. width trend ( 0 = ajustes automáticos) - Ancho de la tendencia. ( true = barras cerradas en dirección

## Daily High Indicador - Danilo Monteiro - MT5
## Descripción El Daily High/Low Labels es un indicador personalizado para MetaTrader 5 que muestra automáticamente los máximos y mínimos diarios en el gráfico, facilitando la rápida identificación de los niveles de precios importantes. El indicador marca los precios con etiquetas y líneas horizontales, permitiendo una clara visualización de los niveles críticos del día actual y del día anterior.
## Características principales
### 1. Etiquetado
FREE

La Divergencia TMA - RSI vista en Trading View ha sido creada para su uso en MT5. La Divergencia TMA RSI es un indicador técnico que combina la TMA ( Media Móvil Triple ) y el RSI (Índice de Fuerza Relativa ) . Es una técnica utilizada para detectar divergencias, cuando el precio y el RSI se mueven en direcciones opuestas . El RSI suele estar suavizado por la TMA y la propia línea de la TMA se utiliza en lugar del RSI , en lugar de fijarse en el RSI por sí solo, para captar los puntos de inflexi
FREE
Indicador CRT Bomb - MT5 Versión Completa El CRT Bomb es un indicador de trading profesional que detecta patrones de inversión de 3 velas de alta probabilidad (CRT - Candle Reversal Technique) en todos los marcos temporales y símbolos. Se recomienda VPS para que no se pierda ninguna configuración CRT a medida que se forman, para las entradas puede utilizar su análisis manual para la confirmación como FVG, OBS, etc. Funciona con todos los Pares, Metales e Índices Características principales: Iden

John Bollinger creó este indicador en 2010 como una forma de leer el indicador original (Bandas de Bollinger) de una manera más "técnica", mostrado como un oscilador. El rango típico de las Bandas de Bollinger %B es 0 - 0,5 - 1,0, donde "0" representa la banda inferior, el "0,5" la banda media, y "1" la banda superior. La línea del indicador representa los precios de cierre. Así de sencillo.
AJUSTES
Periodo de análisis de las Bandas de Bollinger Multiplicador de la desviación estándar Desplazam
FREE

Perfil del volumen de GEN Sessions Promotor: Gede Egi GEN Sessions Volume Profile es un indicador de MT5 diseñado para mostrar la distribución del volumen de cada sesión de negociación (diaria) en forma de Perfil de Volumen . Con esta herramienta, los operadores pueden ver fácilmente en qué niveles de precios se ha producido la mayor actividad de negociación durante una sesión, lo que facilita la identificación de las áreas clave del mercado. El indicador traza automáticamente las Cajas de Sesi
FREE

¡Bienvenido a RSI Colored Candles, un innovador indicador diseñado para mejorar tu experiencia de trading integrando el Índice de Fuerza Relativa (RSI) directamente en tu gráfico de precios! A diferencia de los indicadores RSI tradicionales, RSI Colored Candles utiliza un esquema de cuatro colores para representar los niveles de RSI directamente en tus velas, ¡proporcionándote valiosos insights de un vistazo! Características y Beneficios: Diseño que Ahorra Espacio: ¡Adiós a las ventanas de indic
FREE
El salpicadero definitivo Oferta de Año Nuevo - ahorre $20 (precio normal $79) Los indicadores son útiles para los traders, pero cuando los pones en un tablero que puede escanear 28 símbolos a la vez se vuelven aún mejores, y cuando además puedes combinar diferentes indicadores y marcos temporales para darte alertas sincronizadas, entonces se vuelven increíbles. Este cuadro de mandos fácil de usar le proporciona 32 indicadores principales, utilícelos individualmente o juntos, para crear potentes
Un indicador digital ligero que combina las herramientas de impulso más importantes directamente en el gráfico. Muestra valores en tiempo real de RSI, ADX, +DI, -DI y DI Spread en un formato limpio y compacto, sin dibujar líneas ni objetos gráficos en el gráfico. Diseñado para proporcionar una visión rápida de la fuerza de la tendencia y el equilibrio entre compradores y vendedores, sin necesidad de abrir ventanas de indicadores adicionales. Totalmente personalizable: la fuente, el tamaño y la p
FREE
Este indicador ayuda a trazar zonas de oferta y demanda basadas en los conceptos de las TIC. Los operadores pueden personalizar el color de las zonas de oferta y demanda. Por defecto, la demanda es roja y la oferta azul. La forma recomendada de operar por ICT es comprar en la zona de demanda y vender en la zona de oferta. No olvide tener en cuenta otras confluencias a la hora de operar. Tenga en cuenta que es posible que las zonas de oferta y demanda se solapen. En tales casos, recomendaría abst
FREE

Utazima 001 Indicador AI Sistema Profesional de Estructura de Mercado y Rango de Apertura DEJA DE ADIVINAR. EMPIEZA A OPERAR CON ESTRUCTURA. Utazima 001 Indicador AI es una estructura de mercado de próxima generación & Sistema de inteligencia de rango de apertura , construido para los comerciantes que quieren claridad, precisión y consistencia . Esto no es una herramienta de señal de repintado.
Se trata de lógica de grado institucional , simplificada y automatizada para operadores minoris
FREE

Este indicador encuentra patrones Three Drives. El patrón Three Drives es un patrón de inversión de 6 puntos caracterizado por una serie de máximos más altos o mínimos más bajos que se completan en una extensión de Fibonacci del 127% o del 161,8%. Señala que el mercado está agotado y que puede producirse una inversión. [ Guía de instalación | Guía de actualización | Solución de problemas | FAQ | Todos los productos ] Tamaños de patrones personalizables
Colores y tamaños personalizables
Periodos
FREE

Herramienta que permite ver velas en múltiples marcos temporales. De esta forma, ayuda al análisis en múltiples timeframes.
¡Este es otro producto desarrollado por Renato Fiche Junior y disponible para todos los usuarios de MetaTrader 5!
Parámetros de entrada
- Opción 1 - TimeFrame: MT5 marco de tiempo estándar - Opción 2 - Custom TimeFrame (en minutos): O, si este valor es diferente de cero, el timeframe será personalizado. Esto le permite elegir un timeframe diferente al estándar de MT5. -
FREE

Las sesiones son muy importantes en el trading y a menudo una buena zona donde buscar setup. En SMC, ICT buscaremos la sesión asiática para que sirva de liquidez
Este indicador muestra: Máximo y mínimo de la sesión asiática Línea de apertura de medianoche hora de Nueva York
Congifuración Estilo de la línea, color Posición de la etiqueta, tamaño, color Inicio del nivel (Inicio del día, Inicio de la sesión, Punto más alto o más bajo de la sesión)
Cualquier pregunta o comentario, envíame un mens
FREE
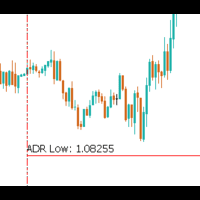
El Average Daily Range (ADR) es una poderosa herramienta para los operadores, especialmente para los que se centran en estrategias intradía y de scalping. Proporciona información valiosa sobre el movimiento de precios esperado para el día y cómo se comporta la acción del precio en relación con las tendencias históricas. El indicador ADR muestra la siguiente información clave: ADR de hoy : El rango típico de movimiento del precio para el día de negociación actual, basado en datos históricos. 3x
FREE

Necesario para los operadores: herramientas e indicadores Ondas calcular automáticamente los indicadores, el comercio de tendencia del canal Perfecta tendencia de onda de cálculo automático de cálculo de canales , MT4 Perfecta tendencia de onda de cálculo automático de cálculo de canales , MT5 Copia local de trading Copia fácil y rápida , MT4 Copia fácil y rápida , MT5 Copia Local Trading Para DEMO Copia fácil y rápida , MT4 DEMO Copia fácil y rápida , MT5 DEMO "Cooperación QQ:556024" "Cooperac
FREE

INDICADOR LIQUIDITY SWEEPS - MT5 Herramienta avanzada Smart Money Concept
VISTA GENERAL
El indicador Liquidity Sweeps es una herramienta de MT5 de nivel profesional diseñada diseñada para identificar las capturas de liquidez institucional y los patrones de stop-hunt. Basado en en
FREE

Deep Momentum Analyzer es un indicador de detección de tendencias impulsado por IA que visualiza el momentum del mercado a través de una pantalla de histograma intuitiva, ayudando a los traders a identificar condiciones de mercado alcistas y bajistas con precisión y claridad. Descripción general El Deep Momentum Analyzer transforma datos de mercado complejos en señales de trading claras y accionables utilizando algoritmos analíticos avanzados. Este indicador de grado profesional brinda a los tra
FREE

El indicador estocástico alerta cuando EA Disponible en comentarios , debe tener el indicador instalado compra la línea principal del estocástico está por encima de la línea de señal estocástico está por debajo de 30 rsi 5 esta por debajo de 20 vender estocastico esta por debajo de la linea de señal estocastico esta por encima de 70 rsi 5 está por encima de 80 AÑADIR al gráfico Estocastico k 30 - d 9 - ralentizacion 3, niveles 30/70 rsi 5 lelels 20.80
Alertas completas push, móvil , email ect T
FREE

Este indicador muestra el nivel de la línea de equilibrio para el número total de posiciones abiertas del símbolo actual con el valor P/L y el volumen total. Este indicador es útil para decidir el nivel de salida cuando se utiliza una estrategia de rejilla de negociación. El estilo de la línea de equilibrio es personalizable para elegir el color, la forma de la línea y el tamaño de la fuente de la descripción de las posiciones. Envía una notificación al móvil cuando se cruza un objetivo P/L pos
FREE

Indicador de número de vela para MetaTrader 5 El indicador de número de vela muestra una etiqueta numérica en cada vela, a partir de la barra más reciente. Esta herramienta ayuda a los operadores a seguir visualmente la progresión de las velas, lo que puede servir de apoyo a estrategias basadas en el tiempo, la estructura o la identificación de patrones.
Características: Numera cada vela desde la barra actual hacia atrás. Permite personalizar el color, la orientación horizontal o vertical del
FREE

Este indicador muestra los puntos pivote en el gráfico, incluidos los valores históricos, y admite muchos modos de cálculo para los puntos pivote y los niveles S/R. [ Guía de instalación | Guía de actualización | Solución de problemas | FAQ | Todos los productos ] Traza niveles históricos para backtesting
Permite seleccionar el marco temporal de referencia Implementa diferentes modos de cálculo de Puntos Pivote Implementa diferentes modos de cálculo de SR
Colores y tamaños personalizables
Modo
FREE
Introducción al Indicador ZigZag Optimized El indicador ZigZag Optimized , desarrollado por MetaQuotes Ltd. y actualizado a la versión 2.00, es una herramienta poderosa de análisis técnico en la plataforma MetaTrader 5. Diseñado para identificar puntos de reversión significativos conectando picos y valles, ofrece a los traders una mayor precisión. Ventajas clave Soporte preciso para divergencias : Ayuda a determinar zonas de precios razonables, siendo altamente compatible con algoritmos de diver
FREE

Canal simple ATR (Average True Range) para encontrar su Stop Loss y/o Take Profit. El indicador permite dibujar un segundo multiplicador si necesita diferentes valores para SL y TP. Deje el segundo multiplicador a 0 si no lo utiliza.
Ajustes + Longitud
+ Suavizado
+ Multiplicador #1 (por defecto 1.5)
+ Multiplicador #2 (poner a 0 si no se usa)
+ Precio alto
+ Precio bajo
+ mostrar línea de precio
+ los colores se pueden cambiar
Por favor, deje sus deseos en los comentarios. Los comentarios ta
FREE

Este indicador combina TRIX (Triple Media Móvil Exponencial) con una Media Móvil, que puede ser simple, exponencial, suavizada o ponderada.
Esta combinación es muy útil para identificar la tendencia principal y cuando está cambiando a una nueva dirección.
El indicador también tiene señales en el gráfico que indica el cruce del TRIX con la Media Móvil, así como alertas emergentes y push (en la app MT5).
¡Disfrútelo!
FREE

Este es el Volume Avarage Weighted Price (VWAP) es un indicador que muestra donde está el promedio de los volúmenes actuales y los niveles en los que el precio se considera premium, por encima de la segunda banda superior, o descuento, por debajo de la segunda banda inferior, también es muy útil para utilizar el nivel de VWAP como un objetivo para las operaciones, ya que es un nivel muy líquido por lo que el precio es atraído a ella. ¡siéntase libre de dejar un comentario ya sea positivo o negat
FREE
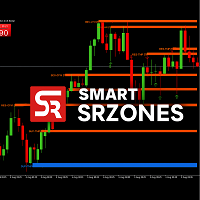
SmartSRZones es un indicador de MT5 diseñado para detectar, mostrar y gestionar automáticamente zonas de soporte y resistencia directamente en el gráfico.
Combina el reconocimiento de la estructura del mercado con la detección de patrones de velas para ayudar a los operadores a ver los niveles de precios importantes sin necesidad de marcarlos manualmente. El indicador es adecuado para diferentes enfoques de trading, incluyendo análisis a corto y largo plazo. Características principales Detecció
FREE

TILLSON MOVING AVERAGE También conocido como indicador TMA o T3. Es una media móvil que utiliza EMA y DEMA en su fórmula y se calcula con una expansión Binomial de 3er grado . ... int handle1; //Handle of the Tillson TMA T3.EX5 custom indicator double euBuff1[]; int TMAperiod= 12 ; int TMSshift= 0 ; double VolumeFactor= 0.618 ; int OnInit () { ... handle1= iCustom ( NULL , PERIOD_CURRENT , "Market\\Tillson TMA T3.EX5" ,0,TMAperiod,0,0,TMSshift,0,0,Volu
FREE

Market Imbalance Detector es un indicador de análisis técnico diseñado para resaltar los desequilibrios de precios, comúnmente conocidos como Fair Value Gaps (FVGs). El indicador detecta las zonas de desequilibrio utilizando una estructura precisa de tres velas y las muestra directamente en el gráfico como zonas visuales. Estas zonas representan ineficiencias de precios que pueden actuar como potenciales zonas de reacción o de interés en futuros movimientos de precios. Características Detecta de
FREE

N/B : Todos nuestros productos vienen con nuestra compra gratuita ''DAILY SCALPER EA'' - bit .ly/4qlFLNh Whatsapp Desarrollador para la suya después de la compra exitosa
OMEGA ONE SPIKE DETECTOR: Captura cada movimiento explosivo / Spikes con precisión quirúrgica
"Solía ver los picos volar - Ahora los atrapo consistentemente usando niveles de orden institucional"
¿OBSERVANDO EL PICO DE 500 PUNTOS y no sacando provecho? ¿entrando demasiado tarde cuando ya se ha producido el gran movimiento? ¿

Este Indicador de Niveles Trimestrales para MQL5 es una sofisticada herramienta de análisis técnico diseñada para capitalizar los "Niveles Psicológicos" o "Números Redondos" en los mercados financieros. Funciona según el principio de que el flujo de órdenes institucionales, los stop-loss y los objetivos de toma de beneficios tienden a agruparse en intervalos matemáticos específicos, concretamente en los números enteros (00 ), los puntos medios (50 ) y los cuartos de punto (25 y 75 ). Al dividir
FREE

OJO!!!
Uno de los mejores indicadores de Breakout de todos los tiempos está aquí. Multi Breakout Pattern mira las velas precedentes y los marcos de tiempo para ayudarle a reconocer las rupturas en tiempo real.
La función incorporada de oferta y demanda puede ayudarle a evaluar su toma de beneficios y Stop losses
VER LAS PANTALLAS PARA PRESENCIAR ALGUNOS DE LOS MEJORES BREAKOUTS
ENTRADAS
MaxBarsback: El máximo de barras para mirar hacia atrás
Longitud lenta 1: Period lookback
Slow length 2
FREE

Heiken Ashi Dynamic es un indicador para MetaTrader 5 que muestra velas Heiken Ashi directamente en tu gráfico. Puedes elegir entre el modo clásico o un modo suavizado, que hace que los cambios de color sean más claros y fáciles de seguir. Los colores son simples: verde para movimientos al alza y rojo para movimientos a la baja. El modo Clásico reacciona rápido y ayuda a detectar giros con más antelación. El modo Suavizado hace que las tendencias largas se vean más limpias y continuas, ajustand
FREE
If you love this indicator, please leave a positive rating and comment, it will be a source of motivation to help me create more products <3 ¿Cómo se utiliza el activador Gann High-Low? El Activador HiLo de Gann ayuda al operador a identificar la tendencia actual del mercado. Cuando el indicador está por debajo del precio de cierre, puede indicar que se está produciendo una tendencia alcista. Por el contrario, cuando el indicador está por encima del precio de cierre, puede indicar una tendencia
FREE
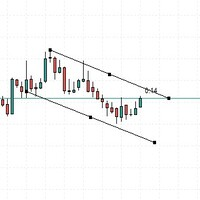
Este indicador sirve para emitir alertas sonoras cuando el precio sobrepasa la línea colocada manualmente. Una herramienta muy útil, que le permite no pasar demasiado tiempo sentado delante del ordenador.
Tenga en cuenta que la alerta emitida siempre se referirá a la vela actual, puede utilizar varias líneas en el gráfico pasado para analizar.
Este indicador siempre recibirá mejores actualizaciones.
FREE

Este es el famoso indicador Sunflower para Metatrader5. Este indicador marca posibles máximos y mínimos en los gráficos de precios. El indicador identifica máximos y mínimos en el historial de precios del activo, tenga en cuenta que el girasol actual de la última vela se repinta, ya que no es posible identificar un máximo hasta que el mercado se invierte y tampoco es posible identificar un mínimo sin que el mercado deje de caer y comience a subir. Si buscas un programador profesional para Metat
FREE

Se trata de uno de los indicadores del índice de volatilidad (VIX ) más populares y mejor valorados del mercado. Proporciona las mismas lecturas que el VIX para los índices bursátiles. Sin embargo, este indicador funciona en todas las clases de activos . VIX Fix encuentra los fondos del mercado. Este indicador no es para operadores inexpertos. Úsalo para day trading y swing trading. MT4 Version - https://www.mql5.com/en/market/product/112238 Únase para aprender la profundidad del mercado -
FREE

Identifique los puntos de inflexión clave con un análisis fractal fiable
Este indicador examina la estructura de precios de fractales de diferentes periodos para determinar posibles puntos de inversión en el mercado, proporcionando sincronización a los operadores posicionales que ya disponen de un modelo de valoración fundamental o técnico. A diferencia de su hermano menor, Reversal Fractals , este indicador no pasará por alto los retrocesos debido al periodo seleccionado, y encontrará fractal

Adaptive Hull MA Pro - Trend & Momentum Filter
Valoramos sus comentarios y creemos que su experiencia con la Media Móvil de Hull (HMA) es esencial para nosotros y para otros operadores. Ayúdenos a seguir mejorando y perfeccionando nuestro producto compartiendo sus opiniones y puntos de vista a través de un comentario.
El Indicador de Media Móvil de Hull (HMA) - ¡Su clave para tendencias más suaves y operaciones rentables! ¿Está cansado de las medias móviles retrasadas y entrecortadas que dific
FREE
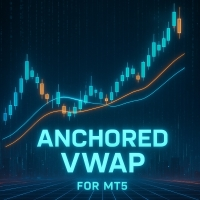
Anchored VWAP (AVWAP) para MT5 Agrega fácilmente múltiples líneas Anchored VWAP en un solo gráfico con anclajes precisos de fecha y hora. Diseñado para traders que buscan un análisis rápido, claro y flexible de los niveles clave de precios. Destacados: Anclar múltiples VWAP por gráfico Configurar fecha y hora de inicio personalizada para cada línea Interfaz intuitiva y fácil de usar Ideal para trading intradía y swing Analiza tendencias, identifica soportes/resistencias dinámicas y toma decision
FREE

Imagine VWAP, MVWAP y MIDAS en un solo lugar... ¡Pues lo ha encontrado! Ahora puede seguir el movimiento de los grandes operadores de varias maneras, ya que en general persiguen los puntos de referencia relacionados con esta medición, calibrando si tuvieron una buena o mala ejecución en sus órdenes. Los operadores y los analistas utilizan el VWAP para eliminar el ruido que se produce a lo largo del día, de modo que puedan medir qué precios están negociando realmente los compradores y los vendedo
FREE

BREAKOUT-SESSION-BOX LONDRES EU US ASIA Open
vigile la expectativa de un movimiento volátil por encima o por debajo del rango de apertura Tomamos el máximo del rango como Entrada para una operación larga y el SL será el mínimo del rango y viceversa, el mínimo del rango como entrada para una operación corta y el máximo para el SL. El tamaño del rango es la distancia al TP (Take Profit) El rango de las horas de apertura no debe ser mayor que aproximadamente 1/3 del rango medio diario 4 ejemplos
FREE

Estructura del mercado interno y externo (CHoCH/BoS) Descripción: Indicador de mercado Estructura Interno y Externo (CHoCH/BoS) es una potente herramienta de análisis de la Estructura de Mercado (EM) que identifica y visualiza automáticamente los puntos clave de giro (oscilaciones) y las rupturas de estructura en dos escalas temporales/profundidades diferentes: Interna y Externa . Utiliza los conceptos de Cambio de Carácter (CHoCH) y Ruptura de Estructura (BoS ) de la metodología Smart Money Con
FREE

Entrada de tendencias premium pro
TZ Trade Logics, le presenta la versión mejorada de la entrada de tendencias Premium
Esta versión le ofrece un estado comercial mucho más relajado con funciones avanzadas para filtrado de tendencias y tiempos de entrada de señales premium.
Para nosotros, ¡no es la creación del producto lo que importa! pero mantenimiento y educación continuos para los usuarios. a través de nuestros medios dedicados para comunicarse con nosotros, disfrutará de una guía detalla
FREE
Oscilador Elliott - Una herramienta de análisis de momento que detecta reversiones de tendencia a través de patrones de convergencia de medias móviles. El indicador muestra histogramas azules para momento alcista e histogramas rojos para condiciones bajistas, mientras dibuja automáticamente líneas de tendencia entre picos y valles significativos. Sistema de Alertas : Elija entre dos modos - Alertas de Barra Actual (alertsOnCurrent = true) se activan inmediatamente en barras en desarrollo pero pu
FREE
MetaTrader Market es el mejor lugar para vender los robots comerciales e indicadores técnicos.
Sólo necesita escribir un programa demandado para la plataforma MetaTrader, presentarlo de forma bonita y poner una buena descripción. Le ayudaremos publicar su producto en el Servicio Market donde millones de usuarios de MetaTrader podrán comprarlo. Así que, encárguese sólo de sus asuntos profesionales- escribir los programas para el trading automático.
Está perdiendo oportunidades comerciales:
- Aplicaciones de trading gratuitas
- 8 000+ señales para copiar
- Noticias económicas para analizar los mercados financieros
Registro
Entrada
Si no tiene cuenta de usuario, regístrese
Para iniciar sesión y usar el sitio web MQL5.com es necesario permitir el uso de Сookies.
Por favor, active este ajuste en su navegador, de lo contrario, no podrá iniciar sesión.