BeST Oscillators Collection MT5
- Indicadores
- Versión: 1.10

BeST_Oscillators Collection es un Indicador Compuesto MT5 que incluye los Osciladores Chaikin, Chande y TRIX de los cuales por defecto los Osciladores Chaikin y TRIX pero no el Oscilador Chande Momentum están contenidos en la plataforma MT5.
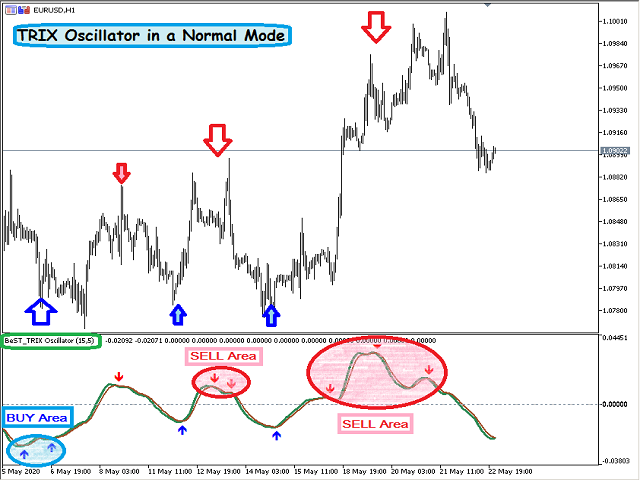
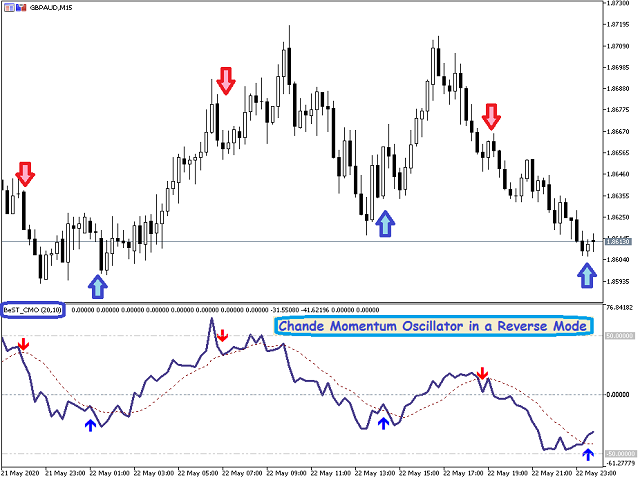
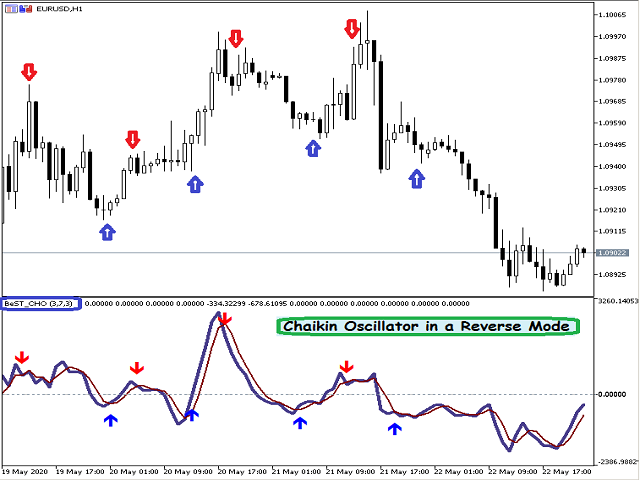
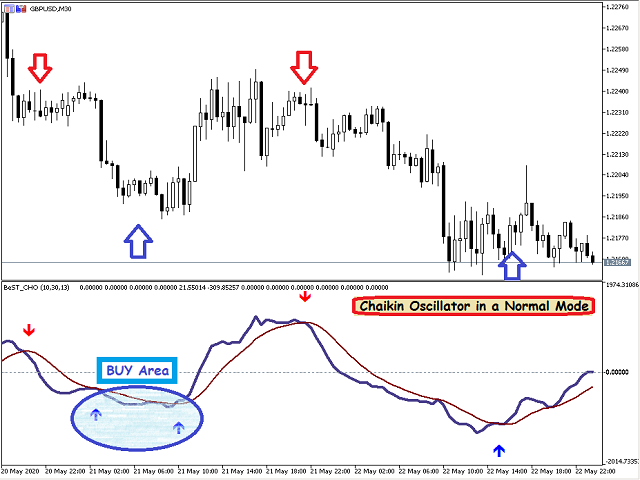
También proporciona para cada Oscilador la opción de mostrar o no un Mov. Average como Línea de Señaly las Señales resultantes como Flechas en Modo Normal (todas las flechas) o en Modo Inverso(sin mostrar ninguna flecha resultante sucesiva y del mismo tipo).
Analíticamente para cada uno de los Osciladores específicos:
El Oscilador Chaikin(CHO) se utiliza para estimar el flujo de dinero midiendo la acción del precio al flujo de dinero inteligente que entra y sale del valor subyacente.No hay
No hay rangos fijos para el CHO, por lo que es más fiable cuando se mueve en la dirección de la tendencia. También puede utilizarse para detectar divergencias en mercados con fuertes tendencias.
El Chande Momentum Oscillator(CMO) oscila entre los límites de -100 y +100, mientras que la zona de sobrecompra se establece en 50 y la de sobreventa en -50. Las señales de compra y venta
pueden generarse por los cruces del CMO de su SMA de 10 barras y también por las divergencias entre el CMO y el precio del valor subyacente.
El oscilador TRIX(TRIX) se utiliza para identificar mercados sobrevendidos y sobrecomprados, pero también como indicador de impulso.TRIX oscila alrededor de una línea cero y cuando se utiliza como oscilador, un valor positivo indica un mercado sobrecomprado, mientras que uno negativo indica un mercado sobrevendido. Como indicador de impulso, un valor positivo indica que el impulso está aumentando, mientras que un valor negativo indica que el impulso está disminuyendo.
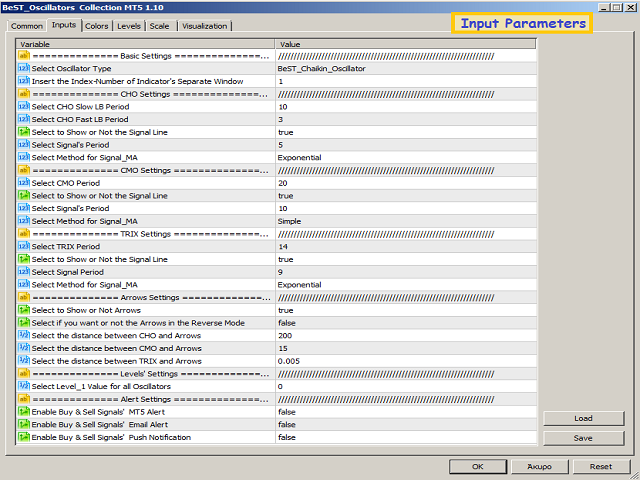
Entradas
Ajustes Básicos
- Seleccionar Tipo de Oscilador - para seleccionar cual de los Osciladores queremos que aparezca.
- Insertar el Índice - Número de la Ventana Separada del Indicador para poner el índice de la ventana separada que utilizamos para el indicador para que funcionen correctamente las líneas de Nivel de los Osciladores.
CHO Settings - Para seleccionar los parámetros que queremos para el Oscilador Chaikin (CHO).
Parámetros CMO - Para seleccionar los parámetros que queremos para el Oscilador Chande Momentum (CMO).
Ajustes TRI X - Para seleccionar los parámetros que queremos para el Oscilador TRIX (TRIX).
Configuración de Flechas
- Seleccionar Mostrar o No Flechas - Para seleccionar si queremos que se muestren o no las Flechas de las Señales de Compra y Venta basadas en los cruces entre el Oscilador y su Línea de Señal.
- Seleccionar si queremos o no las Flechas en Modo Inverso - para seleccionar si queremos que las Flechas aparezcan en Modo Normal (todas las flechas) o en Modo Inverso (sin aparecer flechas resultantes sucesivas y del mismo tipo).
- Seleccione la distancia entre CHO y Flechas para una mejor apariencia.
- Seleccione la distancia entre CMO y Flechas para una mejor apariencia.
- Seleccione la distancia entre TRIX y Flechas para una mejor apariencia.
Configuración de Niveles - Seleccione el Valor de Nivel_1 para todos los Osciladores que por defecto es la Línea Cero.
Para Desarrolladores EA
CHO Flecha de Compra: Buffer = 7
CHO Flecha de Venta: Buffer = 8
CMO Flecha de Compra: Buffer = 11
CMO Flecha de Venta: Buffer = 12
TRIX Compra Flecha: Buffer = 3
TRIX Vender Flecha: Buffer = 4


It is a good indicator for sure. Using it and bringing good experience.