BoxProfile MT5
- Indicadores
-
Evgeny Shevtsov
 Indicators for volume trading :
Volume profile,
Classic profile,
Clusters chart,
Demand and supply levels,
Demand and supply diagram,
Cumulative delta.
Indicators for probabilistic analysis :
Monte Carlo predictor,
Neural predictor. - Versión: 2.5
- Actualizado: 9 noviembre 2024
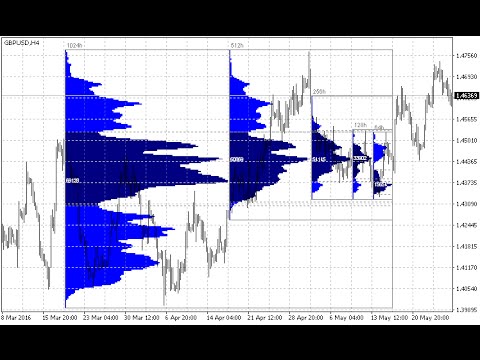
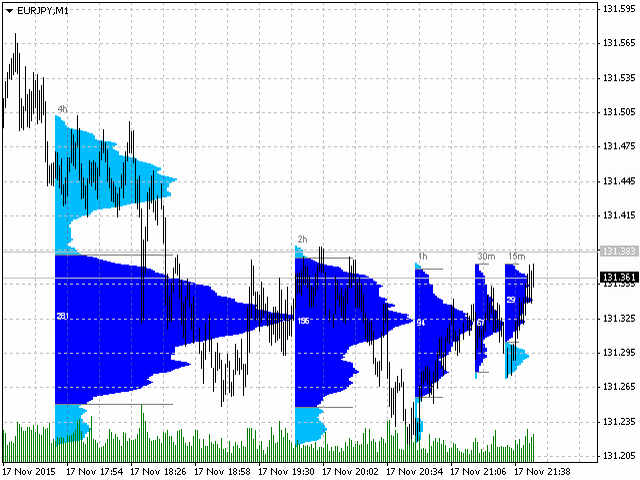
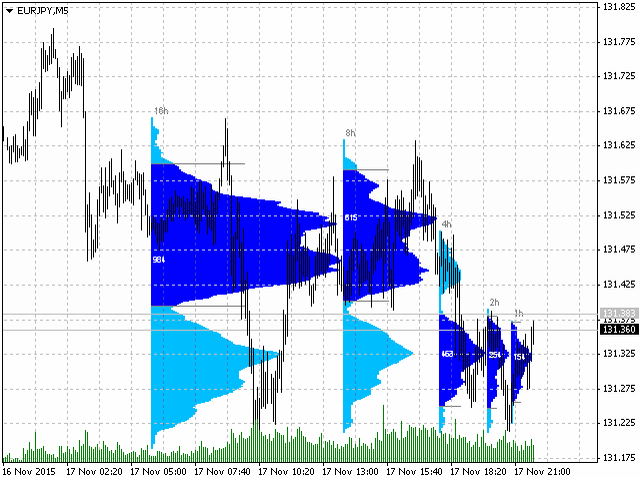
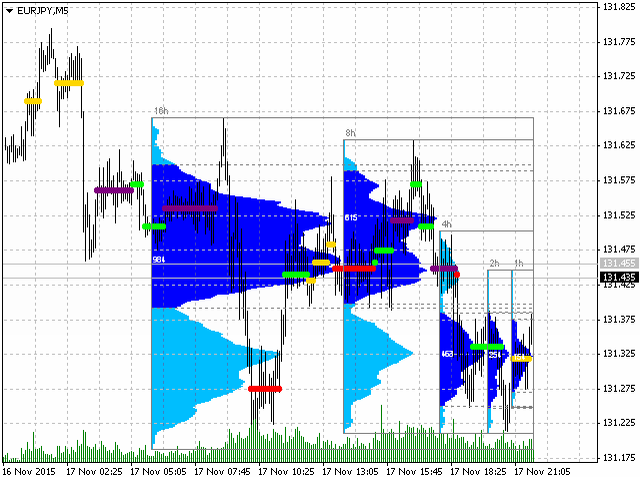
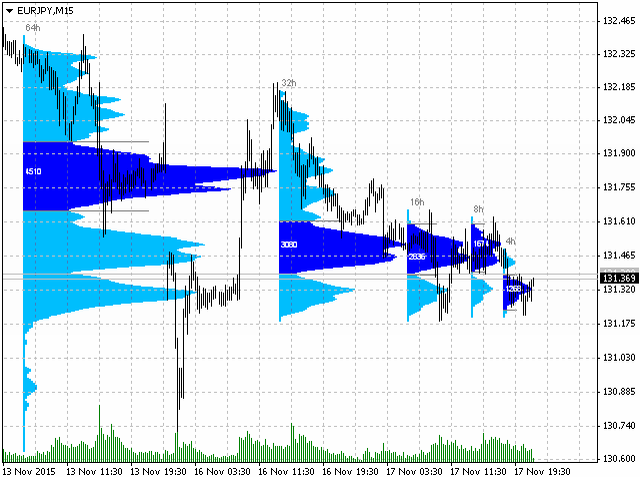
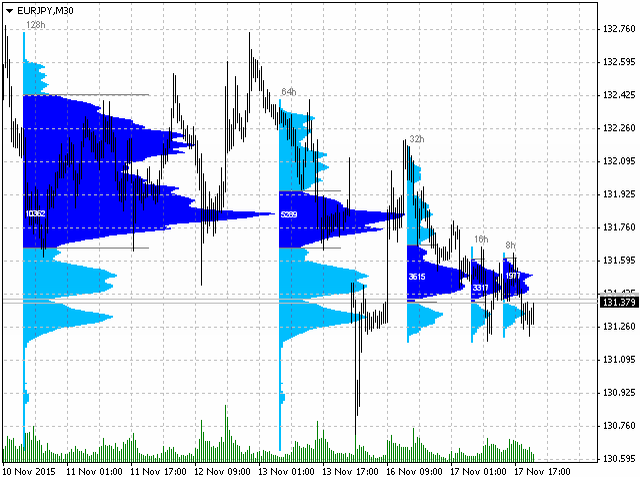
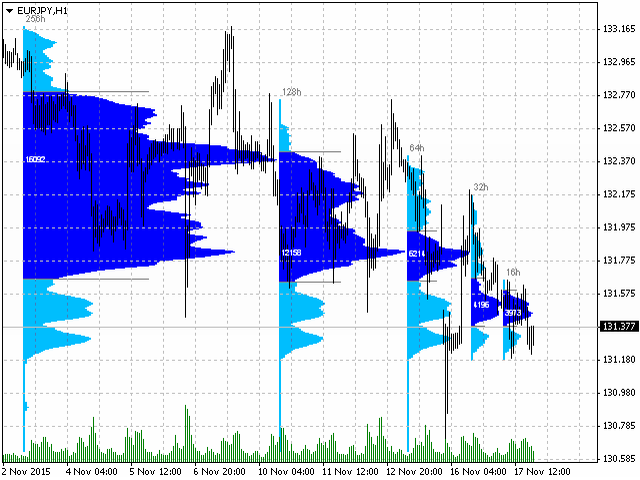
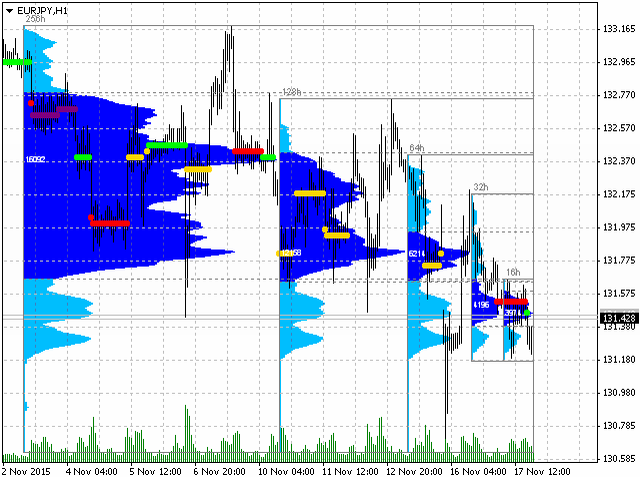
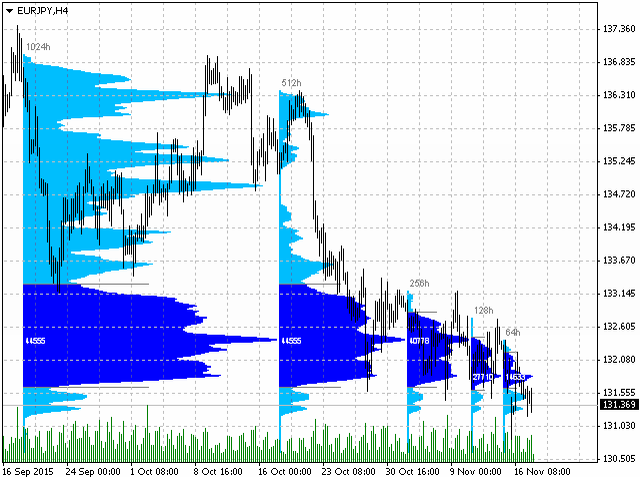
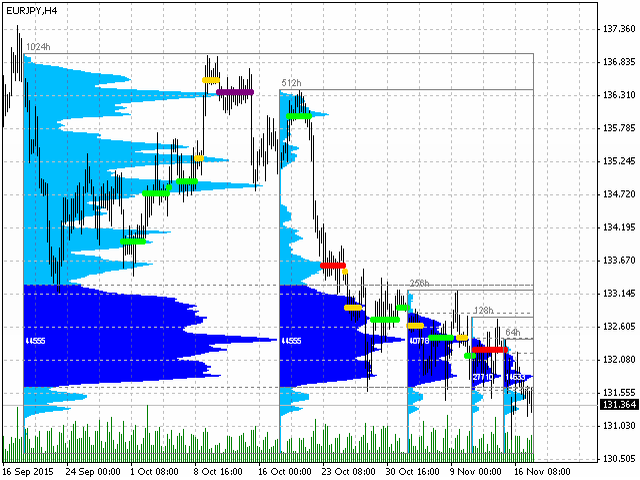
El indicador muestra perfiles de volumen basados en el principio de anidamiento.
Los periodos de los perfiles están preestablecidos de modo que cada perfil subsiguiente tiene una longitud dos veces mayor que la longitud del perfil anterior.
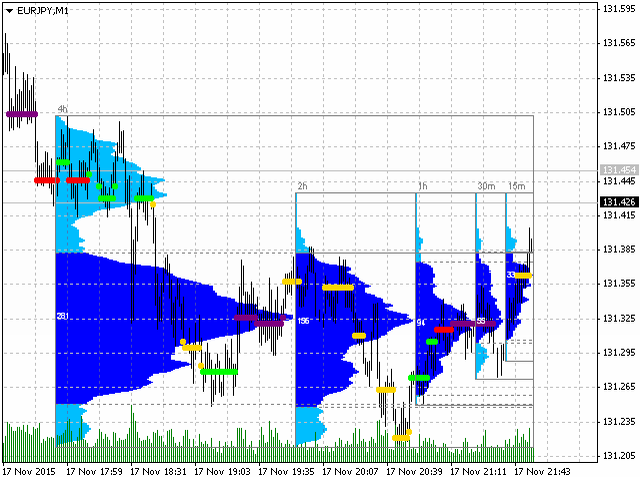
Además de los perfiles, el indicador muestra grupos de volúmenes ordenados por colores, en función del volumen que contengan.
Características de funcionamiento del indicador
El indicador funciona en marcos temporales típicos de M5 a MN, pero para los cálculos utiliza datos históricos de marcos temporales más pequeños:
- M1 - para plazos de M5 a H1,
- M5 -para el timeframe H4 ,
- M30 -para el marco temporal D1 ,
- H4 -para el marco temporal W1 ,
- D1 -para timeframe MN .
El indicador realiza un recálculo completo: cuando cambia la escala del gráfico, cuando el gráfico se desplaza, cuando se cambia el marco temporal y cuando aparece una nueva vela.
Variables de entrada
- ProfileStepPoint - paso de agrupación fijo a lo largo del eje de precios, establecido en puntos "antiguos", es decir, el valor 0,1 corresponde a un punto "nuevo".
- ProfileStepPointPix - paso de agrupación dinámico a lo largo del eje de precios, establecido en píxeles del monitor.
- ProfilePriceArea - tamaño del área de valor.
- ProfileAreaMode - método para calcular elárea de valor:
- OfPocND - distribución relativa al nivel de POC.
- OfTotalVolume - distribución relativa al volumen negociado en el perfil.
- BoxStepPoint - similar a ProfileStepPoint, pero para grupos de volumen.
- BoxStepPointPix - similar a ProfileStepPointPix, pero para grupos de volumen.
- BoxExcessRemove - función que oculta los clusters innecesarios, dejando que sólo se muestren los más importantes.
- BoxDensity - función habilita el modo de cálculo de cluster como concentración de volumen por unidad de tiempo.
- VolumesType - tipo de volúmenes utilizados en los cálculos:
- Tick - volúmenes tick.
- Real - volúmenes reales, si se emiten desde el broker.
- Without -sin volúmenes (los volúmenes se emulan utilizando el principio TPO).
- LowestBoxColor, LowBoxColor, MiddleBoxColor, MediumBoxColor, HighBoxColor, HighestBoxColor - grupo de variables que determinan el color de los clusters, dependiendo del valor del volumen.
Las otras variables de entrada están relacionadas con otros ajustes, y su propósito es claro a partir de sus nombres.


Very Good Indicator. Creates Several Volume Profiles of Greater Size & Detail with unparalleled speed & efficiency. Although it did take me some time to go thru all the settings - at least it always gave me clear feedback to whatever changes i made = Good Programming & so for that, i gave User Support a 5/5 although i never really did ask for any extra help