BNT Account Monitor MT4

BNT Account Monitor MT4

Whole-account monitoring, performance analysis and read-only sharing

User Guide and Required Data Link EA

Download the MT4 Companion EA — BNT Data Link

This product is the MT4 monitoring terminal. Collecting data from an account requires the compatible BNT Data Link companion EA to be installed and running in that account’s MT4 terminal. Download the companion EA using the link above, then follow the setup steps below.

The system requires the compatible BNT data service, an internet connection and active source terminals. BNT Data Link sends account snapshots, position data and available trading history to the configured BNT service. Installation assistance is available through MQL5 private messages and the product comments.

Quick Setup

  1. Install BNT Account Monitor MT4 from your Market purchases and attach it to a chart in the monitoring terminal.

  2. Download and extract the MT4 companion package. Install Data Link and attach it to one dedicated chart in each source account’s terminal. In terminals requiring online access, open Tools → Options → Expert Advisors, enable WebRequest and add the BNT service address used in the product settings. In each source terminal’s Account History tab, select All History and allow the records to load.

  3. Keep Data Link running. Copy its complete account connection code, paste it into the monitor’s Connection window and select Add Account.

  4. Check the connection state, last update and data age. Allow the available trading history to synchronize before reviewing historical results.

Your Accounts in One Workspace

BNT Account Monitor MT4 brings account funds, trading results, risk information and connection health into one dashboard. Connect up to 10 source accounts and use up to 10 separate read-only observation slots.

Monitoring and sharing apply to entire accounts, with no individual EA names or Magic-number configuration required in the monitor.

The standard refresh interval is 10 seconds. Actual data availability depends on the source terminals, network connection and BNT data service.

Account Overview and Details

Review account balance, equity, today’s closed P/L, floating P/L and open-position counts. Filter live and demo accounts, choose the relevant currency group and inspect the equity trend for a selected account or an available all-accounts summary.

Use Account Details to open the selected account’s funds information, trade records and observed cash movements.

Equity history and floating-loss statistics are built from collected data. They do not reconstruct an unobserved historical equity path or fill gaps from periods when data was not collected.

Whole-Account Observation and Sharing

Create an observation code to share an entire account in read-only mode. Viewers can inspect the available account information and results without permission to submit trades or change the source account.

Owners can close sharing at any time. The change takes effect on a viewer’s next successful refresh.

The Total Profit Curve offers All, 90 Days, 30 Days, 7 Days and Today. Available history depends on the source records and compatible service responses.

Use observation codes for account sharing and keep the private terminal backup key confidential. Account connection codes, observation codes and private terminal backup keys serve different purposes and are not interchangeable.

Profit Analytics and Profit Calendar

Review net profit, return, win rate and profit factor. Explore cumulative net profit and daily P/L, compare account contributions and use the monthly calendar to inspect a selected day’s account breakdown.

Trading P/L excludes deposits and withdrawals. History and calendar dates follow the source broker date.

Loading, Pending and unavailable values indicate missing, unsynchronized or insufficient data and should not be interpreted as zero.

Risk Center and Composite KPI

Monitor floating P/L, observed drawdown, margin usage, positions, instrument exposure and display alerts. The Risk Center brings account exposure and feed conditions into view.

When sufficient synchronized history and risk observations are available, Composite KPI evaluates accounts across profit, risk, stability, quality and runtime.

History readiness alone does not guarantee that every score is ready. Evaluations describe received records and do not predict future returns.

System Status and Languages

System Status displays ten account slots with connection state, last update, data age and history readiness, together with observer feeds and recent events.

The panel supports English, Simplified Chinese, Traditional Chinese, Russian, Korean, Japanese, Vietnamese, Malay, Indonesian, French and Spanish — 11 languages in total. Input parameter names remain in English.

Operating Notes and Support

For online operation, keep the monitoring terminal, source account terminals, internet connection and compatible BNT data service running.

This product provides data monitoring and display alerts. It does not open or close trades, pause other trading EAs or lock accounts.

The current edition requires no DLL imports. Connection and observation codes can be copied from the text field using Ctrl+C or the right-click Copy command, then pasted using Ctrl+V.

Illustrative screenshots and sample data demonstrate the interface rather than expected trading results.

For installation help or product questions, contact the author through MQL5 private messages or the product comments.


Recommended products
Fibonacci Expansion and Retracement Analysis Fibonacci retracing and extended line tools for the MT4 platform, ideal for traders who use the DiNapoli point trading method and the Golden Section trading The main function: 1. You can draw multiple sets of Fibonacci retracements directly, and the relationship between important return points is clear at a glance. 2. Can draw Fibonacci extensions 3. The Fibonacci foldback and extension of the line can be moved left and right for easy observation
Currencies Cleaner panel will give you an overview of all the most traded market's currencies in a single click. First of all the panel will refresh all your charts, opening them four times in all timeframes needed. 1 - CURRENCIES It uses a complex algorithm to study the movement of 17 different indicators. It means that the algorithm not only "reads" the actual value of an indicator, but also creates a probability of success using the position of this value on the indicator and the last moveme
Indexes
Pavel Verveyko
The stocks that make up the index are one of the drivers of the movement. Analyzing the financial performance of all elements of the index, we can assume further development of the situation. The program (script) displays corporate reports of shares that are part of the index selected in the settings.   "Indexes" cannot be tested in the tester (since there is no way to get information from the Internet). Information is downloaded from the site investing.com: Report Date Earnings per share (E
Trend Ray
Andriy Sydoruk
The indicator shows the potential trend direction by cyclical-wave dependence. Thus, all the rays of the intersection will be optimal rays, in the direction of which the price is expected to move, taking into account the indicator period. Rays can be used as a direction for potential market movement. But we must not forget that the approach must be comprehensive, the indicator signals require additional information to enter the market.
Auto Fibo Pro m
DMITRII GRIDASOV
"Auto FIBO Pro"   Crypto_Forex  indicator  - is great auxiliary tool in trading! Indicator automatically calculate and place on chart Fibo levels and local trend lines (red color). Fibonacci levels indicate key areas where price can reverse. Most important levels are 23.6%, 38.2%, 50% and 61.8%. You can use it   for reversal scalping  or for zone grid trading. There are plenty of opportunities to  improve your current system using Auto FIBO Pro indicator as well. It has Info Spread Swap Displa
CRT Candle Range Theory HTF MT4 - Ultimate CRT Indicator: Advanced ICT Concepts and Malaysian SnR Trading System Master the Market Maker's Footprints with the Most Advanced Candle Range Theory Indicator. Unlock the true power of Smart Money Concepts (SMC) and trade precisely like the institutions with the Ultimate CRT Indicator. Built exclusively for serious traders, this indicator automates the highly effective Candle Range Theory (CRT), a core pillar of ICT Concepts (Inner Circle Trader), and
VR Cub
Vladimir Pastushak
VR Cub is an indicator for getting high-quality entry points. The indicator was developed to facilitate mathematical calculations and simplify the search for entry points into a position. The trading strategy for which the indicator was written has been proving its effectiveness for many years. The simplicity of the trading strategy is its great advantage, which allows even novice traders to successfully trade with it. VR Cub calculates position opening points and Take Profit and Stop Loss targe
Program Overview: This program is a trading tool designed to monitor and analyze the 7 major currency pairs. It is a variant of a similar program used for tracking stock indices, but this version focuses on the seven major currency pairs. The program helps in identifying and calculating significant price movements (gaps) between the high and low prices of these currency pairs over a specified time frame. It then provides insights through comments and alerts based on the calculated gaps. Major Cu
Trendiness Index
Libertas LLC
5 (3)
"The trend is your friend" is one of the best known sayings in investing, because capturing large trendy price movements can be extremely profitable. However, trading with the trend is often easier said than done, because many indicators are based on price reversals not trends. These aren't very effective at identifying trendy periods, or predicting whether trends will continue. We developed the Trendiness Index to help address this problem by indicating the strength and direction of price trend
Harvest GOLD
Sayan Vandenhout
Harvest GOLD USES THE TREND WAVE INDICATOR AND IT CAN IDENTIFY THE BEGINNING AND THE END OF A NEW WAVE TREND MOVEMENT. AS AN OSCILLATOR, THE INDICATOR IDENTIFIES THE OVERBOUGHT AND OVERSOLD ZONES. IT WORKS GREAT TO CATCH THE SHORT TERM PRICE REVERSALS AND USES A MARTINGALE STRATEGY TO CLOSE ALL TRADES IN PROFIT. USE DEFAULT SETTINGS ON H1 OR HIGHER TIME FRAME ON ANY PAIR FOR MORE ACCURATE TRADES WHY THIS EA : Smart entries calculated by 3 great strategies The EA can be run on even a $30000
Chart Patterns Detect 15 patterns (Ascending Triangle, Descending Triangle, Rising Wedge, Falling Wedge, Bullish Flag, Bearish Flag, Bullish Rectangle, Bearish Rectangle Symmetrical triangle, Head and Shoulders, Inverted Head and Shoulders, Triple top, Triple Bottom, Double Top, Double Bottom) Use historical data to calculate the probability of each pattern to succeed (possibility to filter notification according to the chance of success) gives graphic indication about the invalidation level and
Zone Trader MT4
Lee Samson
5 (1)
Trade support and resistance or supply and demand zones automatically once you have identified the key areas you want to trade from. This EA allows you to draw buy and sell zones with a single click and then place them exactly where you expect price to turn. The EA then monitors those zones and will automatically take trades based on price action you specify for the zones. Once the initial trade is taken, the EA will then get out in profit at the opposite zone you place, which becomes the target
SMARTTARGETLINES – PRECISION TARGET VISUALIZER FOR MT4 The ultimate tool for traders who want to see exactly where price must go to hit their profit or equity targets — for BUY , SELL , and NET positions. KEY BENEFITS ️ Draws dynamic BUY , SELL , and NET TARGET LINES ️ Shows real-time price targets based on your equity or profit goals ️ Displays distance-to-target in points , dollars , or both ️ Includes a glowing corner label that changes color as you approach your goal ️ Clean des
This MetaTrader4 tool monitors 21 minor currency pairs over a user-defined timeframe, displaying key PIVOT values along with SUPPORT Zones 1, 2, and 3, and RESISTANCE Zones 1, 2, and 3 for each selected pair. Users can choose to have this information optionally displayed on the chart ; however, logging of the data to the log file is always active and occurs periodically based on the selected timeframe. For example, when set to an hourly timeframe, data will be logged every hour; on a minute-base
MT4 Reinvented
Francis Bouchard
Welcome guys !  I offer to you this MT4 project I've been working on for the last 2 years ( roughly over 900h of work.. ).  This is a complete tool that will change the way you see MT4, because I almost recoded it entirely ! It will provides you a solid base for risk management, order positionning, hedging, account preservation and journaling. I wanted an all-in-one panel that covers both scalping and swing trading and that suits every type of trader.       Main goal was : NO INPUTS. Never
Diamond Trend
Segundo Calvo Munoz
Indicator which identifies Trend and also buy/sell opportunities. Use for entries aligned to the Trend.  Although Diamond Trend is very accurate identifying entry points, it is always recommended to use a support indicator in order to reconfirm the operation. Remind to look for those Assets and Timeframes which best fit to your trader behavior/need... Valid for Scalping and Long Term operations. Please, set up a Bars Chart to be able to visualize the indicator properly...  ...And remind to give
Goldmine Ventures USES THE TREND WAVE INDICATOR AND IT CAN IDENTIFY THE BEGINNING AND THE END OF A NEW WAVE TREND MOVEMENT. AS AN OSCILLATOR, THE INDICATOR IDENTIFIES THE OVERBOUGHT AND OVERSOLD ZONES. IT WORKS GREAT TO CATCH THE SHORT TERM PRICE REVERSALS AND USES A MARTINGALE STRATEGY TO CLOSE ALL TRADES IN PROFIT. USE DEFAULT SETTINGS ON M15 OR HIGHER TIME FRAME ON ANY PAIR FOR MORE ACCURATE TRADES WHY THIS EA : Smart entries calculated by 5 great strategies The EA can be run on even a
Info Trader
Kalinka Capital OU
We are happy to present you the "Info Trader" information indicator. As we are traders ourselves, we create software that we primarily use in our own trading practices. During intraday multicurrency trading we were constantly in need of a "ready to use" info panel. You have probably noticed that it is necessary to make a decision on taking profit on the account with consideration of profit on multiple instruments. To do this, you need to see the whole picture of each trade in detail. “Info Trade
Anubis Skunk
Sayan Vandenhout
Anubis Skunk USES THE TREND WAVE INDICATOR AND IT CAN IDENTIFY THE BEGINNING AND THE END OF A NEW WAVE TREND MOVEMENT. AS AN OSCILLATOR, THE INDICATOR IDENTIFIES THE OVERBOUGHT AND OVERSOLD ZONES. IT WORKS GREAT TO CATCH THE SHORT TERM PRICE REVERSALS AND USES A MARTINGALE STRATEGY TO CLOSE ALL TRADES IN PROFIT. USE DEFAULT SETTINGS ON H1 OR HIGHER TIME FRAME ON ANY PAIR FOR MORE ACCURATE TRADES WHY THIS EA : Smart entries calculated by 5 great strategies The EA can be run on even a $20000
Vanglutio
Sayan Vandenhout
VANGLUTIO USES THE TREND WAVE INDICATOR AND IT CAN IDENTIFY THE BEGINNING AND THE END OF A NEW WAVE TREND MOVEMENT. AS AN OSCILLATOR, THE INDICATOR IDENTIFIES THE OVERBOUGHT AND OVERSOLD ZONES. IT WORKS GREAT TO CATCH THE SHORT TERM PRICE REVERSALS AND USES A MARTINGALE STRATEGY TO CLOSE ALL TRADES IN PROFIT. USE DEFAULT SETTINGS ON H1 OR HIGHER TIME FRAME ON ANY PAIR FOR MORE ACCURATE TRADES WHY THIS EA : Smart entries calculated by 5 great strategies The EA can be run on even a $20000 ac
Special Candle Do you want to use one of the best Forex indicators with a successful Ichimoku strategy? You can use this Awesome Indicator that is based on the Ichimoku strategy. MT5 version is here First strategy: This strategy involves identifying similar strong crosses that rarely occur. The best timeframes for this strategy are 30 minutes (30M) and 1 hour (H1). Appropriate symbols for the 30-minute timeframe include: •    CAD/JPY •    CHF/JPY •    USD/JPY •    NZD/JPY •    AUD/JPY •    EUR
Next level of trend trading here. Possibility 75%, the indicator analyzes the current market to determine short (small dot), middle (circle with a dot inside) and long (cross with a circle and a dot inside) trends.  Wingdings characters of  Aqua color represents the beginning of the UP trend. Wingdings characters of  Orange color represents the beginning of the DOWN trend. Possibility 75% Indicator will improve your trading in the world of forex, commodities, cryptocurrencies and indices.
Details of each condition Type 1. Set no use Hedging Martingale, to open the order by yourself only through the push button. TP and SL follow setting. Set Setting_Hedging =false;     Use_HLine =false;      Set Setting_TrailingStop =false; if not use. Type 2. Semi Auto Recovery Zone You have to open the order by yourself only through the push button. If in the wrong direction and Set true on Hedging Martingale, EA will fix the order with the zone system by use Hedging Martingale Set Se
Slide Trend is a simple indicator that shows a trend and allows for easy and fast navigation between charts. It was designed for quick analysis and aids you to scroll very fast through all the charts in the inputs list. The minimalist graphic allows receiving data on trend on D1, W1 and MN timeframes. The Trend feature (in the inputs) allows you to filter and view only the most powerful symbols. In this case, the circles are all of the same color. This indicator is a utility that speeds up navig
Price Magnet — Price Density and Attraction Levels Indicator Price Magnet is a professional analytical tool designed to identify key support and resistance levels based on statistical Price Density. The indicator analyzes a specified historical period and detects price levels where the market spent the most time. These zones act as “magnets,” attracting price action or forming a structural base for potential reversals. Unlike traditional Volume Profile tools, Price Magnet focuses on price-time d
VandoraFX Gold
Sayan Vandenhout
VANDORA FX USES THE TREND WAVE INDICATOR AND IT CAN IDENTIFY THE BEGINNING AND THE END OF A NEW WAVE TREND MOVEMENT. AS AN OSCILLATOR, THE INDICATOR IDENTIFIES THE OVERBOUGHT AND OVERSOLD ZONES. IT WORKS GREAT TO CATCH THE SHORT TERM PRICE REVERSALS AND USES A MARTINGALE STRATEGY TO CLOSE ALL TRADES IN PROFIT. USE DEFAULT SETTINGS ON H1 OR HIGHER TIME FRAME ON ANY PAIR FOR MORE ACCURATE TRADES WHY THIS EA : Smart entries calculated by 5 great strategies The EA can be run on even a $20000 a
Alpha Trend sign has been a very popular trading tool in our company for a long time. It can verify our trading system and clearly indicate trading signals, and the signals will not drift. Main functions: Based on the market display of active areas, indicators can be used to intuitively determine whether the current market trend belongs to a trend market or a volatile market. And enter the market according to the indicator arrows, with green arrows indicating buy and red arrows indicating se
Double HMA lines MTF
Pavel Zamoshnikov
5 (2)
This is a multi-timeframe version of the popular Hull Moving Average (HMA). The Double HMA MTF Light indicator combines two timeframes on a single chart. The HMA of the higher timeframe defines the trend, and the HMA of the current timeframe defines short-term price movements. The indicator is freely distributed and hasn't audio signals or messages. Its main function is the visualization of price movements. If you need advanced functionality of the HMA multi-timeframe indicator (information ab

FREE
Magic EA MT4
Kyra Nickaline Watson-gordon
3 (1)
Magic EA is an Expert Advisor based on Scalping, Elliot Waves and with filters such as RSI, Stochastic and 3 other strategies managed and decided with the robot smartly. Large number of inputs and settings are tested and optimized and embedded in the program thus inputs are limited and very simple. Using EA doesn't need any professional information or Forex Trading Knowledge. EA can trade on all symbols and all time frames, using special and unique strategies developed by the author. The EA wo
Forbex Gann Legacy Fibonacci Confluence Tool One chart. One structure. One complete professional analysis workspace. Forbex Gann Legacy Fibonacci Confluence Tool is designed for traders who want more than another indicator displaying arrows or mechanical signals. It is a complete manual market-analysis and decision-support system for MetaTrader 4 , combining market structure, Gann projections, Fibonacci confluence, historical statistics, multi-timeframe context and practical chart-management too
Buyers of this product also purchase
Unlimited Trade Copier Pro is a tool to copy trade remotely to multiple MT4, MT5 and cTrader accounts at different computers/locations over internet. This is an ideal solution for you if you are a signal provider and want to copy your trades to other receivers globally on your own rules. One provider can copy trades to multiple receivers and one receiver can get trade from multiple providers as well. The provider can even set the subscription expiry for each receiver, so that receiver will not b
Strategy Builder offers an incredible amount of functionality. It combines a trade panel with configurable automation (covert indicators into an EA), real-time statistics (profit & draw down) plus automatic optimization of SL, TP/exit, trading hours, indicator inputs. Multiple indicators can be combined into an single alert/trade signal and can include custom indicators, even if just have ex4 file or purchased from Market. The system is easily configured via a CONFIG button and associated pop-up
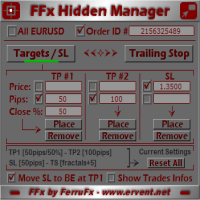
The FFx Hidden Manager panel will help you to manage easily your orders directly on the chart. Below all features described: TP, SL and TrailingStop are hidden Each order has its own lines on chart Drag & Drop any line to change the TP/SL as per your need Option to move automatically the SL line at breakeven when TP #1 is reached Option to choose the TP/SL type (by pips or price) Option to choose the TrailingStop type (by pips, MA, Fractals, PSAR or ATR) Define which order(s) you want to manage
FFx Risk Calculator
Eric Venturi-Bloxs
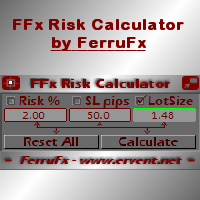
FFx Risk Calculator panel will help you to calculate very easily your trades size, SL or the risk directly on the chart. All features are described below: Option to select which parameter to calculate: Risk, Stop Loss or Lot Size The panel will show if the lot size is allowed according to the current account free margin Button to maximize/minimize the panel Drag and Drop the panel anywhere on the chart How to use it? Select the parameter you want to be calculated. It will be based on the 2 other
News Trader Pro
Vu Trung Kien
4.38 (16)
News Trader Pro is a unique robot that allows you to trade the news by your predefined strategy. It loads every piece of news from several popular Forex websites. You can choose any news and preset the strategy to trade it, and then News Trader Pro will trade that news by selected strategy automatically when the news comes. News release gives opportunity to have pips since the price usually has big move at that time. Now, with this tool, trading news becomes easier, more flexible and more exciti
FFx Watcher PRO
Eric Venturi-Bloxs
The FFx Watcher PRO is a dashboard displaying on a single chart the current direction of up to 15 standard indicators and up to 9 timeframes. It has 2 different modes: 1. Watcher mode: Multi Indicators User is able to select up to 15 indicators to be displayed User is able to select up to 9 timeframes to be displayed 2. Watcher mode: Multi Pairs User is able to select any number of pairs/symbols User is able to select up to 9 timeframes to be displayed This mode uses one of the standard indicat
The product combines a manual trade panel with the ability to perform actions automatically in a highly configurable way. Actions include capturing indicator values and then based on those values raising alerts, open/close or partially close trades, scale-in, setting up pending orders, adjusting stop loss, take profit and more. On-chart controls can be configured, such as tick boxes and buttons, so can be fully interactive. The EA also handles money management, news events, hidden stop loss, tak
Price Action DashBoard
Chantal Sala
4.17 (6)
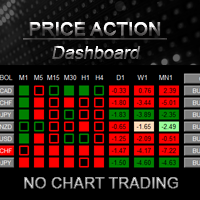
The Price Action Dashboard is an innovative tool to help the trader to control a large number of financial instruments. This tool is designed to automatically suggest signals and price conditions. The Dashboard analyzes all major Time Frame suggesting price action conditions with graphic elements. The Dashboard can suggest you the strength of the trend identifying directional movement, it is an indispensable tool for those who want to open position themselves using market trends identifiers. The
Elliott Wave Counter is a panel for rapid and user-friendly manual markup of Elliott waves. One can select a color and a level of marks. There are also functions for removing the last markup and the entire markup made by the tool. Markup is made in one click. Click five times - have five waves! Elliott Wave Counter will be a great instrument both for beginners and professional analysts of Elliott waves. Elliott Wave Counter Installation & Inputs Guide if you want to get   notifications  about th
If you wish to draw Support and Resistance lines, view: daily market opening, classical pivot levels, Fibonacci pivot levels, trend lines, Fibonacci levels, the remaining time to candle closing, and current spread. If you seek to place your orders with the exact lot that meets your desired stop loss risk. If you wish to do all this and more with just one click, then this is the perfect tool to use. This tool will allow you to feel more relaxed when deciding to open orders, as well as predicting
Partial Close Expert
Omar Alkassar
5 (1)
Partial Close Expert is tool combines many functions into one automated system. This EA can help traders manage their positions more effectively by offeringmultiple options for managing risk and maximizing potential gains. With Partial Close Expert, traders can set a   partial close   level to lock in profits, a   trailing stop   level to protect profits and limit losses, a   break-even   level to ensure that the trade will break even if the price moves against them, and several other functions
Master Trend Dashboard
Chantal Sala
4.67 (3)
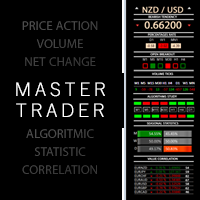
Master Trend Dashboard is a new generation indicator, compact, light and efficient. Each element of this Dashboard is designed to return specific signals as: Price Action, Breakout, Net Change (performance of the instrument), algorithmic studies, correlations and statistical calculations. This tool will change your way of trading allowing you to receive important information. See the Graphic Signals to understand every single signal below: Graphic Signals Symbol name and arrow color Green = Cur
Trade Copier Agent is designed to copy trades between multi MetaTrader(4/5) accounts/terminals. With this tool, you can act as either a provider (source) or a receiver (destination). All trading actions will be copied from the provider to the receiver with no delay. This tool allows you to copy trades between multiple MetaTrader terminals on the same computer with lightning-fast copying speeds of under 0.5 seconds. Trade Copier Agent Installation & Inputs Guide Please Apply the settings on the
Unlimited Binary Options Copier Remote is a powerful tool to copy binary options trades remotely between multiple accounts at different locations over internet. This is an ideal solution for signal provider, who want to share his binary options trades with the others globally on his own rules. One provider can copy trades to unlimited receivers and one receiver can get trade from unlimited providers as well. The provider can set the subscription expiry for each receiver, so that receiver will no
This is an Expert Adviser use for manual trading as a background EA or combine with external EA to open orders. Loss Recovery Trading is one of your options to handle the lose positions instead of using stop loss by setting a zone recovery area and target to exit the turn rounds sequence. How It Work? If the market goes against your first positions direction at the specific of losing points, the EA will open an opposite direction position with calculated larger lot size and also keep the first
Market Pressure Dashboard is a new generation utility. Its main function is to assist you and give you operational ideas optimizing your analytical work. Using this utility you could monitor a lots of financial instruments (max 28 symbols FOREX) in a very simple way. The Market Pressure indicator allows you to customize the internal list of the symbols to be monitored. The opening function and position management with this panel will be much more comfortable and navigation charts very powerful.
Contact/message me if you encounter any issue using the product or need extra feature to add on the base version. There is a demo version of this panel Dashboard Trading Made Simple Demo in my product list, please try it out to get familiar with all functionalities free, LINK . This system basically utilizes TDI as the main indicator to generate trading signal mainly on H1 and H4 timeframes. The signal will be further filtered and trimmed. Stochastic; Heiken Ashi candle direction and candle siz
Telegram Publisher Agent  is an add-on that allows traders to send signals to their Telegram channels and groups in real-time. With customizable messages, chart screenshots, and other features, the tool helps traders share their trading insights and strategies with their followers. The tool also features a beautiful design with light and dark theme switch, providing users with an aesthetic and functional trading experience. Telegram Publisher Agent was designed to Publish all your trades as sig
如果产品有任何问题或者您需要在此产品上添加功能,请联系我 Contact/message me if you encounter any issue using the product or need extra feature to add on the base version. There is a Demo version of this panel Dashboard Currency Strength Meter AdvancedDemo in my product list, please try it out to get familiar with all functionalities free, LINK . The Dashboard Currency Strength Meter Advanced gives you a quick visual guide to which currencies are strong, and which ones are weak over the customized 4 time-frames and period.
如果产品有任何问题或者您需要在此产品上添加功能,请联系我 Contact/message me if you encounter any issue using the product or need extra feature to add on the base version. There is Demo version of this panel Dashboard Genesis Matrix Trading Demo in my product list, please try it out to get familiar with all functionalities free, LINK . This system basically utilizes Genesis Indi Set (TVI, CCI, GannHilo, and T3) as the core indicators to generate trading signal mainly on time-frame M15. The signal will be further filtered a
如果产品有任何问题或者您需要在此产品上添加功能,请联系我 Contact/message me if you encounter any issue using the product or need extra feature to add on the base version. There is Demo version of this panel Dashboard Symphonie Trader System Demo in my product list, please try it out to get familiar with all functionalities free, LINK . This system basically utilizes Symphonie Indicator Set (Extreme, Emotion, Trend, and Sentiment) as the core indicators to generate trading signal mainly on time-frame M15. The signal will b
如果产品有任何问题或者您需要在此产品上添加功能,请联系我 Contact/message me if you encounter any issue using the product or need extra feature to add on the base version. There is Demo version of this panel Dashboard Babon Scalping System Demo in my product list, please try it out to get familiar with all functionalities for free, LINK . This system basically utilizes TDI, Heiken Ashi Trend, Price Trend on H1 time-frame and TMA on H1&H4 time-frame to generate the trend (big picture). Then the system will zoom in to genera
Pairs Trade
Oleg Pechenezhskiy
The Pairs Trade indicator is a utility for semi-automatic pair trading. It allows combining the charts of two arbitrary instruments, even if the schedules of their trading sessions are different. It displays a spread chart in the form of a histogram with an overlaying moving average. It calculates the swap that will be charged for the synthetic position (in the deposit currency). It is possible to set a level for automatic opening of a synthetic position on the spread chart (analogous to the 'se
Corporate Report
Pavel Verveyko
5 (1)
The script displays info about the share's corporate reports and dividends. The data is downloaded from   investing.com : Report date Profit per share (EPS) Revenue Market capitalization Amount of dividends Date of payment of dividends Dividend income The product cannot be tested in the tester (since it is not possible to receive data from the Internet). Before launching:  Add 2   URL   https://ru.investing.com/earnings-calendar/Service/getCalendarFilteredData  and   https://ru.investing.com/di
This Stacker EA will: Automatically set Stop loss on a new order Automatically set Take profit on a new order Stack (or open up to 4 additional orders at the same time) when a new order is placed, the SL/TP can be preset individually for each order. Provides a transparent replacement for the standard 1-click trading buttons in MetaTrader 4 (1 click still works and SL/TP will automatically be set as well as Stacking). Automatically calculate lot order size according to preset risk management perc
This small tool takes over the manually opened positions and treats them according to the predefined settings with the dynamic stop loss and Money Management, which predicts which position size should be used for the trade. The program dynamically tracks the stop loss as soon as the position comes into the plus. Possible commissions and swaps are taken into calculation. It should only be installed on one chart window per symbol. Settings LotRiskPercent = 25 - Percentage of the item size. Calcul
Buy or rent it and request a copy of the Antimartingale EA for free  Trendline based utility, you design your trendlines or horizontal lines, the EA opens trades for you Possibility to trade on break and/or bounce events Indipendent break and bounce settings Configurable market, stop and limit orders T1T2 Logic to lock profits and minimize losses Trailing Stop Loss Max Spread check Notifies you when your trendlines are crossed No strange trendline name or syntax, you decide the color of tr
FXFledgling Exit Tool is a complete risk management tool that analyzes both the open trades and the direction of the pair of open trades. As long as the suggested entry and lotsizing management presented here is followed strictly, you will have a high chance (but no guarantee) of surviving the trade. What It Does It is used as an exit tool. It helps the trader to manage any manual trade that he transacted. It does the following: Trail Stop Dynamic Stop Loss - a calculated stop-loss that changes
This utility records the swap, which allows you to monitor and analyze the changes in the swap. The program writes a file with the swap data for every pair selected in the Market Watch. The data are recorded to a csv file at the specified time, the file is located in <terminal root directory>/MQL4/Files. File format: Date Day Time Currency pair Long-swap Short-swap 16.01.2018 Mon 23:30 EURNOK -34.81 27.14 16.01.2018 Mon 23:30 EURDKK -0.022 -0.032 16.01.2018 Mon 23:30 EURGBP -2.38 0.15 To start r
Crypto Market Pro
Daniil Kurmyshev
5 (1)
New opportunities for analyzing cryptocurrency in the usual MetaTrader 4. For example : We select the symbol of the cryptocurrency and attach any indicators, Expert Advisors or scripts. Startup Mode View cryptocurrency; Data collection. Capabilities Work as with a standard currency chart; Automatic update of open charts; Selection of individual cryptocurrency for updating; Selection of individual timeframes for updating; Work on the desired timeframes; Open charts do not affect the work of Cry
More from author
BNT Rapid Copier Local MT4 / MT5 trade copying with configurable execution and copy-profit statistics. User Manual and Installation Guide Download the English User Manual and Installation Guide (ZIP) Download and extract the ZIP file to access the PDF user manual. The guide covers Sender and Receiver setup, channel configuration, symbol mapping, lot sizing, synchronization options, profit statistics and troubleshooting. MT4 and MT5 in One Workflow BNT Rapid Copier connects a source trading acco
WUKONG | Built for Gold. Driven by Discipline. Gold moves fast. A clear plan and consistent execution help you stay focused when the market becomes demanding. WUKONG is a MetaTrader 4 Expert Advisor developed by BNT for XAUUSD gold trading. It brings price-breakout signals, a multi-strategy portfolio, configurable position sizing and trade management into one automated system. For traders who want less time watching charts and a more structured trading process, WUKONG offers execution you can a
BNT Rapid Copier Local MT4 / MT5 trade copying with configurable execution and copy-profit statistics. User Manual and Installation Guide Download the English User Manual and Installation Guide (ZIP) Download and extract the ZIP file to access the PDF user manual. The guide covers Sender and Receiver setup, channel configuration, symbol mapping, lot sizing, synchronization options, profit statistics and troubleshooting. MT4 and MT5 in One Workflow BNT Rapid Copier connects a source trading acco
BNT Account Monitor MT5 Whole-account monitoring, performance analysis and read-only sharing. User Guide and Required Data Link EA User manual and installation guide: Download the User Manual (ZIP) BNT Data Link MT5 companion EA: Download the Companion Data Link EA (ZIP) This product is the MT5 monitoring terminal. Collecting data from an account requires the compatible BNT Data Link MT5 companion EA to be installed and running in that account’s MT5 terminal. Download the companion EA using t
WUKONG | Built for Gold. Driven by Discipline. Gold moves fast. A clear plan and consistent execution help you stay focused when the market becomes demanding. WUKONG is a MetaTrader 5 Expert Advisor developed by BNT for XAUUSD gold trading. It brings price-breakout signals, a multi-strategy portfolio, configurable position sizing and trade management into one automated system. For traders who want less time watching charts and a more structured trading process, WUKONG offers execution you can a
Filter:
No reviews
Reply to review