Zero Lag Real Time Trend Signal MTF

Zero Lag Real Trend Signals (MTF) — Zero-Lag Trend Line, Volatility Bands, Entry Arrows, Alerts and a 9-Timeframe Trend Panel for MetaTrader 4

Zero-lag basis | ATR deviation bands | Trend flip arrows | Pullback entry arrows | Popup alerts | Multi-timeframe panel

1. Overview

Zero Lag Real Trend Signals (MTF) is a chart-window indicator for MetaTrader 4. It draws a zero-lag moving average (the "basis") surrounded by volatility bands, colors the chart according to the current trend, marks trend changes and pullback entries with arrows, and shows the trend of up to nine timeframes in a compact panel.

The goal is to give you a quick, readable answer to three questions:

  • What is the trend right now? The basis line and the shaded area between the basis and the active band are green-teal in a bullish trend and red in a bearish trend.
  • When did the trend change? An arrow appears on the bar where price closes beyond the opposite band.
  • Is there a pullback entry inside the trend? A second type of arrow appears when price crosses back over the basis while the trend is still intact.

The multi-timeframe panel adds the bigger picture. Without leaving your chart you can see whether M1, M5, M15, M30, H1, H4, D1, W1 and MN1 (or any other set of timeframes you select) are bullish, bearish or neutral.

This MT4 version is a conversion of the "Zero Lag Trend Signals (MTF)" Pine Script by AlgoAlpha, published under the Mozilla Public License 2.0. The indicator only draws on the chart and sends alerts. It never opens, closes or modifies trades.

2. How the Indicator Works

2.1 The zero-lag basis

A normal EMA follows price with a delay. This indicator reduces that delay with a simple lag-compensation step before smoothing:

  1. It calculates a lag value: lag = (Length - 1) / 2, using whole numbers. With the default Length of 70, the lag is 34 bars.
  2. It builds a compensated price: source = close + (close - close of "lag" bars ago). When price is rising, this pushes the source above the close, and when price is falling it pushes the source below the close.
  3. It smooths that source with an exponential moving average whose smoothing factor is 2 / (Length + 1).

The result is a trend line that reacts faster than a plain EMA of the same length. "Zero lag" describes the method used to reduce delay. It does not mean the line has no delay at all, and no moving average can predict price.

2.2 The volatility bands

Around the basis the indicator draws two bands:

  • The indicator takes the ATR (Average True Range) with the same period as Length.
  • It then finds the highest ATR value over the last 3 × Length bars. Using the highest recent value keeps the bands wide enough to stay stable after volatile periods.
  • That value is multiplied by the Band Multiplier (default 1.2) to get the band distance.
  • Upper band = basis + distance. Lower band = basis - distance.

2.3 The trend rule

The trend only changes when price breaks out of the band on the opposite side:

  • Bullish trend starts when a candle closes above the upper band and the previous candle had not closed above the previous upper band.
  • Bearish trend starts when a candle closes below the lower band and the previous candle had not closed below the previous lower band.
  • Between those events the trend state is kept. Small moves around the basis do not change the trend, so the indicator is less sensitive to ordinary noise than a simple moving average cross.

3. What You See on the Chart

  • Zero Lag Basis line. Green-teal while the trend is bullish and red while it is bearish. By default it is a solid line with width 2.
  • Active deviation band. In a bullish trend, the lower band is drawn as a dotted line. In a bearish trend, the upper band is drawn as a dotted line. The band on the other side is hidden, which keeps the chart clean.
  • Trend fill. A shaded area between the basis and the active band. Dark teal for bullish, dark red for bearish.
  • Trend flip arrows. An up arrow at the lower band when a bullish trend starts. A down arrow at the upper band when a bearish trend starts.
  • Entry arrows. An up arrow below the basis for a bullish entry and a down arrow above the basis for a bearish entry (see section 4).
  • Multi-timeframe panel. A small table, by default in the upper-right corner of the chart.

All colors can be changed in the inputs.

4. Trend Flip Signals and Entry Signals

The indicator shows two different kinds of arrows. They mean different things.

4.1 Trend flip

A trend flip marks the bar where the trend changes direction, as described in section 2.3.

  • Bullish flip: a candle closes above the upper band after the previous bar was not above its upper band. The arrow is drawn at the lower band.
  • Bearish flip: a candle closes below the lower band after the previous bar was not below its lower band. The arrow is drawn at the upper band.

4.2 Entry signal

An entry signal looks for a pullback inside a trend that is already running. It requires that the trend did not just change.

  • Bullish entry: the trend is bullish and was also bullish on the previous bar, the candle closes above the basis, and the previous candle had closed at or below the previous basis. In other words, price dipped to the basis and closed back above it.
  • Bearish entry: the trend is bearish and was also bearish on the previous bar, the candle closes below the basis, and the previous candle had closed at or above the previous basis.

The entry arrow is placed at a distance of 1.5 times the band distance from the basis (below it for bullish, above it for bearish) so that it stays clear of the candles.

4.3 How traders may read them

Some traders treat a flip as a possible start of a new move and an entry arrow as a possible continuation point. Others only trade entries that agree with the higher-timeframe panel. These are ways of reading the information, not guarantees. A flip can fail, and an entry can happen right before the trend ends. Always decide your stop, risk and target before acting.

5. The Multi-Timeframe Panel

The panel lists nine timeframes. For each one, the indicator runs the same zero-lag trend calculation on that timeframe's own price data, using the same Length and Band Multiplier, and reports the result:

  • BULLISH (in the bullish color): the latest trend event on that timeframe was a bullish flip.
  • BEARISH (in the bearish color): the latest trend event was a bearish flip.
  • NEUTRAL (silver): no flip has been found yet, or there is not enough history on that timeframe.

Important details:

  • The default timeframes are M1, M5, M15, M30, H1, H4, D1, W1 and MN1. Each of the nine rows can be set to any timeframe in the inputs.
  • The panel works the same on any chart timeframe. It does not depend on the timeframe you are viewing.
  • Each timeframe uses up to its latest 3000 bars for the calculation.
  • The panel refreshes when a new bar opens on the chart you are viewing.
  • You can choose the corner of the chart and the pixel distance from that corner.

A common use is to look for agreement. If the chart trend, the next higher timeframes and the panel all point the same way, the setup has more context than a signal that goes against the larger trend.

6. Alerts

Alerts are controlled by three inputs:

  • Enable alerts turns all alerts on or off.
  • Alert on trend flip sends an alert when a bullish or bearish trend flip arrow has formed.
  • Alert on entry signal sends an alert when a bullish or bearish entry arrow has formed.

Alerts use the standard MT4 popup Alert window and contain the symbol, the chart timeframe and the type of signal, for example "bullish trend flip" or "bearish entry signal". Alerts are checked on the last closed candle, once per new bar, so they refer to a completed bar and not to a candle that is still forming. Push notifications and email are not included in this version.

7. Input Reference

  • Length (default 70): period of the zero-lag EMA and of the ATR. It also sets the lag value and the ATR look-back window (3 × Length). Larger values make a slower, smoother trend. Smaller values react faster and flip more often.
  • Band multiplier (default 1.2): multiplies the highest recent ATR to set the band distance. Larger values give wider bands and fewer trend flips. Smaller values give tighter bands and more flips.
  • Bullish color / Bearish color: colors of the lines, bands and arrows.
  • Bullish fill color / Bearish fill color: colors of the shaded trend area.
  • Timeframe 1 to Timeframe 9 (defaults M1, M5, M15, M30, H1, H4, D1, W1, MN1): the timeframes shown in the panel rows.
  • Enable alerts (default true): master switch for alerts.
  • Alert on trend flip (default true): alert on bullish and bearish flips.
  • Alert on entry signal (default true): alert on bullish and bearish entries.
  • Panel corner (default upper right): corner of the chart where the panel is placed.
  • Panel offset X (default 10): horizontal distance from the selected corner, in pixels.
  • Panel offset Y (default 20): vertical distance from the selected corner, in pixels.

8. Choosing Length and Band Multiplier

The defaults (70 and 1.2) are a general starting point, not a recommendation for every market. As a rough guide:

  • Shorter Length, for example 30 to 50, suits faster trading and lower timeframes, but produces more flips and more false starts in sideways markets.
  • Longer Length, for example 90 to 150, suits swing trading and higher timeframes. Signals are fewer and later.
  • Band multiplier below 1.0 makes flips easier to trigger. Above 1.5 it makes them rare and larger.

Test any change on a demo account and on past data for your own symbol and timeframe before using it with real money. Keep the same settings long enough to judge them.

9. Installation

  1. In MetaTrader 4, open File > Open Data Folder.
  2. Copy the indicator file into MQL4 > Indicators.
  3. If you have the .mq4 source, open it in MetaEditor and press Compile (F7).
  4. In the terminal, right-click Navigator > Indicators and choose Refresh.
  5. Drag Zero Lag Trend Signals (MTF) [AlgoAlpha] from the Navigator onto a chart. Adjust the inputs if you wish and press OK.

For the nine-timeframe panel to be accurate, the terminal needs history for each selected timeframe. If a row shows NEUTRAL when you expect a trend, open that timeframe once on any chart so MT4 downloads its history, then reload the indicator.

10. Notes for Developers

The indicator uses 12 buffers, which can be read with iCustom if you build an Expert Advisor or a script around it:

  • Buffer 0: bullish basis. Buffer 1: bearish basis.
  • Buffer 2: upper band. Buffer 3: lower band.
  • Buffers 4 to 7: values used for the trend fill.
  • Buffer 8: bullish trend flip. Buffer 9: bearish trend flip.
  • Buffer 10: bullish entry. Buffer 11: bearish entry.

Empty buffer values mean "no signal on this bar". The calculation uses up to the latest 5000 bars of the chart.

11. Limitations

  • The current candle can change. Trend and arrows on the candle that is still forming use its live close. A flip or entry arrow may appear and disappear until the candle closes. Use the last closed bar, or the alerts, for confirmed signals.
  • It is a lagging tool. Zero-lag methods reduce delay but cannot remove it. Flips are confirmed after price breaks a band.
  • Sideways markets. Like any trend tool, it can produce several flips in a range.
  • Panel timing. The panel refreshes on each new chart bar, not on every tick.
  • Alerts are popup alerts only.
  • Broker data differs. Different brokers have different history and spreads, so signals can differ slightly between brokers.

12. Frequently Asked Questions

Does the indicator trade for me? No. It draws on the chart and can show alerts. You place and manage every trade yourself.

Does it repaint? Signals on closed candles do not change. The candle that is still forming can change until it closes, as explained in section 11.

Which markets and timeframes can I use? Any symbol available in your MT4 and any chart timeframe.

Why does the panel show NEUTRAL for a timeframe? Either that timeframe has not produced a flip within the history used, or the terminal does not have enough bars for it. Load that timeframe's history and reload the indicator.

Can I change which timeframes are shown? Yes. Each of the nine rows has its own timeframe input.

Can I move the panel? Yes, choose the corner and the pixel offsets.

Why are there two kinds of up arrows? One marks the start of a new trend (flip) at the band. The other marks a pullback entry inside a running trend, placed away from the basis.

13. Credits and Risk Disclaimer

This indicator is a MetaTrader 4 conversion based on the Zero Lag Trend Signals (MTF) Pine Script by AlgoAlpha, published under the Mozilla Public License 2.0 (https://mozilla.org/MPL/2.0/). All trademarks belong to their respective owners.

Risk warning. Trading foreign exchange, CFDs, metals, indices and cryptocurrencies involves a high level of risk and may not be suitable for everyone. You can lose some or all of your capital. This indicator is an analytical tool that displays information based on past price data. It does not predict the future, does not guarantee profits and is not financial advice. Test on a demo account first, use proper risk management, and never risk money you cannot afford to lose.



Recommended products
Power Renko MT4
Pierce Vallieres
Power Renko is an indicator which plots Renko bricks underneath the chart using a histogram. You can select the brick size and the timeframe of the Renko bricks as well as whether or not to use the close price or the high/low price of the candles. Renko bricks are based on price alone, not time, therefor the Renko bricks will not be aligned with the chart's time. They are extremely useful for trend trading and many different strategies can be formed from them. Buffers are provided allowing you t
Trend Oscillator - is an advanced custom  Crypto_Forex indicator, efficient trading tool! Advanced new calculation method is used - 20 options for parameter "Price for calculation". Smoothest oscillator ever developed. Green color for upward trends,  Red color for downward trends. Oversold values: below 5, O verbought values: over 95. There are plenty of opportunities to upgrade even standard strategies with this indicator. With PC and Mobile alerts. Click here to see high quality Trading Robot
Daily Candle Predictor is an indicator that predicts the closing price of a candle. The indicator is primarily intended for use on D1 charts. This indicator is suitable for both traditional forex trading and binary options trading. The indicator can be used as a standalone trading system, or it can act as an addition to your existing trading system. This indicator analyzes the current candle, calculating certain strength factors inside the body of the candle itself, as well as the parameters of
Auto Fibo Pro m
DMITRII GRIDASOV
"Auto FIBO Pro"   Crypto_Forex  indicator  - is great auxiliary tool in trading! Indicator automatically calculate and place on chart Fibo levels and local trend lines (red color). Fibonacci levels indicate key areas where price can reverse. Most important levels are 23.6%, 38.2%, 50% and 61.8%. You can use it   for reversal scalping  or for zone grid trading. There are plenty of opportunities to  improve your current system using Auto FIBO Pro indicator as well. It has Info Spread Swap Displa
Stepping Trend
Mpendulo Chiliza
The Stepping Trend Indicator     The Steppi ng Trend indicator uses the  average true range  (ATR indicator) in its calculation. This gives you control to set your own average true range period, I set the Default as 10.   Indicator Details. Green Arrow Up: This means you are at the starting point of a new bullish trend, it’s time to buy.   Red  Arrow  Down : This means you are at the starting point of a new  bearish  trend, it’ s time to sell .   What if you miss the Arrow Signal?   No prob
Trendiness Index
Libertas LLC
5 (3)
"The trend is your friend" is one of the best known sayings in investing, because capturing large trendy price movements can be extremely profitable. However, trading with the trend is often easier said than done, because many indicators are based on price reversals not trends. These aren't very effective at identifying trendy periods, or predicting whether trends will continue. We developed the Trendiness Index to help address this problem by indicating the strength and direction of price trend
Advanced Trend Regime
Shellard Securities (Pty) Ltd
The indicator has been designed to function on any time-frame and any pair.   This regime filter will help the trader better evaluate whether the current market is trending, and in which direction. It quickly reacts to changes in market dynamics using a series of advanced calculations. The user is able to select whether the calculation remains standard, or if a further filter constraint is added to the calculation.   A Yellow moving average of the signal has been included for the trader to smoot
The indicator displays the data of the Stochastic oscillator from a higher timeframe on the chart. The main and signal lines are displayed in a separate window. The stepped response is not smoothed. The indicator is useful for practicing "manual" forex trading strategies, which use the data from several screens with different timeframes of a single symbol. The indicator uses the settings that are identical to the standard ones, and a drop-down list for selecting the timeframe. Indicator Paramet
PipFinite Trend PRO
Karlo Wilson Vendiola
4.88 (2252)
Breakthrough Solution For Trend Trading And Filtering With All Important Features Built Inside One Tool! Trend PRO's smart algorithm detects the trend, filters out market noise and gives entry signals with exit levels. The new features with enhanced rules for statistical calculation improved the overall performance of this indicator. Important Information Revealed Maximize the potential of Trend Pro, please visit www.mql5.com/en/blogs/post/713938 The Powerful Expert Advisor Version Automatin
Infinity Trend Pro
Yaroslav Varankin
1 (1)
This is a trend indicator without redrawing Developed instead of the binary options strategy (by the color of the Martingale candlestick) Also works well in forex trading When to open trades (binary options) A signal will appear in the place with a candle signaling the current candle It is recommended to open a deal for one candle of the current timeframe M1 and M5 When a blue dot appears, open a deal up When a red dot appears, open a trade down. How to open trades on Forex. When a signal is rec
Rainbow Price Visualizer v1.21 See where the market really breathes. Turns your MT4 chart into an ultra-precise heatmap that highlights price zones favored by big players. Why it matters 300 price levels at 0.2‑pip resolution — microscopic detail. 8 visual themes (Rainbow, Fire, Ocean…) for instant readibility. Smart opacity: low noise fades, real zones pop. Lightweight rendering with automatic cleanup. Fully customizable: saturation, opacity, resolution, history depth. Bands project into the f
Color Stochastic Enhanced Stochastic Oscillator with Cross Detection and Visual Signal Support Overview Color Stochastic is a customized version of the classic Stochastic Oscillator designed for momentum analysis and crossover visualization. The indicator provides color-based signal marking and configurable crossover detection at user-defined overbought and oversold levels. It can be used as part of: Momentum analysis Mean reversion workflows DCA-based strategies Multi-indicator confirmation sys
[ZhiBiCCI] indicators are suitable for all cycle use, and are also suitable for all market varieties. [ZhiBiCCI] Green solid line is a reversal of bullish divergence. The green dotted line is a classic bullish divergence. [ZhiBiCCI] The solid line to the red is a reverse bearish divergence. The red dotted line is a classical bearish divergence. [ZhiBiCCI] can be set in the parameters (Alert, Send mail, Send notification), set to (true) to send instant signals to the alarm window, email, insta
Insider Scalper Binary This tool is designed to trade binary options. for short temporary spends. to make a deal is worth the moment of receiving the signal and only 1 candle if it is m1 then only for a minute and so in accordance with the timeframe. for better results, you need to select well-volatile charts.... recommended currency pairs eur | usd, usd | jpy .... the indicator is already configured, you just have to add it to the chart and trade .... The indicator signals the next candle.
Super Reversal Pattern
Parfait Mujinga Ndalika
Super Reversal Pattern Indicator Unlock the power of advanced pattern recognition with our Super Reversal Pattern Indicator. Designed for traders seeking precision and reliability, this indicator identifies one of the most effective reversal patterns in technical analysis, offering a significant edge in your trading strategy. Key Features: Non-Repainting Accuracy: Enjoy the confidence of non-repainting technology. Once a Super Reversal Pattern is detected, it remains static, providing consiste
Wave Wolf MT4
Andrei Salanevich
The Wave Wold MT4 Forex indicator is designed to search for Wolf waves and display them in the current window of the trading terminal. An excellent indicator for traders who use Wolf waves in trading. Its application in trading strategies will significantly increase their efficiency and profitability. INFORMATION ABOUT THE INDICATOR Unlike other Wolf wave indicators, the Wave Wold MT4 forex indicator has a number of features that significantly increase its effectiveness: The first is the Ope
An indicator of pattern #31 ("Long Island") from Encyclopedia of Chart Patterns by Thomas N. Bulkowski. The second gap is in the opposite direction. Parameters: Alerts - show alert when an arrow appears   Push - send a push notification when an arrow appears (requires configuration in the terminal) GapSize - minimum gap size in points ArrowType - a symbol from 1 to 17 ArrowVShift - vertical shift of arrows in points   ShowLevels - show levels ColUp - color of an upward line ColDn - color of a
Inguz 4
Maxim Kuznetsov
Ing (inguz,ingwar) - the 23rd rune of the elder Futhark ᛝ, Unicode+16DD. Add some runic magic to your trading strategies. The correct marking of the daily chart will indicate to you the successful moments for counter-trend trading. Simple to use, has high efficiency in volatile areas. Be careful in lateral movements. Signals ᛝ are generated when the main lines of construction intersect. Red arrow down - recommended sales Blue up arrow - recommended purchases rare purple arrows indicate exce
Line Magnit
Aleksey Trenin
The LineMagnit Indicator for MT4 is a highly precise tool that builds support and resistance levels which magnetically attract prices. This feature allows traders to easily determine the most probable entry and exit points in the market, as well as identify the market's directional forces, as levels are based on capital inflows into the instrument. Equipped with an intuitively understandable graphical interface, the LineMagnit Indicator enables users to quickly locate and analyze support and res
Alpha Trend
Evgeny Belyaev
3 (4)
Alpha Trend is a trend indicator for the MetaTrader 4 platform; it has been developed by a group of professional traders. The Alpha Trend indicator finds the most probable tendency reversal points, which allows making trades at the very beginning of a trend. This indicator features notifications, which are generated whenever a new signal appears (alert, email, push-notification). This allows you to open a position in a timely manner. Alpha Trend does not redraw, which makes it possible to evalua
Alpha Trend sign has been a very popular trading tool in our company for a long time. It can verify our trading system and clearly indicate trading signals, and the signals will not drift. Main functions: Based on the market display of active areas, indicators can be used to intuitively determine whether the current market trend belongs to a trend market or a volatile market. And enter the market according to the indicator arrows, with green arrows indicating buy and red arrows indicating se
Overview Candle Timer Countdown Pro for MT4 is a candlestick close countdown indicator for MetaTrader 4. It displays the time remaining until the current candle closes directly on the chart, paired with a circular progress arc so traders can understand the candle's current stage at a glance. Unlike basic countdown indicators that refresh only when a new tick arrives, this indicator uses server-time anchoring with local-clock interpolation. The countdown stays stable even when ticks are sparse, r
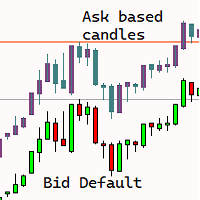
Are you tired of the uncertainty that arises when your orders fail to stop at a specific line due to the spread? Look no further! Introducing our  indicator that plots candlesticks based on the Ask price instead of the traditional bid-based chart commonly used in MQL4. With this indicator, you can say goodbye to the frustrations caused by the bid-based chart, as it provides you with a more accurate representation of market movements. By utilizing the Ask price, which represents the price at whic
"Dynamic Trading Oscillator" - is an advanced custom Crypto_Forex indicator - efficient Trading tool for MT4!  - New generation of Oscillators - see pictures to check how to use it. - Dynamic Trading Oscillator has adaptive Oversold/Overbought zones. - Oscillator is an auxiliary tool to find exact entry points from dynamic OverSold/OverBought areas. - Oversold values: below Blue line, Overbought values: above Red line . - This indicator is great to combine with Price Action patterns as well. -
The   Trendlines Oscillator   helps traders identify trends and momentum based on the normalized distances between the current price and the most recently detected bullish and bearish trend lines. The indicator features bullish and bearish momentum, a signal line with crossings, and multiple smoothing options. USAGE The   Trendlines Oscillator   works by systematically: Identifying pivot highs and lows. Connecting pivots to form bullish (support) and bearish (resistance) trendlines. Measuring
Trade with Gann on your side!! MASTER CIRCLE 360 CIRCLE CHART, originally created by Gann admitted that this is “The Mother of all charts”. It is one of the last studies that this great trader left for us. The numeric tab le is apparently quite simple like all the tables and is based on square numbers, the SQUARE OF 12 and is by evolution, one of the most important square numbers. Here we can find CYCLE, PRICE AND TIME thanks to angles and grades, to show past and future support and resistance.
Lyne
Maksim Kalachev
About the Lyne indicator Lyne is a Metatrader 4 (MT4) indicator, the essence of which is to transform the accumulated historical data. The Lyne indicator makes it possible to detect various features and patterns in price dynamics that are invisible to the naked eye. Based on this information, traders can anticipate further price movement and adjust their strategy accordingly. This indicator has proven itself in the scalping strategy. The indicator works without repainting.
Chart Patterns Detect 15 patterns (Ascending Triangle, Descending Triangle, Rising Wedge, Falling Wedge, Bullish Flag, Bearish Flag, Bullish Rectangle, Bearish Rectangle Symmetrical triangle, Head and Shoulders, Inverted Head and Shoulders, Triple top, Triple Bottom, Double Top, Double Bottom) Use historical data to calculate the probability of each pattern to succeed (possibility to filter notification according to the chance of success) gives graphic indication about the invalidation level and
"Impulses and Corrections 4" is created to help traders navigate the market situation. The indicator shows multi-time frame upward and downward "Impulses" of price movements. These impulses are the basis for determining the "Base" , which is composed of zones of corrections of price movements, as well as "Potential" zones for possible scenarios of price movement. Up and down impulses are determined based on a modified formula of Bill Williams' "Fractals" indicator. The last impulse is always "U
EZZ Zig Zag MT4
Paulo Rocha
5 (1)
EZZ Elite Zig Zag is an indicator for the MetaTrader 4 terminal. This indicator traces the peak of the trend based on the market reversal, thus showing various opportunities in the financial market. EZZ Elite Zig Zag is a visual tool, intuitive, and easy to understand and use.  Test it Yourself by Downloading it for Free. Author Paulo Rocha all rights reserved
Buyers of this product also purchase
Trend SniperX MT4
Sarvarbek Abduvoxobov
5 (5)
Trend Sniper X is a multi-timeframe trend-following indicator for MetaTrader 5 that helps traders identify trend direction and potential reversal points with clarity and precision. For MT5: https://www.mql5.com/en/market/product/181101 Price Information: The current price is promotional and is subject to change as upcoming updates and new features are released. Code2Profit Channel Master the Market with Multi-Timeframe Analysis! How to Maximize Your Win Rate with Trend Sniper X: Key Rules & Sess
AW Prime Oscillator
AW Trading Software Limited
5 (1)
A combination of two oscillators. The first one displays the entry points, the second shows the current trend . The indicator can display oscillator signals by arrows in two modes, all fast oscillator signals or signals only in the direction of the current trend. It has a multi-timeframe panel and three types of signal notifications. Benefits: Suitable for day and scalping trading Trend filtering Simple and sensitive setup Multi-timeframe panel Suitable for integration into an advisor. Works on
Zoryk Gold mt4
Reda El Koutbane
5 (3)
discount ends soon original price 69 $ ZORYK — Advanced XAUUSD Signal System for MetaTrader 4 You know the feeling. You spend time analyzing gold. You wait for the entry. You finally open the trade, and price immediately moves against you. You close too early, move the Stop Loss, or hesitate for a few seconds. Then the market reaches the exact destination you originally expected without you. The direction was not always the problem. The real problem was uncertainty. You did not know exactl
Super Signal – Skyblade Edition Professional No-Repaint / No-Lag Trend Signal System with Exceptional Win Rate | For MT4 / MT5 It works best on lower timeframes, such as 1-minute, 5-minute, and 15-minute charts. Core Features: Super Signal – Skyblade Edition is a smart signal system designed specifically for trend trading. It applies a multi-layered confirmation mechanism to detect only strong, directional moves supported by real momentum. This system does not attempt to predict tops or bottoms
Tokyo mt4 Indicator
Vasiliy Strukov
5 (9)
Tokyo Indicator provides a clear visual overview of trend direction, potential trading signals, and market conditions. Its colour-coded, stepped trend line distinguishes bullish phases in blue from bearish phases in magenta. Matching directional arrows highlight potential buying and selling opportunities when the displayed trend changes. An integrated dashboard brings together the current signal, market bias, momentum, volatility, and signal quality in one convenient view. This allows traders t
Atomic Analyst
Issam Kassas
5 (14)
Atomic Analyst — MetaTrader 4 For product questions, setup guidance, or technical support, message me directly here on MQL5. The indicator turns complex market calculations into simple visual signals, color-coded candles, trend readings, stop-loss levels, and multiple take-profit zones that traders can understand quickly and use in real market conditions. Main Trading Uses: Scalping and intraday trading: Designed for fast decision-making, clear arrows, alerts, candle colors, and structured entry
Trading Special – 30% OFF Best Solution for any Newbie or Expert Trader! This dashboard software is working on 28 currency pairs plus one. It is based on 2 of our main indicators (Advanced Currency Strength 28 and Advanced Currency Impulse). It gives a great overview of the entire Forex market plus Gold or 1 indices. It shows Advanced Currency Strength values, currency speed of movement and signals for 28 Forex pairs in all (9) timeframes. Imagine how your trading will improve when you can watch
SR Liquidity
Oleg Rodin
5 (2)
SR Liquidity is a trading indicator designed to reveal the hidden zones where market liquidity concentrates and price reacts most strongly. These special liquidity areas act as powerful support and resistance levels, giving you a clear map of where the market is most likely to reverse. Instead of drawing ordinary Support/Resistance lines, SR Liquidity analyzes real price behavior to detect the zones where buying and selling pressure accumulate. These are actually the pools of liquidity that driv
M1 Sniper
Oleg Rodin
4.97 (30)
M1 SNIPER  is an easy to use trading indicator system. It is an arrow indicator which is designed for M1 time frame. The indicator can be used as a standalone system for scalping on M1 time frame and it can be used as a part of your existing trading system. Though this trading system was designed specifically for short-term trading, it still can be helpful for all traders. This trading system can be used with any forex pair and time frame, though lower time frames are recommended from M1 up to M
Liquidity Scalper System: a liquidity-based trading system in indicator form. Most indicators only show an arrow, and the trader then has to decide where the stop goes, where the target is and whether the signal can be trusted at all. Liquidity Scalper System covers the full trade cycle: it finds liquidity pools, gives a signal when they are broken, immediately calculates Entry, Stop Loss and three targets, and shows statistics and out-of-sample test results on the panel. The system picks its o
Smart Trend Trading System is a chart indicator for MetaTrader 4 that brings trend information, entry and exit signals, and price levels into one workspace. It combines 10+ trading tools into one system, including trend detection, reversal zones, smart cloud, trailing stop logic, support and resistance, candle coloring, alerts, and multi-timeframe analysis. The system is designed to help you trade different market conditions: Trending markets: Identify the main trend, detect pullbacks, follow mo
Advanced Supply Demand
Bernhard Schweigert
4.91 (302)
Trading Special – 30% OFF Best Solution for any Newbie or Expert Trader! This indicator is a unique, high quality and affordable trading tool because we have incorporated a number of proprietary features and a new formula. With this update, you will be able to show double timeframe zones. You will not only be able to show a higher TF but to show both, the chart TF, PLUS the higher TF: SHOWING NESTED ZONES. All Supply Demand traders will love it. :) Important Information Revealed Maximize the pot
This is a professional chart indicator designed for traders focused on stability and clear price action. It helps filter market noise and provides clear visual entry and exit zones for your trading decisions. Core Features: Strictly Non-Repainting: The system is built with strict non-repaint logic. What you see on the chart is the true historical performance. Confirmed Signals: Signals are triggered and confirmed only after the candle closes . Once a trading arrow appears on a closed candle, it
PRO Renko System
Oleg Rodin
5 (31)
PRO Renko System is a highly accurate trading system specially designed for trading RENKO charts. The ARROWS and Trend Indicators DO NOT REPAINT! The system effectively neutralizes so called market noise giving you access to accurate reversal signals. The indicator is very easy to use and has only one parameter responsible for signal generation. You can easily adapt the tool to any trading instrument of your choice and the size of the renko bar. I am always ready to provide extra support to help
Currency Strength Wizard is a very powerful indicator that provides you with all-in-one solution for successful trading. The indicator calculates the power of this or that forex pair using the data of all currencies on multiple time frames. This data is represented in a form of easy to use currency index and currency power lines which you can use to see the power of this or that currency. All you need is attach the indicator to the chart you want to trade and the indicator will show you real str
CRT Multi-Timeframe Market Structure & Liquidity Sweep Indicator Non-Repainting | Multi-Asset | MT5 Version Available MT5 Version:   https://www.mql5.com/en/market/product/162075 Full User Guide — explains what each feature does and why:   https://www.mql5.com/en/blogs/post/767525 Quick Start User Guide  — explains how to configure and in what order:  https://www.mql5.com/en/blogs/post/767540 Indicator Overview CRT Ghost Candle HTF Fractal is a complete institutional-grade market structure too
Day Trader Master is a complete trading system for traders who prefer intraday trading. The system consists of two indicators. The main indicator is the one which is represented by arrows of two colors for BUY and SELL signals. This is the indicator which you actually pay for. I provide the second indicator to my clients absolutely for free. This second indicator is actually a good trend filter indicator which works with any time frame. THE INDICATORS DO NOT REPAINT AND DO NOT LAG! The system is
Gann Made Easy
Oleg Rodin
4.82 (174)
Gann Made Easy is a professional and easy to use Forex trading system which is based on the best principles of trading using the theory of W.D. Gann. The indicator provides accurate BUY and SELL signals including Stop Loss and Take Profit levels. You can trade even on the go using PUSH notifications. PLEASE CONTACT ME AFTER PURCHASE TO GET TRADING  INSTRUCTIONS   AND GREAT EXTRA INDICATORS  FOR FREE! Probably you already heard about the Gann trading methods before. Usually the Gann theory is a
Pips Generator
Oleg Rodin
4.6 (10)
Apollo Pips Generator  is a channel based indicator which provides entry signals in the direction of the trend. The indicator provides multiple entry points so you can always find a trading opportunity to profit on. The tool also provides you with clear exit signals in a form of stars. ALL SIGNALS DO NOT REPAINT! The indicator can be used with any forex pair and time frame. The indicator provides all types of alerts including PUSH notifications. PLEASE CONTACT ME AFTER PURCHASE TO GET TRADING IN
All in One package includes the  Oscillator Predictor ,  MACD Predictor ,  Thrust Scanner  and  Advanced Fibonacci  indicators which are mandatory for applying  Dinapoli  trade plans.  Please visit below links for detailed explanations of indicators. Advanced Fibonacci Indicator =>  https://www.mql5.com/en/market/product/52834 Thrust Scanner Indicator => https://www.mql5.com/en/market/product/52830 Overbought /Oversold Predictor indicator => https://www.mql5.com/en/market/product/52621 Macd P
Trading Special –40% OFF Best Solution for any Newbie or Expert Trader! This Indicator is a unique, high quality and affordable trading tool because we have incorporated a number of proprietary features and a new formula. With only ONE chart you can read Currency Strength for 28 Forex pairs! Imagine how your trading will improve because you are able to pinpoint the exact trigger point of a new trend or scalping opportunity? User manual: click here That's the first one, the original! Don't buy a
An arrow tells you to buy. Obsidian Scalper Pro tells you where to buy, where the stop goes, where the three targets are, how big the position should be for your risk, and how good the setup is out of 100. Every signal arrives as a finished trade plan drawn on the chart, and a built in statistics window shows the honest result of the last hundred of them, win rate with a confidence interval and all. Every decision is made on a closed bar, so the history you are looking at is the history you woul
GoldRush Trend Arrow Signal V1.6 The GoldRush Trend Arrow Signal indicator V1.6 continues to provide precise, real-time trend analysis tailored for high-speed, short-term scalpers in XAU/USD , but it now has additional features and improved efficiency and reliability. Built specifically for the 1-minute time frame, this tool displays directional arrows for clear entry points, allowing scalpers to navigate volatile market conditions with confidence. The indicator consists of PRIMARY and SECONDARY
UR TrendExhaustion
Krzysztof Jan Debski
UR TrendExhaustion   UR   TrendExhaustion is the best solution for traders who don't want to deal with parameter values nor other set-ups - it is both easy and visually-understandable for everyone. Advantages of using UR TrendExhaustion: No parameters You have 3 lines that describe best what's going on on the chart:   Trend Exhaustion Line ,   Whale Money Line   and   Retail Money Line . The interface showcases the exhaustion of either line on both extremes (red areas) The best advantage: Easy a
Alright. This indicator works on MT4 and is very easy to use. When you receive a signal from it, you wait for that candle with the signal to close and you enter your trade at the beginning of the next new candle. A red arrow means sell and a green arrow means buy. All arrows comes with a long dotted like for easy identification of trade signal. Are you okay with that?   100% non repaint Work All Major currency  Pair,  1 minute time frame 1 minute expire
Neuro Poseidon MT4
Daria Rezueva
4.74 (46)
Neuro Poseidon is a new indicator by Daria Rezueva. It combines precise trading signals with adaptive TP/SL levels - creating best possible trades as a result! Message me and get  Neuro Poseidon Assistant  as a gift to automize your trading process! What makes it stand out? 1. Proven profitability on all assets and timeframes 2. Only confirmed BUY and SELL signals present on the chart 3. Adaptive TP & SL levels generated by the software for each trade 4. Easy to understand - suitable for all
This indicator works on MT4 and is very easy to use. When you receive a signal from it, you wait for that candle with the signal to close and you enter your trade at the beginning of the next new candle . A red arrow means sell and a green arrow means buy. All arrows comes with Alert  like for easy identification of trade signal. Are you okay with that? 1 minute candle 1 minute expire
Scalper Vault
Oleg Rodin
5 (40)
Scalper Vault is a powerful, fully-equipped trading system designed for traders who want to achieve consistency in intraday trading . This high-precision indicator serves as a complete, standalone trading system that delivers institutional-grade analysis for both Forex and Binary Options traders. PLEASE CONTACT ME AFTER PURCHASE TO GET MY TRADING TIPS PLUS A GREAT BONUS! By eliminating the guesswork and complex manual analysis, Scalper Vault allows you to focus purely on execution using easy t
Trend Lines PRO
Roman Podpora
5 (1)
TREND LINES PRO    helps understand where the market is truly changing direction. The indicator shows real trend reversals and points where major players re-enter. You see   BOS lines   Trend changes and key levels on higher timeframes — without complex settings or unnecessary noise. Signals don't repaint and remain on the chart after the bar closes. VERSION MT 5     -     Reveals its maximum potential when paired with the   RFI LEVELS PRO  indicator What the indicator shows: Real shifts   tren
Extreme Value Sniper is a detrended price indicator  Indicator finds the potential reversal levels by checking value ranges and price cycles. MT5 Version of the product :  https://www.mql5.com/en/market/product/114550 It shows the overbought and oversold levels using the average range. Overbought Levels are between 4 and 10 Oversold levels are bewtween -4 and -10 Those levels can be used as a reversal levels. Extreme Value Sniper look for some special divergence and convergence patterns to c
More from author
FVG DGT Panel [TMT] — Fair Value Gap and Inverse FVG Indicator with Live "% Left" Fill Tracking for MetaTrader 4 Version for MT4 | Non-repainting zone logic | BUY / SELL / NEUTRAL bias panel | FVG + IFVG | Optional second timeframe 1. Overview FVG DGT Panel [TMT] is a chart-window indicator for MetaTrader 4 that finds, draws and tracks Fair Value Gaps (FVG) and Inverse Fair Value Gaps (IFVG) directly on your price chart. It is a MetaTrader 4 port of the popular "Fair Value Gaps by DGT" concept
TMT Squeeze Momentum - Volatility Squeeze Dots, Momentum Histogram, Strength Panel and Alerts for MetaTrader 4 Squeeze ON / OFF dots | Linear-regression momentum histogram | Buyers vs Sellers strength % | Popup, sound, push and email alerts 1. Overview TMT Squeeze Momentum is an indicator for MetaTrader 4 that runs in its own sub-window below the price chart. It answers two questions at the same time: Is volatility compressing?   Dots on the zero line show whether the market is in a "squeeze", w
Filter:
No reviews
Reply to review