Zero Lag Real Time Trend Signal MTF

Zero Lag Real Trend Signals (MTF) — Zero-Lag Trend Line, Volatility Bands, Entry Arrows, Alerts and a 9-Timeframe Trend Panel for MetaTrader 4

Zero-lag basis | ATR deviation bands | Trend flip arrows | Pullback entry arrows | Popup alerts | Multi-timeframe panel

1. Overview

Zero Lag Real Trend Signals (MTF) is a chart-window indicator for MetaTrader 4. It draws a zero-lag moving average (the "basis") surrounded by volatility bands, colors the chart according to the current trend, marks trend changes and pullback entries with arrows, and shows the trend of up to nine timeframes in a compact panel.

The goal is to give you a quick, readable answer to three questions:

  • What is the trend right now? The basis line and the shaded area between the basis and the active band are green-teal in a bullish trend and red in a bearish trend.
  • When did the trend change? An arrow appears on the bar where price closes beyond the opposite band.
  • Is there a pullback entry inside the trend? A second type of arrow appears when price crosses back over the basis while the trend is still intact.

The multi-timeframe panel adds the bigger picture. Without leaving your chart you can see whether M1, M5, M15, M30, H1, H4, D1, W1 and MN1 (or any other set of timeframes you select) are bullish, bearish or neutral.

This MT4 version is a conversion of the "Zero Lag Trend Signals (MTF)" Pine Script by AlgoAlpha, published under the Mozilla Public License 2.0. The indicator only draws on the chart and sends alerts. It never opens, closes or modifies trades.

2. How the Indicator Works

2.1 The zero-lag basis

A normal EMA follows price with a delay. This indicator reduces that delay with a simple lag-compensation step before smoothing:

  1. It calculates a lag value: lag = (Length - 1) / 2, using whole numbers. With the default Length of 70, the lag is 34 bars.
  2. It builds a compensated price: source = close + (close - close of "lag" bars ago). When price is rising, this pushes the source above the close, and when price is falling it pushes the source below the close.
  3. It smooths that source with an exponential moving average whose smoothing factor is 2 / (Length + 1).

The result is a trend line that reacts faster than a plain EMA of the same length. "Zero lag" describes the method used to reduce delay. It does not mean the line has no delay at all, and no moving average can predict price.

2.2 The volatility bands

Around the basis the indicator draws two bands:

  • The indicator takes the ATR (Average True Range) with the same period as Length.
  • It then finds the highest ATR value over the last 3 × Length bars. Using the highest recent value keeps the bands wide enough to stay stable after volatile periods.
  • That value is multiplied by the Band Multiplier (default 1.2) to get the band distance.
  • Upper band = basis + distance. Lower band = basis - distance.

2.3 The trend rule

The trend only changes when price breaks out of the band on the opposite side:

  • Bullish trend starts when a candle closes above the upper band and the previous candle had not closed above the previous upper band.
  • Bearish trend starts when a candle closes below the lower band and the previous candle had not closed below the previous lower band.
  • Between those events the trend state is kept. Small moves around the basis do not change the trend, so the indicator is less sensitive to ordinary noise than a simple moving average cross.

3. What You See on the Chart

  • Zero Lag Basis line. Green-teal while the trend is bullish and red while it is bearish. By default it is a solid line with width 2.
  • Active deviation band. In a bullish trend, the lower band is drawn as a dotted line. In a bearish trend, the upper band is drawn as a dotted line. The band on the other side is hidden, which keeps the chart clean.
  • Trend fill. A shaded area between the basis and the active band. Dark teal for bullish, dark red for bearish.
  • Trend flip arrows. An up arrow at the lower band when a bullish trend starts. A down arrow at the upper band when a bearish trend starts.
  • Entry arrows. An up arrow below the basis for a bullish entry and a down arrow above the basis for a bearish entry (see section 4).
  • Multi-timeframe panel. A small table, by default in the upper-right corner of the chart.

All colors can be changed in the inputs.

4. Trend Flip Signals and Entry Signals

The indicator shows two different kinds of arrows. They mean different things.

4.1 Trend flip

A trend flip marks the bar where the trend changes direction, as described in section 2.3.

  • Bullish flip: a candle closes above the upper band after the previous bar was not above its upper band. The arrow is drawn at the lower band.
  • Bearish flip: a candle closes below the lower band after the previous bar was not below its lower band. The arrow is drawn at the upper band.

4.2 Entry signal

An entry signal looks for a pullback inside a trend that is already running. It requires that the trend did not just change.

  • Bullish entry: the trend is bullish and was also bullish on the previous bar, the candle closes above the basis, and the previous candle had closed at or below the previous basis. In other words, price dipped to the basis and closed back above it.
  • Bearish entry: the trend is bearish and was also bearish on the previous bar, the candle closes below the basis, and the previous candle had closed at or above the previous basis.

The entry arrow is placed at a distance of 1.5 times the band distance from the basis (below it for bullish, above it for bearish) so that it stays clear of the candles.

4.3 How traders may read them

Some traders treat a flip as a possible start of a new move and an entry arrow as a possible continuation point. Others only trade entries that agree with the higher-timeframe panel. These are ways of reading the information, not guarantees. A flip can fail, and an entry can happen right before the trend ends. Always decide your stop, risk and target before acting.

5. The Multi-Timeframe Panel

The panel lists nine timeframes. For each one, the indicator runs the same zero-lag trend calculation on that timeframe's own price data, using the same Length and Band Multiplier, and reports the result:

  • BULLISH (in the bullish color): the latest trend event on that timeframe was a bullish flip.
  • BEARISH (in the bearish color): the latest trend event was a bearish flip.
  • NEUTRAL (silver): no flip has been found yet, or there is not enough history on that timeframe.

Important details:

  • The default timeframes are M1, M5, M15, M30, H1, H4, D1, W1 and MN1. Each of the nine rows can be set to any timeframe in the inputs.
  • The panel works the same on any chart timeframe. It does not depend on the timeframe you are viewing.
  • Each timeframe uses up to its latest 3000 bars for the calculation.
  • The panel refreshes when a new bar opens on the chart you are viewing.
  • You can choose the corner of the chart and the pixel distance from that corner.

A common use is to look for agreement. If the chart trend, the next higher timeframes and the panel all point the same way, the setup has more context than a signal that goes against the larger trend.

6. Alerts

Alerts are controlled by three inputs:

  • Enable alerts turns all alerts on or off.
  • Alert on trend flip sends an alert when a bullish or bearish trend flip arrow has formed.
  • Alert on entry signal sends an alert when a bullish or bearish entry arrow has formed.

Alerts use the standard MT4 popup Alert window and contain the symbol, the chart timeframe and the type of signal, for example "bullish trend flip" or "bearish entry signal". Alerts are checked on the last closed candle, once per new bar, so they refer to a completed bar and not to a candle that is still forming. Push notifications and email are not included in this version.

7. Input Reference

  • Length (default 70): period of the zero-lag EMA and of the ATR. It also sets the lag value and the ATR look-back window (3 × Length). Larger values make a slower, smoother trend. Smaller values react faster and flip more often.
  • Band multiplier (default 1.2): multiplies the highest recent ATR to set the band distance. Larger values give wider bands and fewer trend flips. Smaller values give tighter bands and more flips.
  • Bullish color / Bearish color: colors of the lines, bands and arrows.
  • Bullish fill color / Bearish fill color: colors of the shaded trend area.
  • Timeframe 1 to Timeframe 9 (defaults M1, M5, M15, M30, H1, H4, D1, W1, MN1): the timeframes shown in the panel rows.
  • Enable alerts (default true): master switch for alerts.
  • Alert on trend flip (default true): alert on bullish and bearish flips.
  • Alert on entry signal (default true): alert on bullish and bearish entries.
  • Panel corner (default upper right): corner of the chart where the panel is placed.
  • Panel offset X (default 10): horizontal distance from the selected corner, in pixels.
  • Panel offset Y (default 20): vertical distance from the selected corner, in pixels.

8. Choosing Length and Band Multiplier

The defaults (70 and 1.2) are a general starting point, not a recommendation for every market. As a rough guide:

  • Shorter Length, for example 30 to 50, suits faster trading and lower timeframes, but produces more flips and more false starts in sideways markets.
  • Longer Length, for example 90 to 150, suits swing trading and higher timeframes. Signals are fewer and later.
  • Band multiplier below 1.0 makes flips easier to trigger. Above 1.5 it makes them rare and larger.

Test any change on a demo account and on past data for your own symbol and timeframe before using it with real money. Keep the same settings long enough to judge them.

9. Installation

  1. In MetaTrader 4, open File > Open Data Folder.
  2. Copy the indicator file into MQL4 > Indicators.
  3. If you have the .mq4 source, open it in MetaEditor and press Compile (F7).
  4. In the terminal, right-click Navigator > Indicators and choose Refresh.
  5. Drag Zero Lag Trend Signals (MTF) [AlgoAlpha] from the Navigator onto a chart. Adjust the inputs if you wish and press OK.

For the nine-timeframe panel to be accurate, the terminal needs history for each selected timeframe. If a row shows NEUTRAL when you expect a trend, open that timeframe once on any chart so MT4 downloads its history, then reload the indicator.

10. Notes for Developers

The indicator uses 12 buffers, which can be read with iCustom if you build an Expert Advisor or a script around it:

  • Buffer 0: bullish basis. Buffer 1: bearish basis.
  • Buffer 2: upper band. Buffer 3: lower band.
  • Buffers 4 to 7: values used for the trend fill.
  • Buffer 8: bullish trend flip. Buffer 9: bearish trend flip.
  • Buffer 10: bullish entry. Buffer 11: bearish entry.

Empty buffer values mean "no signal on this bar". The calculation uses up to the latest 5000 bars of the chart.

11. Limitations

  • The current candle can change. Trend and arrows on the candle that is still forming use its live close. A flip or entry arrow may appear and disappear until the candle closes. Use the last closed bar, or the alerts, for confirmed signals.
  • It is a lagging tool. Zero-lag methods reduce delay but cannot remove it. Flips are confirmed after price breaks a band.
  • Sideways markets. Like any trend tool, it can produce several flips in a range.
  • Panel timing. The panel refreshes on each new chart bar, not on every tick.
  • Alerts are popup alerts only.
  • Broker data differs. Different brokers have different history and spreads, so signals can differ slightly between brokers.

12. Frequently Asked Questions

Does the indicator trade for me? No. It draws on the chart and can show alerts. You place and manage every trade yourself.

Does it repaint? Signals on closed candles do not change. The candle that is still forming can change until it closes, as explained in section 11.

Which markets and timeframes can I use? Any symbol available in your MT4 and any chart timeframe.

Why does the panel show NEUTRAL for a timeframe? Either that timeframe has not produced a flip within the history used, or the terminal does not have enough bars for it. Load that timeframe's history and reload the indicator.

Can I change which timeframes are shown? Yes. Each of the nine rows has its own timeframe input.

Can I move the panel? Yes, choose the corner and the pixel offsets.

Why are there two kinds of up arrows? One marks the start of a new trend (flip) at the band. The other marks a pullback entry inside a running trend, placed away from the basis.

13. Credits and Risk Disclaimer

This indicator is a MetaTrader 4 conversion based on the Zero Lag Trend Signals (MTF) Pine Script by AlgoAlpha, published under the Mozilla Public License 2.0 (https://mozilla.org/MPL/2.0/). All trademarks belong to their respective owners.

Risk warning. Trading foreign exchange, CFDs, metals, indices and cryptocurrencies involves a high level of risk and may not be suitable for everyone. You can lose some or all of your capital. This indicator is an analytical tool that displays information based on past price data. It does not predict the future, does not guarantee profits and is not financial advice. Test on a demo account first, use proper risk management, and never risk money you cannot afford to lose.



Önerilen ürünler
Power Renko is an indicator which plots Renko bricks underneath the chart using a histogram. You can select the brick size and the timeframe of the Renko bricks as well as whether or not to use the close price or the high/low price of the candles. Renko bricks are based on price alone, not time, therefor the Renko bricks will not be aligned with the chart's time. They are extremely useful for trend trading and many different strategies can be formed from them. Buffers are provided allowing you t
Trend Osilatörü - gelişmiş bir özel Crypto_Forex göstergesi, etkili bir ticaret aracıdır! - Gelişmiş yeni hesaplama yöntemi kullanılır - "Hesaplama için fiyat" parametresi için 20 seçenek. - Şimdiye kadar geliştirilen en akıcı osilatör. - Yükselen trendler için yeşil renk, düşen trendler için kırmızı renk. - Aşırı satım değerleri: 5'in altında, Aşırı alım değerleri: 95'in üzerinde. - Bu göstergeyle standart stratejileri bile yükseltmek için birçok fırsat vardır. - PC ve Mobil uyarılarla. Yüksek
Bu, bir mumun kapanış fiyatını tahmin eden bir göstergedir. Gösterge öncelikle D1 çizelgelerinde kullanılmak üzere tasarlanmıştır. Bu gösterge hem geleneksel forex ticareti hem de ikili opsiyon ticareti için uygundur. Gösterge, bağımsız bir ticaret sistemi olarak kullanılabilir veya mevcut ticaret sisteminize ek olarak hareket edebilir. Bu gösterge, mevcut mumu analiz ederek mumun gövdesi içindeki belirli güç faktörlerini ve önceki mumun parametrelerini hesaplar. Böylece gösterge, piyasa hareket
"Auto FIBO Pro" Crypto_Forex göstergesi - ticarette harika bir yardımcı araçtır! - Gösterge, Fibo seviyelerini ve yerel trend çizgilerini (kırmızı renk) otomatik olarak hesaplar ve grafikte yerleştirir. - Fibonacci seviyeleri, fiyatın tersine dönebileceği önemli alanları gösterir. - En önemli seviyeler %23,6, %38,2, %50 ve %61,8'dir. - Ters scalping veya bölge ızgara ticareti için kullanabilirsiniz. - Auto FIBO Pro göstergesini kullanarak mevcut sisteminizi geliştirmek için birçok fırsat vardır
The Stepping Trend Indicator     The Steppi ng Trend indicator uses the  average true range  (ATR indicator) in its calculation. This gives you control to set your own average true range period, I set the Default as 10.   Indicator Details. Green Arrow Up: This means you are at the starting point of a new bullish trend, it’s time to buy.   Red  Arrow  Down : This means you are at the starting point of a new  bearish  trend, it’ s time to sell .   What if you miss the Arrow Signal?   No prob
Trendiness Index
Libertas LLC
5 (3)
"The trend is your friend" is one of the best known sayings in investing, because capturing large trendy price movements can be extremely profitable. However, trading with the trend is often easier said than done, because many indicators are based on price reversals not trends. These aren't very effective at identifying trendy periods, or predicting whether trends will continue. We developed the Trendiness Index to help address this problem by indicating the strength and direction of price trend
Advanced Trend Regime
Shellard Securities (Pty) Ltd
The indicator has been designed to function on any time-frame and any pair.   This regime filter will help the trader better evaluate whether the current market is trending, and in which direction. It quickly reacts to changes in market dynamics using a series of advanced calculations. The user is able to select whether the calculation remains standard, or if a further filter constraint is added to the calculation.   A Yellow moving average of the signal has been included for the trader to smoot
The indicator displays the data of the Stochastic oscillator from a higher timeframe on the chart. The main and signal lines are displayed in a separate window. The stepped response is not smoothed. The indicator is useful for practicing "manual" forex trading strategies, which use the data from several screens with different timeframes of a single symbol. The indicator uses the settings that are identical to the standard ones, and a drop-down list for selecting the timeframe. Indicator Paramet
PipFinite Trend PRO
Karlo Wilson Vendiola
4.88 (2252)
Breakthrough Solution For Trend Trading And Filtering With All Important Features Built Inside One Tool! Trend PRO's smart algorithm detects the trend, filters out market noise and gives entry signals with exit levels. The new features with enhanced rules for statistical calculation improved the overall performance of this indicator. Important Information Revealed Maximize the potential of Trend Pro, please visit www.mql5.com/en/blogs/post/713938 The Powerful Expert Advisor Version Automatin
Infinity Trend Pro
Yaroslav Varankin
1 (1)
This is a trend indicator without redrawing Developed instead of the binary options strategy (by the color of the Martingale candlestick) Also works well in forex trading When to open trades (binary options) A signal will appear in the place with a candle signaling the current candle It is recommended to open a deal for one candle of the current timeframe M1 and M5 When a blue dot appears, open a deal up When a red dot appears, open a trade down. How to open trades on Forex. When a signal is rec
Rainbow Price Visualizer v1.21 See where the market really breathes. Turns your MT4 chart into an ultra-precise heatmap that highlights price zones favored by big players. Why it matters 300 price levels at 0.2‑pip resolution — microscopic detail. 8 visual themes (Rainbow, Fire, Ocean…) for instant readibility. Smart opacity: low noise fades, real zones pop. Lightweight rendering with automatic cleanup. Fully customizable: saturation, opacity, resolution, history depth. Bands project into the f
Color Stochastic Enhanced Stochastic Oscillator with Cross Detection and Visual Signal Support Overview Color Stochastic is a customized version of the classic Stochastic Oscillator designed for momentum analysis and crossover visualization. The indicator provides color-based signal marking and configurable crossover detection at user-defined overbought and oversold levels. It can be used as part of: Momentum analysis Mean reversion workflows DCA-based strategies Multi-indicator confirmation sys
[ZhiBiCCI] indicators are suitable for all cycle use, and are also suitable for all market varieties. [ZhiBiCCI] Green solid line is a reversal of bullish divergence. The green dotted line is a classic bullish divergence. [ZhiBiCCI] The solid line to the red is a reverse bearish divergence. The red dotted line is a classical bearish divergence. [ZhiBiCCI] can be set in the parameters (Alert, Send mail, Send notification), set to (true) to send instant signals to the alarm window, email, insta
Insider Scalper Binary This tool is designed to trade binary options. for short temporary spends. to make a deal is worth the moment of receiving the signal and only 1 candle if it is m1 then only for a minute and so in accordance with the timeframe. for better results, you need to select well-volatile charts.... recommended currency pairs eur | usd, usd | jpy .... the indicator is already configured, you just have to add it to the chart and trade .... The indicator signals the next candle.
Super Reversal Pattern
Parfait Mujinga Ndalika
Super Reversal Pattern Indicator Unlock the power of advanced pattern recognition with our Super Reversal Pattern Indicator. Designed for traders seeking precision and reliability, this indicator identifies one of the most effective reversal patterns in technical analysis, offering a significant edge in your trading strategy. Key Features: Non-Repainting Accuracy: Enjoy the confidence of non-repainting technology. Once a Super Reversal Pattern is detected, it remains static, providing consiste
Wave Wolf MT4
Andrei Salanevich
Forex Dalga Kurt MT4 göstergesi, Wolf dalgalarını aramak ve mevcut ticaret terminali penceresinde görüntülemek için tasarlanmıştır. Ticarette Wolfe dalgalarını kullanan tüccarlar için mükemmel bir gösterge. Ticaret stratejilerinde kullanımı, verimliliğini ve karlılığını önemli ölçüde artıracaktır. GÖSTERGE BİLGİSİ Diğer Wolf dalga göstergelerinin aksine, forex Wave Wold MT4 göstergesinin etkinliğini önemli ölçüde artıran birçok özelliği vardır: Birincisi, Açık Windows 5Point (true) ayarı bilg
An indicator of pattern #31 ("Long Island") from Encyclopedia of Chart Patterns by Thomas N. Bulkowski. The second gap is in the opposite direction. Parameters: Alerts - show alert when an arrow appears   Push - send a push notification when an arrow appears (requires configuration in the terminal) GapSize - minimum gap size in points ArrowType - a symbol from 1 to 17 ArrowVShift - vertical shift of arrows in points   ShowLevels - show levels ColUp - color of an upward line ColDn - color of a
Inguz 4
Maxim Kuznetsov
Ing (inguz,ingwar) - the 23rd rune of the elder Futhark ᛝ, Unicode+16DD. Add some runic magic to your trading strategies. The correct marking of the daily chart will indicate to you the successful moments for counter-trend trading. Simple to use, has high efficiency in volatile areas. Be careful in lateral movements. Signals ᛝ are generated when the main lines of construction intersect. Red arrow down - recommended sales Blue up arrow - recommended purchases rare purple arrows indicate exce
The LineMagnit Indicator for MT4 is a highly precise tool that builds support and resistance levels which magnetically attract prices. This feature allows traders to easily determine the most probable entry and exit points in the market, as well as identify the market's directional forces, as levels are based on capital inflows into the instrument. Equipped with an intuitively understandable graphical interface, the LineMagnit Indicator enables users to quickly locate and analyze support and res
Alpha Trend
Evgeny Belyaev
3 (4)
Alpha Trend is a trend indicator for the MetaTrader 4 platform; it has been developed by a group of professional traders. The Alpha Trend indicator finds the most probable tendency reversal points, which allows making trades at the very beginning of a trend. This indicator features notifications, which are generated whenever a new signal appears (alert, email, push-notification). This allows you to open a position in a timely manner. Alpha Trend does not redraw, which makes it possible to evalua
Alpha Trend sign has been a very popular trading tool in our company for a long time. It can verify our trading system and clearly indicate trading signals, and the signals will not drift. Main functions: Based on the market display of active areas, indicators can be used to intuitively determine whether the current market trend belongs to a trend market or a volatile market. And enter the market according to the indicator arrows, with green arrows indicating buy and red arrows indicating se
Genel Bakış Candle Timer Countdown Pro for MT4 , MetaTrader 4 için bir mum kapanış geri sayım göstergesidir. Mevcut mumun kapanmasına ne kadar süre kaldığını doğrudan grafikte gösterir ve bunu dairesel bir ilerleme yayıyla birleştirerek yatırımcıların mumun hangi aşamada olduğunu tek bakışta anlamasına yardımcı olur. Yalnızca yeni bir tick geldiğinde yenilenen basit geri sayım göstergelerinden farklı olarak, bu gösterge sunucu zamanı sabitlemesi ve yerel saat enterpolasyonu kullanır. Tick sayısı
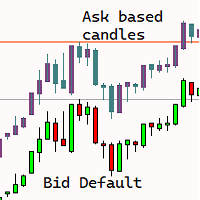
Are you tired of the uncertainty that arises when your orders fail to stop at a specific line due to the spread? Look no further! Introducing our  indicator that plots candlesticks based on the Ask price instead of the traditional bid-based chart commonly used in MQL4. With this indicator, you can say goodbye to the frustrations caused by the bid-based chart, as it provides you with a more accurate representation of market movements. By utilizing the Ask price, which represents the price at whic
"Dinamik İşlem Osilatörü" - gelişmiş, özel bir Kripto-Forex göstergesi - MT4 için verimli bir işlem aracı! - Yeni nesil Osilatörler - nasıl kullanılacağını görmek için resimlere bakın. - Dinamik İşlem Osilatörü, uyarlanabilir Aşırı Satış/Aşırı Alım bölgelerine sahiptir. - Osilatör, dinamik Aşırı Satış/Aşırı Alım bölgelerinden kesin giriş noktalarını bulmak için yardımcı bir araçtır. - Aşırı Satış değerleri: Mavi çizginin altında, Aşırı Alım değerleri: Kırmızı çizginin üzerinde. - Bu gösterge, F
The   Trendlines Oscillator   helps traders identify trends and momentum based on the normalized distances between the current price and the most recently detected bullish and bearish trend lines. The indicator features bullish and bearish momentum, a signal line with crossings, and multiple smoothing options. USAGE The   Trendlines Oscillator   works by systematically: Identifying pivot highs and lows. Connecting pivots to form bullish (support) and bearish (resistance) trendlines. Measuring
Trade with Gann on your side!! MASTER CIRCLE 360 CIRCLE CHART, originally created by Gann admitted that this is “The Mother of all charts”. It is one of the last studies that this great trader left for us. The numeric tab le is apparently quite simple like all the tables and is based on square numbers, the SQUARE OF 12 and is by evolution, one of the most important square numbers. Here we can find CYCLE, PRICE AND TIME thanks to angles and grades, to show past and future support and resistance.
Lyne
Maksim Kalachev
About the Lyne indicator Lyne is a Metatrader 4 (MT4) indicator, the essence of which is to transform the accumulated historical data. The Lyne indicator makes it possible to detect various features and patterns in price dynamics that are invisible to the naked eye. Based on this information, traders can anticipate further price movement and adjust their strategy accordingly. This indicator has proven itself in the scalping strategy. The indicator works without repainting.
Chart Patterns Detect 15 patterns (Ascending Triangle, Descending Triangle, Rising Wedge, Falling Wedge, Bullish Flag, Bearish Flag, Bullish Rectangle, Bearish Rectangle Symmetrical triangle, Head and Shoulders, Inverted Head and Shoulders, Triple top, Triple Bottom, Double Top, Double Bottom) Use historical data to calculate the probability of each pattern to succeed (possibility to filter notification according to the chance of success) gives graphic indication about the invalidation level and
"Impulses and Corrections 4" is created to help traders navigate the market situation. The indicator shows multi-time frame upward and downward "Impulses" of price movements. These impulses are the basis for determining the "Base" , which is composed of zones of corrections of price movements, as well as "Potential" zones for possible scenarios of price movement. Up and down impulses are determined based on a modified formula of Bill Williams' "Fractals" indicator. The last impulse is always "U
EZZ Elite Zig Zag is an indicator for the MetaTrader 4 terminal. This indicator traces the peak of the trend based on the market reversal, thus showing various opportunities in the financial market. EZZ Elite Zig Zag is a visual tool, intuitive, and easy to understand and use.  Test it Yourself by Downloading it for Free. Author Paulo Rocha all rights reserved
Bu ürünün alıcıları ayrıca şunları da satın alıyor
Trend SniperX MT4
Sarvarbek Abduvoxobov
5 (5)
Trend Sniper X , işlemcilerin trend yönünü ve olası dönüş noktalarını netlik ve hassasiyetle belirlemelerine yardımcı olan MetaTrader 5 için çoklu zaman dilimli bir trend takip göstergesidir. MT5 İçin: https://www.mql5.com/en/market/product/181101 Fiyat Bilgisi: Mevcut fiyat tanıtım amaçlıdır ve gelecek güncellemeler ile yeni özellikler eklendikçe değişebilir. Code2Profit Kanalı Çoklu Zaman Dilimi Analizi ile Piyasaya Hakim Olun! Trend Sniper X ile Kazanma Oranınızı Nasıl En Üst Düzeye Çıkarırsı

AW Prime Oscillator
AW Trading Software Limited
5 (1)
İki osilatörün birleşimi. Birincisi giriş noktalarını, ikincisi ise mevcut trendi gösterir. Gösterge, osilatör sinyallerini iki modda oklarla görüntüleyebilir; tüm hızlı osilatör sinyalleri veya yalnızca mevcut trend yönündeki sinyaller. Çok zaman dilimli bir panele ve üç tür sinyal bildirimine sahiptir. Faydalar: Günlük ve scalping ticaretine uygundur Trend filtreleme Basit ve hassas kurulum Çoklu zaman dilimi paneli Bir danışmana entegrasyona uygundur. Herhangi bir sembol ve herhangi bir zaman
SR Liquidity
Oleg Rodin
5 (2)
SR Liquidity , piyasa likiditesinin yoğunlaştığı ve fiyatın en güçlü tepkiyi verdiği gizli bölgeleri ortaya çıkarmak için tasarlanmış bir alım-satım göstergesidir. Bu özel likidite alanları güçlü destek ve direnç seviyeleri işlevi görerek, piyasanın yön değiştirme ihtimalinin en yüksek olduğu yerlere dair size net bir harita sunar. SR Liquidity, sıradan Destek/Direnç çizgileri çizmek yerine, alım ve satım baskısının yoğunlaştığı bölgeleri tespit etmek için gerçek fiyat hareketlerini analiz eder.
Super Signal – Skyblade Edition Profesyonel No-Repaint / Gecikmesiz Trend Sinyal Sistemi, Olağanüstü Kazanma Oranı ile | MT4 / MT5 için 1 dakika, 5 dakika ve 15 dakika gibi daha düşük zaman dilimlerinde en iyi şekilde çalışır. Temel Özellikler: Super Signal – Skyblade Edition, özellikle trend bazlı işlemler için geliştirilmiş akıllı bir sinyal sistemidir. Yalnızca güçlü, yönlü ve gerçek momentum destekli piyasa hareketlerini tespit etmek amacıyla çok katmanlı bir filtreleme yapısı kullanır. Bu s
Zoryk Gold mt4
Reda El Koutbane
5 (2)
ZORYK — MetaTrader 4 için gelişmiş XAUUSD sinyal ve işlem planlama sistemi Bu durumu muhtemelen daha önce yaşadınız. Altını analiz edersiniz, giriş için beklersiniz ve sonunda işlemi açarsınız. Fiyat hemen ters yönde hareket eder. Çok erken kapatırsınız, Stop Loss seviyesini değiştirirsiniz veya birkaç saniye tereddüt edersiniz. Kısa süre sonra piyasa, siz işlemde değilken başlangıçta beklediğiniz yöne ve hedefe ulaşır. Sorun her zaman yön değildi. Asıl sorun belirsizlikti. Tam olarak nere
M1 Sniper
Oleg Rodin
4.97 (30)
M1 SNIPER kullanımı kolay bir işlem göstergesi sistemidir. M1 zaman dilimi için tasarlanmış bir ok göstergesidir. Gösterge, M1 zaman diliminde scalping için bağımsız bir sistem olarak kullanılabilir ve mevcut işlem sisteminizin bir parçası olarak kullanılabilir. Bu işlem sistemi özellikle M1'de işlem yapmak için tasarlanmış olsa da, diğer zaman dilimleriyle de kullanılabilir. Başlangıçta bu yöntemi XAUUSD ve BTCUSD ticareti için tasarladım. Ancak bu yöntemi diğer piyasalarda işlem yaparken de ya
Trend Lines PRO
Roman Podpora
5 (1)
TREND ÇİZGİLERİ PRO     Piyasanın gerçek yön değişimini anlamaya yardımcı olur. Gösterge, gerçek trend dönüşlerini ve büyük oyuncuların piyasaya yeniden girdiği noktaları gösterir. Anlıyorsun     BOS hatları  Daha yüksek zaman dilimlerindeki trend değişiklikleri ve önemli seviyeler, karmaşık ayarlar veya gereksiz gürültü olmadan gösterilir. Sinyaller yeniden çizilmez ve çubuk kapandıktan sonra grafikte kalır. VERSION MT 5     -    RFI LEVELS PRO  göstergesiyle birlikte kullanıldığında maksimum p
Atomic Analyst
Issam Kassas
5 (14)
Atomic Analyst — MetaTrader 4 Ürün soruları, kurulum rehberliği veya teknik destek için bana doğrudan MQL5 üzerinden mesaj gönderin. İndikatör, karmaşık piyasa hesaplamalarını basit görsel sinyallere, renk kodlu mumlara, trend okumalarına, stop-loss seviyelerine ve traderların hızlıca anlayıp gerçek piyasa koşullarında kullanabileceği çoklu take-profit bölgelerine dönüştürür. Ana trading kullanım alanları: Scalping ve gün içi işlem: Hızlı karar alma, net oklar, uyarılar, mum renkleri ve yapılan
Smart Trend Trading System, trend bilgilerini, giriş ve çıkış sinyallerini ve fiyat seviyelerini tek bir grafikte birleştiren bir MetaTrader 4 göstergesidir. Trend tespiti, dönüş bölgeleri, Smart Cloud, trailing stop mantığı, destek ve direnç, mum renklendirme, uyarılar ve çoklu zaman dilimi analizi dahil olmak üzere 10’dan fazla trading aracını tek bir sistemde birleştirir. Sistem, farklı piyasa koşullarında işlem yapmanıza yardımcı olmak için tasarlanmıştır: Trend piyasaları: Ana trendi belir
PRO Renko Sistemi, RENKO grafikleri ticareti için özel olarak tasarlanmış son derece hassas bir ticaret sistemidir. Bu, çeşitli ticaret araçlarına uygulanabilen evrensel bir sistemdir. Sistemi etkin piyasa sana doğru ters sinyallerine erişim hakkı denilen ses nötralize eder. Göstergenin kullanımı çok kolaydır ve sinyal üretiminden sorumlu tek bir parametreye sahiptir. Aracı, seçtiğiniz herhangi bir ticaret aracına ve renko çubuğunun boyutuna kolayca uyarlayabilirsiniz. Yazılımımla karlı bir
Currency Strength Wizard , başarılı ticaret için size hepsi bir arada çözüm sağlayan çok güçlü bir göstergedir. Gösterge, birden çok zaman dilimindeki tüm para birimlerinin verilerini kullanarak şu veya bu forex çiftinin gücünü hesaplar. Bu veriler, şu veya bu para biriminin gücünü görmek için kullanabileceğiniz, kullanımı kolay para birimi endeksi ve para birimi güç hatları biçiminde temsil edilir. İhtiyacınız olan tek şey, işlem yapmak istediğiniz tabloya göstergeyi eklemektir ve gösterge size
ŞU ANDA %40INDIRIMLI Yeni Başlayanlar veya Uzman Tüccarlar için En İyi Çözüm! Bu Gösterge benzersiz, yüksek kaliteli ve uygun fiyatlı bir ticaret aracıdır çünkü bir dizi tescilli özellik ve yeni bir formül ekledik. Sadece BİR grafik ile 28 Forex çifti için Döviz Gücünü okuyabilirsiniz! Yeni bir trendin veya scalping fırsatının tam tetik noktasını belirleyebildiğiniz için ticaretinizin nasıl gelişeceğini hayal edin? Kullanım kılavuzu: buraya tıklayın Bu ilk olan, orijinal! Değersiz bir özent
Şu anda %30 İNDİRİMLİ! Herhangi bir Acemi veya Uzman Tüccar için En İyi Çözüm! Bu gösterge paneli yazılımı 28 döviz çifti üzerinde çalışıyor. Ana göstergelerimizden 2'sine (Gelişmiş Para Birimi Gücü 28 ve Gelişmiş Para Birimi Dürtüsü) dayanmaktadır. Tüm Forex piyasasına harika bir genel bakış sağlar. Gelişmiş Para Birimi Gücü değerlerini, para birimi hareket hızını ve tüm (9) zaman dilimlerinde 28 Forex çifti için sinyalleri gösterir. Trendleri ve / veya scalping fırsatlarını belirlemek için
Liquidity Scalper System: gösterge formatında likiditeye dayalı bir işlem sistemi. Çoğu gösterge yalnızca bir ok gösterir; sonrasında stopun nereye konacağına, hedefin nerede olduğuna ve sinyale güvenilip güvenilmeyeceğine trader kendisi karar verir. Liquidity Scalper System işlemin tüm döngüsünü kapsar: likidite havuzlarını bulur, kırılımlarında sinyal verir, Entry, Stop Loss ve üç hedefi anında hesaplar, panelde ise istatistikleri ve yeni veriler üzerindeki doğrulama sonuçlarını gösterir. Sis
Tokyo mt4 Indicator
Vasiliy Strukov
5 (9)
Tokyo Indicator; trend yönü, potansiyel işlem sinyalleri ve piyasa koşulları hakkında net ve görsel bir genel bakış sunar. Renk kodlu ve kademeli trend çizgisi, yükseliş evrelerini (mavi) düşüş evrelerinden (macenta) ayırt eder. Trend değiştiğinde, buna karşılık gelen yön okları potansiyel alım ve satım fırsatlarını vurgular. Entegre bir panel; mevcut sinyali, piyasa eğilimini, momentumu, volatiliteyi ve sinyal kalitesini tek bir kullanışlı görünümde bir araya getirir. Bu sayede yatırımcılar, f
Scalper Vault
Oleg Rodin
5 (40)
Scalper Vault, gün içi işlemlerde istikrar yakalamak isteyen yatırımcılar için tasarlanmış, güçlü ve tam donanımlı bir alım satım sistemidir. Bu yüksek hassasiyetli gösterge; hem Forex hem de İkili Opsiyon yatırımcıları için kurumsal düzeyde analizler sunan, bağımsız ve eksiksiz bir alım satım sistemi işlevi görür. SATIN ALIM İŞLEMİNDEN SONRA BENİMLE İLETİŞİME GEÇİN; ALIM SATIM İPUÇLARIMI VE HARİKA BİR BONUSU ALIN! Tahmin yürütme zorunluluğunu ve karmaşık manuel analiz süreçlerini ortadan kaldır
Currency Strength Exotics
Bernhard Schweigert
4.88 (33)
ŞU ANDA %20 INDIRIMLI! Herhangi bir Acemi veya Uzman Tüccar için En İyi Çözüm! Bu Gösterge, Egzotik Çiftler Emtialar, Endeksler veya Vadeli İşlemler gibi herhangi bir sembol için para birimi gücünü göstermek için uzmanlaşmıştır. Türünün ilk örneğidir, Altın, Gümüş, Petrol, DAX, US30, MXN, TRY, CNH vb. gerçek para birimi gücünü göstermek için 9. satıra herhangi bir sembol eklenebilir. Bu benzersiz, yüksek kaliteli ve uygun fiyatlı bir ticaret aracıdır çünkü bir dizi tescilli özelliği ve yeni b
Scalper Inside PRO
Alexey Minkov
4.74 (69)
Scalper Inside PRO helps you read the intraday trend and plan a trade before you enter the market. It is built around three exclusive strategies for a sharper read of the market. The moment a signal appears, the indicator evaluates market direction and calculates the key levels, so you see the potential entry, the expected stop-loss and several profit-taking levels in advance. Detailed performance statistics show how different instruments and strategies performed in history and help you pick ass
Advanced Supply Demand
Bernhard Schweigert
4.91 (302)
Özel Ticaret –%30 İndirim Yeni Başlayanlar veya Uzman Yatırımcılar İçin En İyi Çözüm! Bu gösterge, bir dizi özel özellik ve yeni bir formül içerdiği için benzersiz, yüksek kaliteli ve uygun fiyatlı bir işlem aracıdır. Bu güncelleme ile çift zaman dilimi bölgeleri gösterebileceksiniz. Sadece daha yüksek bir zaman dilimini değil, hem grafik zaman dilimini hem de daha yüksek zaman dilimini gösterebileceksiniz: İÇ İÇE GEÇMİŞ BÖLGELER GÖSTERİYOR. Tüm Arz Talep yatırımcıları buna bayılacak. :) Önem
Miraculous Indicator Binary & Forex v3 StrategySafe Miraculous Indicator Binary & Forex v3 StrategySafe , net sinyaller, güçlü onay araçları ve Binary ile Forex piyasalarında kullanılabilecek yapılandırılmış bir işlem yaklaşımı isteyen traderlar için geliştirilmiş profesyonel bir indikatördür. v3 sürümü; MIR Dashboard, Miraculous Confirmation Dashboard, GANN Law, Square of 9 seviyeleri, GANN açıları ve daha gelişmiş Forex modu ile daha güçlü bir piyasa analizi sunar. Öne çıkan özellikler Tek ind
This is a professional chart indicator designed for traders focused on stability and clear price action. It helps filter market noise and provides clear visual entry and exit zones for your trading decisions. Core Features: Strictly Non-Repainting: The system is built with strict non-repaint logic. What you see on the chart is the true historical performance. Confirmed Signals: Signals are triggered and confirmed only after the candle closes . Once a trading arrow appears on a closed candle, it
Introducing Volume Orderflow Profile , a versatile tool designed to help traders visualize and understand the dynamics of buying and selling pressure within a specified lookback period. Perfect for those looking to gain deeper insights into volume-based market behavior! MT5 Version -  https://www.mql5.com/en/market/product/122657 The indicator gathers data on high and low prices, along with buy and sell volumes, over a user-defined period. It calculates the maximum and minimum prices during this
"The Squeeze indicator attempts to identify periods of consolidation in a market. In general the market is either in a period of quiet consolidation or vertical price discovery. By identifying these calm periods, we have a better opportunity of getting into trades with the potential for larger moves. Once a market enters into a "squeeze," we watch the overall market momentum to help forecast the market direction and await a release of market energy." Modified TTM Squeeze Indicator is a modifica
Day Trader Master , günlük tüccarlar için eksiksiz bir ticaret sistemidir. Sistem iki göstergeden oluşmaktadır. Bir gösterge, satın almak ve satmak için bir ok işaretidir. Aldığınız ok göstergesidir. Size ikinci göstergeyi ücretsiz olarak sağlayacağım. İkinci gösterge, bu oklarla birlikte kullanılmak üzere özel olarak tasarlanmış bir trend göstergesidir. GÖSTERGELER TEKRARLAMAYIN VE GEÇ KALMAYIN! Bu sistemi kullanmak çok basittir. İki renkli bir çizgi olarak görüntülenen mevcut trend yönündeki o
Gann Made Easy
Oleg Rodin
4.84 (173)
Gann Made Easy , bay teorisini kullanarak ticaretin en iyi ilkelerine dayanan, profesyonel ve kullanımı kolay bir Forex ticaret sistemidir. WD Gann. Gösterge, Zararı Durdur ve Kâr Al Seviyeleri dahil olmak üzere doğru SATIN AL ve SAT sinyalleri sağlar. PUSH bildirimlerini kullanarak hareket halindeyken bile işlem yapabilirsiniz. Satın alma işleminden sonra, alım satım talimatlarını ve harika ek göstergeleri ücretsiz olarak almak için lütfen benimle iletişime geçin! Muhtemelen Gann ticaret yöntem
ZONEFUSION PRO INSTITUTIONAL CLUSTER SYSTEM ZoneFusion Pro, Forex piyasasında hassasiyet, yapı ve tutarlılık arayan trader’lar için geliştirilmiş profesyonel bir işlem sistemidir. Gerçek kurumsal piyasa mantığı üzerine inşa edilmiştir. Bu sistem, ciddi trader’lar, prop firm challenge trader’ları ve SMC trader’ları için tasarlanmıştır. Belirsizliği ortadan kaldırır ve yerine net, kurallara dayalı bir işlem çerçevesi sunar. Çoklu zaman dilimi piyasa yapısı, arz ve talep bölgeleri ve hareketli orta
Pips Generator
Oleg Rodin
4.6 (10)
Apollo Pips Generator , trend yönünde sinyaller veren göstergedir. Gösterge, birden fazla giriş noktası sağlar, böylece her zaman kâr etmek için bir ticaret fırsatı bulabilirsiniz. Ekran görüntülerine dikkat edin. Ekran görüntüleri, Pips Generator aracını, kanal tarafından üstleri ve altları gösteren yıldız sinyalleriyle temsil edilen diğer aracımla birlikte gösterir. Bu kombinasyon, sistemi nasıl uygulayabileceğiniz konusunda size birçok yol sunar. Satın aldıktan sonra İKİNCİ GÖSTERGEMİ ÜCRETSİ
All in One package includes the  Oscillator Predictor ,  MACD Predictor ,  Thrust Scanner  and  Advanced Fibonacci  indicators which are mandatory for applying  Dinapoli  trade plans.  Please visit below links for detailed explanations of indicators. Advanced Fibonacci Indicator =>  https://www.mql5.com/en/market/product/52834 Thrust Scanner Indicator => https://www.mql5.com/en/market/product/52830 Overbought /Oversold Predictor indicator => https://www.mql5.com/en/market/product/52621 Macd P
Bir ok size al der. Obsidian Scalper Pro nereden alacağınızı, stopun nereye gideceğini, üç hedefin nerede olduğunu, riskinize göre pozisyonun ne kadar büyük olması gerektiğini ve kurulumun 100 üzerinden kaç ettiğini söyler. Her sinyal, grafiğe çizilmiş bitmiş bir işlem planı olarak gelir ve yerleşik bir istatistik penceresi son yüz planın dürüst sonucunu, güven aralıklı kazanma oranı dahil, gösterir. Her karar kapanmış bir barda verilir, yani baktığınız geçmiş, işlem yapmış olacağınız geçmişin t
GoldRush Trend Ok Sinyali GoldRush Trend Ok Sinyali göstergesi, XAU/USD'de yüksek hızlı, kısa vadeli scalperlar için özel olarak tasarlanmış hassas, gerçek zamanlı trend analizi sağlar. 1 dakikalık zaman dilimi için özel olarak tasarlanan bu araç, net giriş noktaları için yön okları gösterir ve scalper'ların değişken piyasa koşullarında güvenle hareket etmelerini sağlar. Gösterge, PRIMARY ve SECONDARY uyarı oklarından oluşur. PRIMARY sinyalleri, trend yönündeki değişikliği gösteren Beyaz ve
Yazarın diğer ürünleri
FVG DGT Panel [TMT] — Fair Value Gap and Inverse FVG Indicator with Live "% Left" Fill Tracking for MetaTrader 4 Version for MT4 | Non-repainting zone logic | BUY / SELL / NEUTRAL bias panel | FVG + IFVG | Optional second timeframe 1. Overview FVG DGT Panel [TMT] is a chart-window indicator for MetaTrader 4 that finds, draws and tracks Fair Value Gaps (FVG) and Inverse Fair Value Gaps (IFVG) directly on your price chart. It is a MetaTrader 4 port of the popular "Fair Value Gaps by DGT" concept
Filtrele:
Değerlendirme yok
Değerlendirmeye yanıt